
See Where the Market Is Building Positions; Not Just Where It’s Moving
Understanding price is one thing.
Understanding where positions are building is where real insight begins.
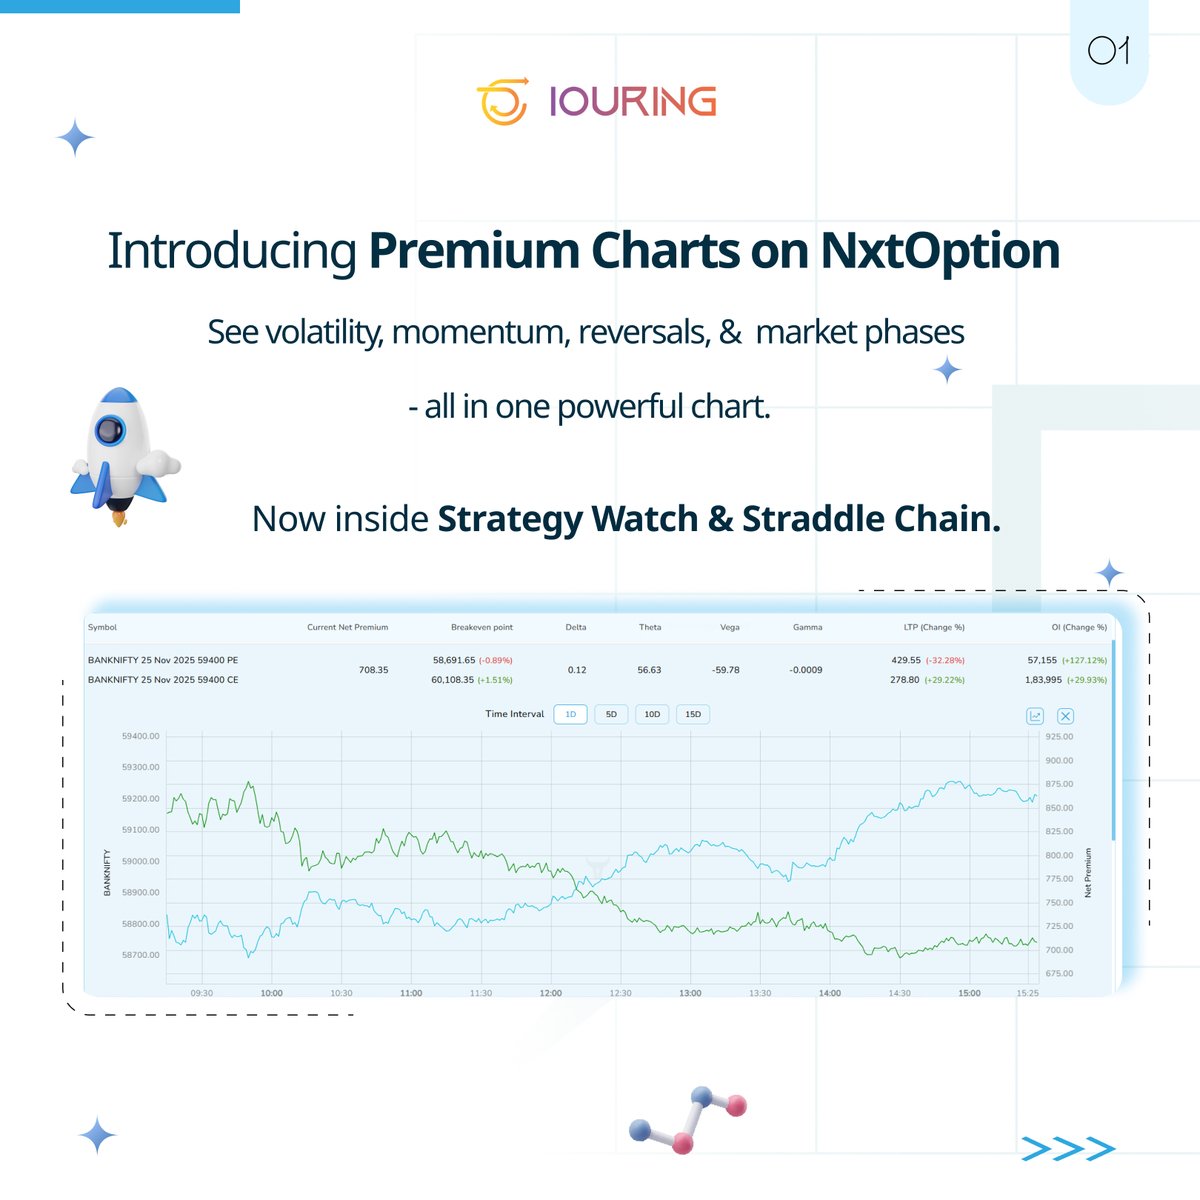
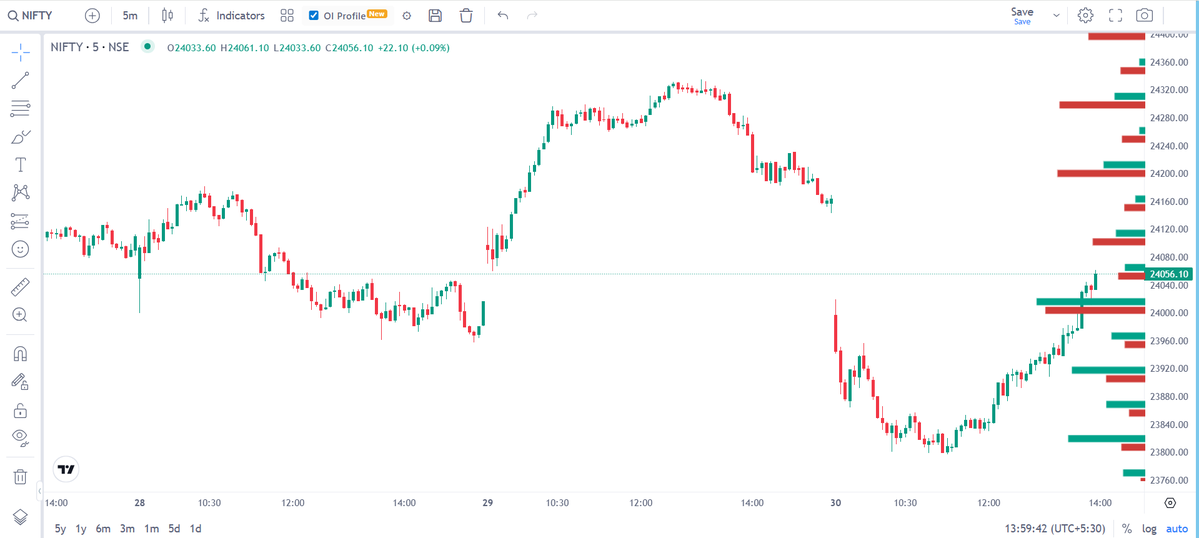
Introducing the OI Profile on NxtOption.
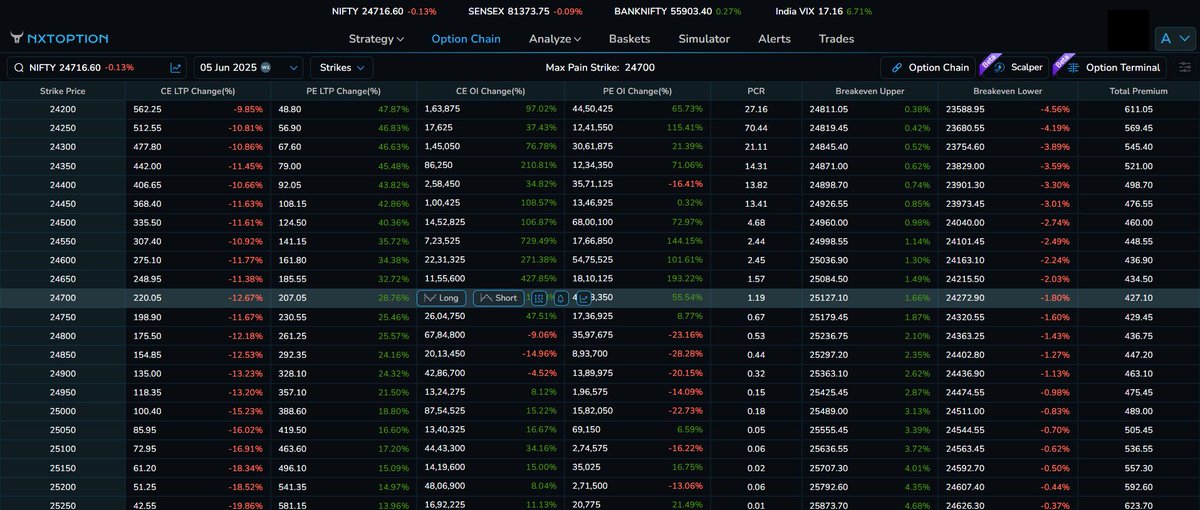
With this feature, users can now view Open Interest (OI) for stocks and indices directly within the Chart Terminal, alongside the Last Traded Price (LTP) chart.
What makes this powerful?
Instead of scanning scattered data, the OI Profile presents Open Interest in a horizontal bar chart, aligned with price levels.
This allows users to:
➤Identify key OI clusters across price ranges
➤Spot potential support and resistance zones
➤Understand where the market is actively building positions
By combining OI distribution (positioning) and LTP chart (price movement), users can start to:
➤Anticipate possible price reactions
➤Gauge market sentiment across levels
➤Make more informed trading decisions
Add your own analysis layer
With integrated charting tools, users can:
➤Mark recent highs and lows
➤Track price movement patterns
➤Overlay insights on top of OI data
Features like OI Profile don’t just enhance charts; they elevate the entire trading experience.
So give your users more than just price charts.
Give them context, clarity, and confidence.
#NxtOption #OptionsTrading #TradingTechnology #Stockbrokers #Fintech #OIProfile #OpenInterest #IOURING
English