Cal

576 posts

Cal banner
Cal

Cal

@OpenSea_8

The market is a sea of infinite opportunities. Be Open. Be Carefree. Trade What We See. 🐳🌅🐚

SoCal U.S. Katılım Mart 2013
850 Takip Edilen164 Takipçiler
Sabitlenmiş Tweet
Cal
Cal@OpenSea_8·
Goals: Improve trade quality. Sharpen intention for every trade. Be selective in picking names and taking trades. Improve risk management. 1. Focus on the best-quality names in leading themes with strong relative strength. 2. Enter only when multiple edges align (increase precision, reduce trade count). 3. Concentrate on 3–5 names (20–30% position size) + a few pilot positions as feelers. 4. Risk Management: Progressive exposure + strict 3–5% stop-loss rule. 5. Develop a better routine to refine the focus list and get mentally prepared.
Cal tweet media
Ameet Rai@AmeetRai

Always define what you’re trying to actually get better at. In 2025, I focused on: – Improving my position sizing – Reducing # of positions – Reducing # of trades – Still outperforming the market By doing just that, trade quality went up, intentions got sharper, and strategic thinking aligned. Write your list for 2026. Make it process-based. Then stick to it. That loop of improvement never ends — unless you forget to define it.

English
0
0
0
303
Cal
Cal@OpenSea_8·
@oratnek_ill Thank you oratnek-san! Yes, it can drill down and show the top ranked holdings from each of the thematic ETFs. I also rank the S&P500 momentum leaders as well using similar logics. Just quick way to see what are gaining momentum so I am aware what rotation is happening.
Cal tweet mediaCal tweet media
English
0
0
2
80
Cal
Cal@OpenSea_8·
@oratnek_ill So true. The process of building our own tools is also the process to refine our own systems, rules and edges.
English
0
0
2
2.9K
oratnek
oratnek@oratnek_ill·
Lately, accounts with large followings have started launching paid stock apps. But there's no need to pay for those. Building your own is far better. I haven't used them, but just from watching the promo videos, they're nothing more than watered-down versions of great existing tools like MarketSurge. Because when you keep building for others, every tool ends up looking the same and becomes boring. Screening with custom indicators like mine isn't a feature you'll find in any of these tools. That's why if you want to build your own edge, you need to build a tool made just for you. And the process of building it is a great learning experience in itself.
English
4
3
57
2.4K
Cal
Cal@OpenSea_8·
I have worked on my own version of Theme Radar lately and it showed similar changes lately to Cybersecurity, Software and Space in additional to AI Semi. It is very helpful to get a sense of rotation based on actual price actions & momentum changes. Thank you for your daily sharing and inspiration!
Cal tweet media
English
4
0
9
4.2K
oratnek
oratnek@oratnek_ill·
I recommend checking RS Radar daily. It can help you build hedges for your portfolio, and if an industry you're not familiar with or not good at trading is ranking high, it can also help you decide to stop trading.
oratnek@oratnek_ill

RS Radar 05/19/2026 - Daily Rank Up / Down $UFO $KIE $BOAT / $ICLN $BLOK $TAN - Weekly Rank Up / Down $KIE $XOP $IAI / $KARS $LIT $REMX - Industry Leaders ( = RS 100 ) $UFO $CIBR $IGV - Industry Laggards ( = RS 0 ) $URA $XBI $REMX $KARS $POWR $IBB $LIT $KWEB $GDX

English
4
1
35
4.3K
Cal
Cal@OpenSea_8·
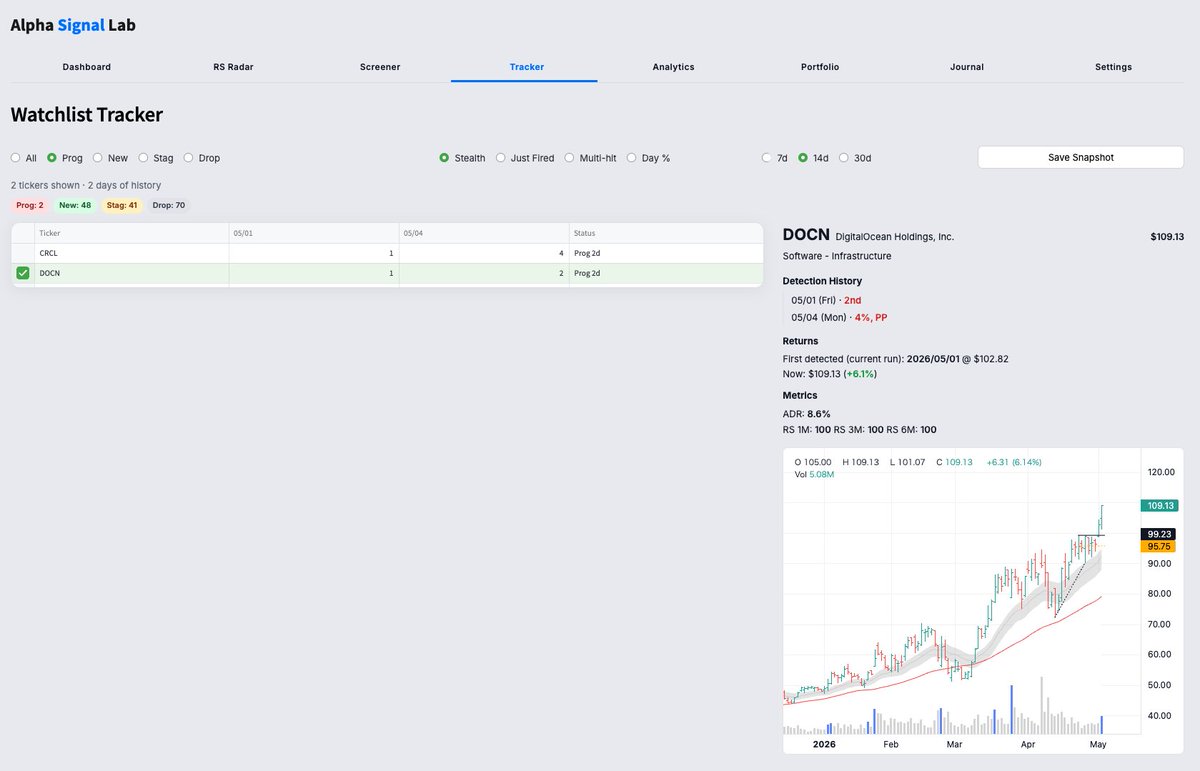
I love the idea! This really tracks and visualizes the journey of progression and helps to bring attention to a stock is about to make the big move earlier (hopefully). Both CRCL and DOCN made big moves these couple days. I have been prioritizing my daily focus based on the number of lists a stock is on for that day, but haven’t thought about looking back to track progression. This should help detect the potential mover sooner, rather than after the big moves.
English
0
0
1
27
oratnek
oratnek@oratnek_ill·
Last weekend, I added a watchlist tracker page to my app. It tracks stocks that have appeared on past lists. I wanted to move from a static approach, where I create a new list each day, to something more dynamic. This should help me re-examine the patterns of stocks that move higher and better organize my watchlist. For example, $CRCL broke its trendline on Friday, and yesterday it gained over 4%, made it onto the Momentum 97 list, triggered a PP, and became a stock that's up over 20% in the past week. $DOCN also broke the 2nd Pivot last Friday, and yesterday it gained over 4% and triggered a PP.
oratnek tweet mediaoratnek tweet media
oratnek@oratnek_ill

Today's Watchlist 05/04/2026 (Sorted by Hybrid RS) LL-HL Structure 1st Pivot $ALAB $SMTC $RDDT $IONQ $QBTS $S $MGNI $BRZE $LZ $RBRK $VERX $TOST $NTSK $HUBS $NABL $FUBO $MNDY $INTA $PAYC LL-HL Structure 2nd Pivot $AAOI $TWLO $HIMX $WOLF $KOS $NN $RNG $DOCN $KODK $FSLY $NET LL-HL Structure Trend Line Break $MOD $BAK $YOU $NWL $CBZ $ZG $Z $WIX $CRCL $FRSH $APP $NCNO $TDC $SSRM $UA etc. 21 EMA Structure $AMPX $NN $FRO $AEVA $YOU

English
4
4
40
3.8K
Cal
Cal@OpenSea_8·
🙏 I will look into this option once my app becomes mature. So just want to make sure I understand correctly, your app uses the FMP API to monitor intraday price actions, news, and other useful data feeds and then use Discord to send notifications once a setup is detected or certain criteria are met. You are not building the monitoring function directly into Discord, are you?
English
1
0
1
67
oratnek
oratnek@oratnek_ill·
There’s about a one-minute delay at most with Discord, but for example, it constantly scans stocks with a market cap over 1B, average volume over 1M, and ADR above 4%, and only sends notifications when a stock completes a setup I’ve defined. This significantly cuts down the time I spend watching charts intraday. I also wanted to keep my TradingView lists as simple as possible, so I decided to go with Discord.
English
1
0
2
153
oratnek
oratnek@oratnek_ill·
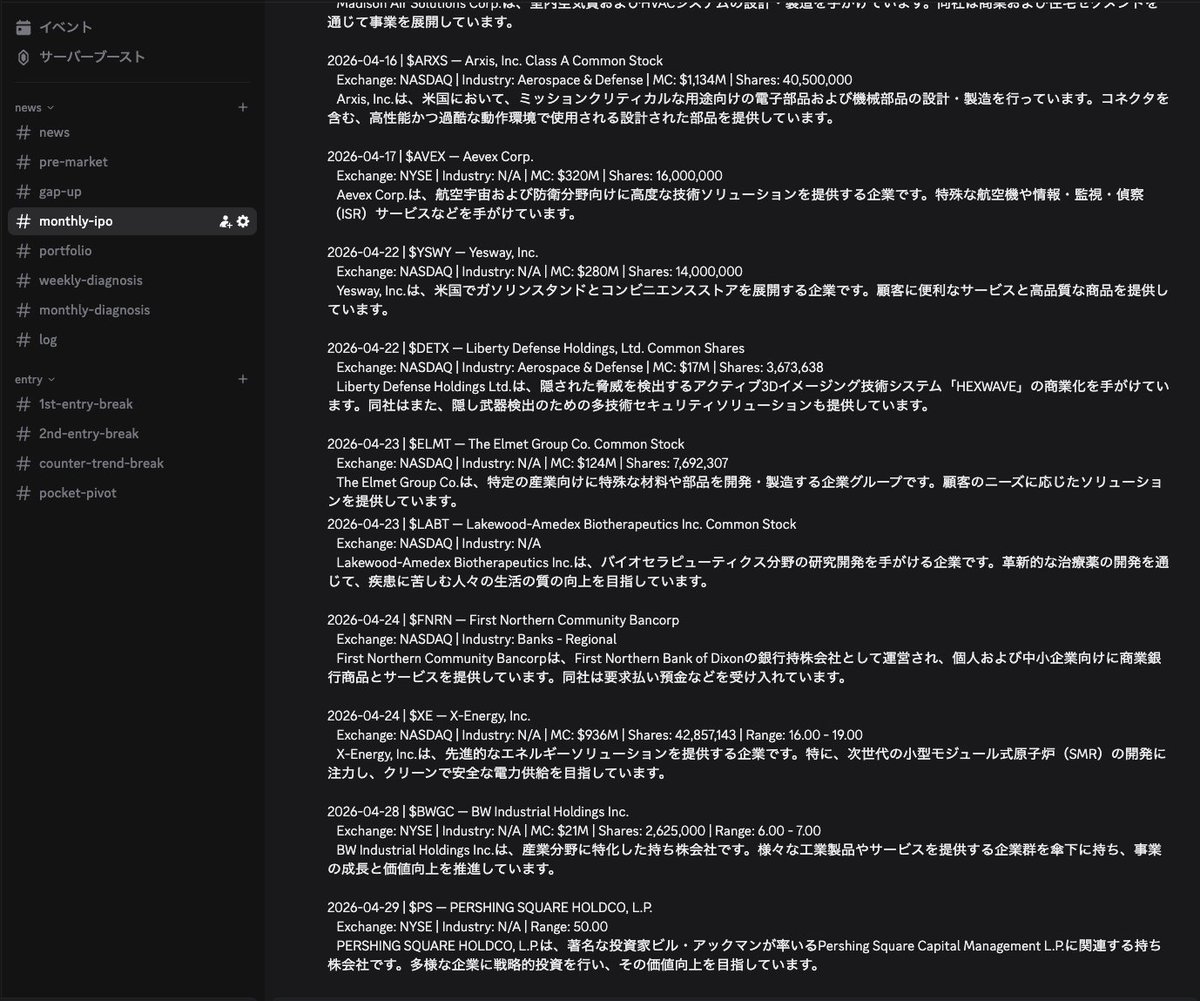
If you've been building a stock app with AI, you're probably already using some kind of API. If you have room in your API limits, I'd recommend setting up a Discord server. I have everything automated with notifications: major news every few hours, premarket data, opening gap ups, upcoming IPOs for the month, portfolio analysis, and weekly/monthly portfolio reviews. Plus, LL-HL signals and PP alerts arrive with at most about a one-minute delay. It saves me from having to create tons of watchlists on TV.
oratnek tweet media
English
4
6
74
4.1K
Cal
Cal@OpenSea_8·
I really like the idea of using the LL-HL Structure to filter out actionable stocks. Impressed that you built it into the screeners. 0.618 Fib is a cool idea for early entry. I have begun using 0.618 Fib to set alternative Stop as well just to experiment. Thanks for sharing the updated screens!!
English
0
0
3
5.4K
oratnek
oratnek@oratnek_ill·
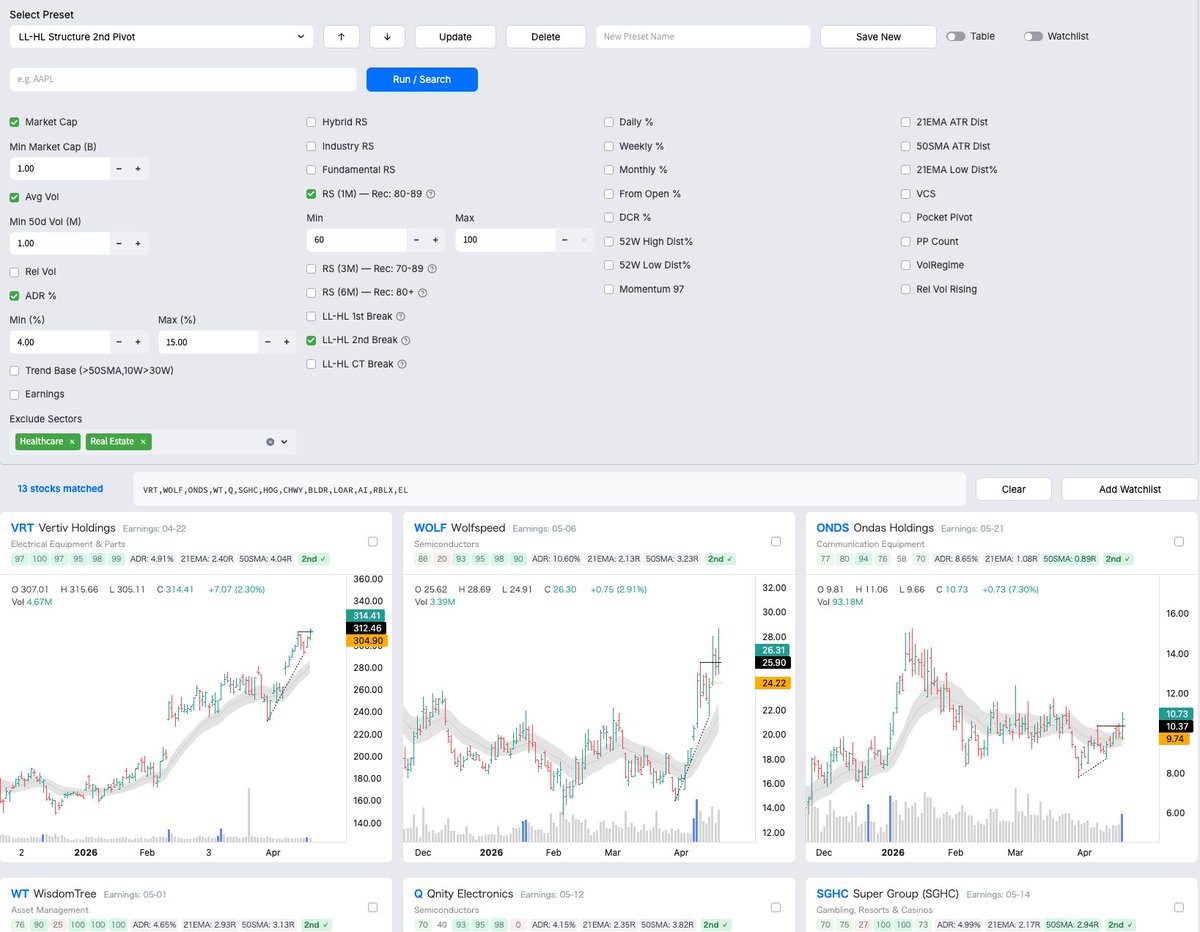
Starting today, I've updated the Watchlist and added three new scans. I've customized my Structure Pivot indicator. Once an LL–HL is confirmed, the 0.618 Fibonacci level between HL and the swing high (the highest point between LL and HL) becomes the 1st Pivot, and that swing high itself becomes the 2nd Pivot. I've added both as new screener scans. For stocks where LL–HL hasn't formed yet, the indicator also draws a descending resistance trendline. I've added a third scan for stocks that break above this line. Here are my current 12 screener presets. ① LL-HL Structure 1st Pivot  MC≥1B / Vol≥1M / ADR 4-15% / RS(1M) 60+ / LL-HL 1st Break ② LL-HL Structure 2nd Pivot  MC≥1B / Vol≥1M / ADR 4-15% / RS(1M) 60+ / LL-HL 2nd Break ③ LL-HL Structure Trend Line Break  MC≥1B / Vol≥1M / ADR 4-15% / LL-HL CT Break ④ 21 EMA Structure  MC≥1B / Vol≥1M / ADR 4-15% / RS(1M) 60+ / DCR 20+ / Weekly % 0-15% / 21EMA ATR Dist -0.5R-+1R / 50SMA ATR Dist 0R-3R / 1+ Pocket Pivot in 20D / Trend Base ⑤ 4% Bullish  MC≥1B / Vol≥1M / ADR 4-30% / Daily % 4-50% / From Open 0+ / RS(1M) 60+ / Rel Vol 1x+ / Trend Base ⑥ Momentum 97  MC≥0.2B / Vol≥1M / 1W top 3% AND 3M top 15% / Trend Base ⑦ PP (Vol >10D)  MC≥1B / Vol≥1M / ADR 4-15% / 1+ PP in last 20 days ⑧ PP 3+ times (20D)  MC≥1B / Vol≥1M / ADR 4-15% / RS(1M) 60+ / 3+ PP in 20D / Trend Base ⑨ Volume Accumulation  MC≥1B / Vol≥1M / ADR 4-15% / 2+ consecutive up-days with Rel Vol ≥ 1.2 ⑩ VCS 52W High  MC≥1B / Vol≥1M / ADR 4-15% / 52W High Dist -20 to 0% / VCS 55+ / Trend Base ⑪ VCS 52W Low  MC≥1B / Vol≥1M / ADR 4-15% / RS(1M) 60+ / Rel Vol 1.2-10x / 52W Low Dist 20-200% / VCS 55+ ⑫ Weekly 20% + Gainers  MC≥1B / Vol≥1M / ADR 4-15% / Weekly % 20-200% Glossary - MC: Market Cap - Vol: 50-Day Average Daily Volume - ADR: Average Daily Range (%) - RS (1M): 21-day Relative Strength percentile vs SPY - DCR: Daily Closing Range - LL-HL: Lower Low → Higher Low structure - CT Break: Counter Trend Break - PP: Up-day volume exceeding any of the past 10 days - VCS: Volatility Contraction Score - Trend Base: Price > 50SMA , 10WMA > 30WMA - Rel Vol: Today's volume ÷ 50-day avg - Exclude: Healthcare / Real Estate removed from all presets I hope you find this helpful.
oratnek tweet media
oratnek@oratnek_ill

Today's Watchlist 04/21/2026 (Sorted by Hybrid RS) LL-HL Structure 1st Pivot $PANW $ENPH LL-HL Structure 2nd Pivot $VRT $WOLF $ONDS $WT $Q $SGHC $HOG $CHWY $BLDR $LOAR $AI $RBLX $EL LL-HL Structure Trend Line Break $YOU $VIST $LXU $KVYO $DXC $NTNX $AVPT $NOW $BILL $SNOW $DUOL $DOCU $MNDY $ESTC $IT 21 EMA Structure $RDW Tickers in 3+ watchlists $MXL $AEHR $BB $USAR $YOU $GFS $LWLG $NN $ONDS $POET $RKLB $WT

English
4
7
95
9.5K
Cal
Cal@OpenSea_8·
@oratnek_ill I really like how it detects certain subtle LL-HL structure that my eyes would have missed. It also helps me to have discipline with the pivot as a guided visual reference. I will need to try the alert feature. Thanks you for sharing your works as always!
English
0
0
0
25
oratnek
oratnek@oratnek_ill·
Structure Pivot (LL-HL/HH-LH) tradingview.com/script/Q0bvWSB… I'm grateful that the Structure Pivot indicator has received over 1,700 boosts and 20,000 views in about four months since its release. This indicator automatically detects LL-HL or HH-LH patterns and displays pivot lines. When HL or LH has not yet formed, it draws trendlines automatically and also shows past pivot lines. It comes with various customizable settings and an alert feature. My settings are min length 2 and max length 10, but if you want to detect pivots earlier, I recommend setting max length to 5. All of my indicators are open source. They work great as they are, but feel free to customize them and build your own edge.
English
2
15
155
9.1K
Cal
Cal@OpenSea_8·
@oratnek_ill A very different perspective from most people. I like the way the tree shadow frames the petals on the ground. How do you like GR3X?
English
0
0
0
51
oratnek
oratnek@oratnek_ill·
Went for a walk with my camera for the first time in a while. Cherry blossoms.​​​​​​​​​​​​​​​​🌸 #gr3x
oratnek tweet mediaoratnek tweet mediaoratnek tweet media
English
3
0
27
1.6K
Cal
Cal@OpenSea_8·
@oratnek_ill Intersting. I've been manually applying Fibonacci retracement for stop placement, mostly on gap entries. Is the structure pivot indicator using the distance from HL to the Pivot line for Fibonacci retracement calculation?
English
0
0
0
27
oratnek
oratnek@oratnek_ill·
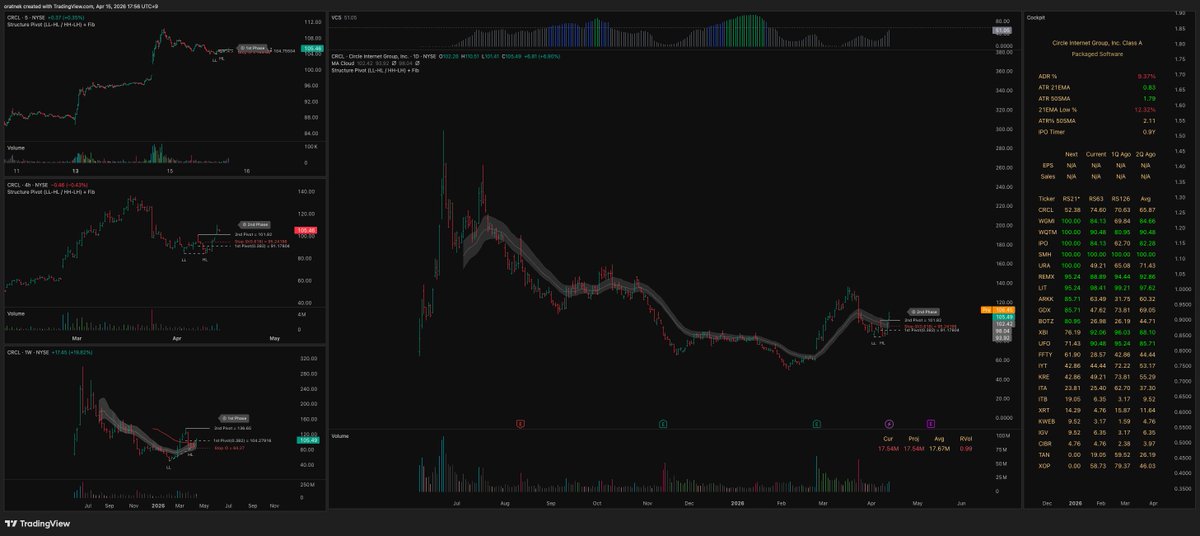
Portfolio 04/15 $AAOI $AMPX $BE $CENX $CIEN $CRCL $LASR $LITE $NBIS $PL $SNDK $TTMI $VIAV $VSAT $WDC $WULF New : CRCL Trim : BE Stop : FLY (Phase2) CRCL had its highest volume in the last 10 days yesterday, rebuilt the LL-HL structure, and on the weekly chart, it is now above the 10WMA and 30WMA. If this continues, the 10WMA and 30WMA will form a golden cross. I've also started testing a Fibonacci element added to the Structure Pivot indicator.
oratnek tweet media
English
1
5
55
3.9K
Cal
Cal@OpenSea_8·
@wey_how12640 So that’s the secret to catch a 24% EP! Enjoy your trip!
English
0
0
2
65
Wey How
Wey How@wey_how12640·
Trading by the Sea Since the market went up when I was travelling last week, I figured I can go for a short trip again this week and let the magic works again, if there is any positive correlation. But good investing should be a joyful experience nonetheless. $BE (long) a jaw dropping +24% today. Sorry to disappoint, it should be less charts, more travel photos incoming this week.
Wey How tweet mediaWey How tweet mediaWey How tweet media
English
6
0
54
3.6K
Cal
Cal@OpenSea_8·
That’s a great tip. When the market ignores the bad news, it is a subtle sign of sentiment shift and momentum shift. We should act on the positive price actions. I remember your market condition score was at only 8 (extremely bearish) at the time. That extreme bearishness could be another indicator of market bottoming. Always learning!🙏✨
English
0
0
0
28
oratnek
oratnek@oratnek_ill·
We've been through a lot of experiences. April 7th last year was one of them. I started building positions when the market began ignoring the news.
Cal@OpenSea_8

@oratnek_ill Great portfolio of many strong leaders! How did you find the courage and conviction to opened many positions on April 1st and 2nd when the market sentiment/condition was still very negative.

English
1
1
25
2.9K
Cal
Cal@OpenSea_8·
@oratnek_ill Great portfolio of many strong leaders! How did you find the courage and conviction to opened many positions on April 1st and 2nd when the market sentiment/condition was still very negative.
English
0
0
1
3.1K
oratnek
oratnek@oratnek_ill·
My portfolio is now at 16 positions, which is already pretty crowded. From here, I'll focus on trimming and letting the winners run. If you've been tracking my watchlist, you probably noticed last Friday that actionable setups are pretty limited right now. Plenty of names are already up 20% plus in just a week. Don't get caught chasing out of FOMO. Over half of my positions were built on April 1st to 2nd. The good entry windows are largely behind us.
oratnek@oratnek_ill

PF 04/13 $AAOI $AMPX $BE $CENX $CIEN $FLY $LASR $LITE $NBIS $PL $SNDK $TTMI $VIAV $VSAT $WDC $WULF New : AMPX / LASR

English
2
4
62
5K
Cal
Cal@OpenSea_8·
Thanks for sharing the insight! Simplicity works best. Once we identify the consistent leaders, if we could simply focus on finding ways to take positions in these market leaders and sit until the trend bends, we are much better off than chasing evening shiny objects from the daily scan.
English
2
0
1
76
Wey How
Wey How@wey_how12640·
Top Gainers - Why I Don't Have to Scan Everyday Exactly one month has passed since this last scan. What happened to those that I remarked as "Consistent Leaders"? Most are simply advancing higher, in some cases much higher. The changes in YTD gains from one month ago: $SNDK from +153% to +249% $LITE from +62% to +137% $CIEN from +40% to 106% Personally still invested in $SNDK, $LITE, $CIEN with decent size. My process see no reason to sell stocks which are still going up. $BE +76% to +84% (honorable mention....this is a tough one!) p.s. I didn't save my exact search criteria last time so to avoid inconsistency, there is no new updated table this time, but even without the exact details, this is still a pretty simple scan for top gainers that everyone can easily do. “The only sound reason for buying a stock is that it is rising in price. If that is happening, no other reason is required. If that is not happening, no other reason is worth considering.” ~ Nicholas Darvas Sometimes you just need to watch the leaders and find a spot to get in, or ask yourself why are you not in.
Wey How@wey_how12640

Top Gainers over +30% 2026 YTD $SNDK $TPL $CF $BE $LITE $VRT $FIX $GLW $TER $CRCL $BG $FTI $CIEN $KEYS $MU $LMT $MTZ $XPO $UI $PWR $STX $LNG ☠️Choppy Index, with now a rounding top. ☠️Heightened Volatility. Weak sentiments. 👀Extreme bifurcation. ☠️GeoPolitical Tension with no certainty on how the war will resolve. This is a hostile trading environment for most traders even at the expert level. Unless you miraculously gained traction (we all like to hear your secrets) in the past two months, the best you can do is to do less and patiently wait at the sideline, and wait for the conducive environment for your strategy to work out. Bear in mind this might take longer than expected. Another 3 months? 18 months? As long as it takes to minimise your drawdowns on both your financial and mental capital. Despite the index breaking down, there are still stocks registering positive YTD returns. Objectively it means if you are miraculously long in these trades, you are still beating the index, and with quite a handsome returns (e.g. $SNDK +153%!). Note that past performance doesn't guarantee the future, but here is a simple scan results from Trading View for market cap over $20bn ordered by their performance YTD. It shouldn't be a surprise that most of the top gainers are still the pick-and-shovel play, a clear beneficiary sector from the huge AI capex. In this chart I also pay attention to the past 1 year performance, and also the past 3 months, to understand if the strength is more of a result of recent catalysts or it has been a consistent leader in the past. Personally this year I have ignored the index and focus on the strength in individual stocks, and lucky to be in some of the top gainers. It is just the inevitable outcome of me doing me things, and things certainly could change when the market condition worsen and no living themes survive - if the same strategy no longer work I will just respect it and get out, there is no need to over complicate things. Know yourself and take care.

English
1
3
29
3.4K
Cal
Cal@OpenSea_8·
@wey_how12640 $BE is doing its thing again!! What an AH move!
English
0
0
1
92
Wey How
Wey How@wey_how12640·
Holy cow +16% already
English
3
0
5
929
Wey How
Wey How@wey_how12640·
$BE (long) I woke up to read a catalyst, and see an 8%ish move to new ATH after hours lol. 美國清潔能源公司Bloom Energy:與甲骨文擴大戰略合作伙伴關係,計劃部署高達2.8GW的裝機容量,以加速人工智能基礎設施的建設。首批1.2GW項目已簽約,部署正在進行,並將持續至明年。
GIF
Wey How@wey_how12640

$BE (new) I know ~ it is notorius for its daily volatility. Weekly Chart looks perfectly fine though. Just a 4% starter ahead of its earnings next month. So now I have $GEV, $BE, and $CCJ as AI power related names, combined weight about 12%.

中文
6
1
19
4.4K
Cal
Cal@OpenSea_8·
@oratnek_ill Good advice! I noticed that you kept $SNDK when it closed below 21EMA Low. Is it because it found support at the 50SMA below? $TER and $VRT were both close call today closing right at 21EMA Low.
English
0
0
0
267
oratnek
oratnek@oratnek_ill·
PF 03/27 $AMPX $AXTI $CIEN $LASR $LITE $PL $SNDK $TER $VIAV $VRT $VSAT $WDC Stop : WULF Tough week out there. Some of you are probably sitting on big losses. But this is exactly the kind of market where you need to review your actions, figure out what you could have done differently, how to avoid those losses next time, and how to approach next week. Check if your risk is under control, if your position sizes are too big, how your portfolio and cash levels look. Make sure to go through your trade history and analyze your performance. More than any indicator or chart setup, your trading journal is the most valuable thing you have. Take the time to really break it down. This is why I built an app. Honestly, for anything other than trade analysis, there are already plenty of tools out there. As for scanners, I couldn’t find one I was fully satisfied with, so I put a lot of effort into building that side as well, right after the analysis. But I’ve spent far more time building out the trade analysis features. That said, take it easy this weekend, whether that’s relaxing at home or getting out for a reset. Don’t overthink it. I’m just keeping it simple this weekend, getting a haircut tomorrow 💇‍♂️
English
2
3
56
2.5K
Cal
Cal@OpenSea_8·
@oratnek_ill Oops. That one month ago. It is in the 40s now. Your prediction was spot on!
English
0
0
1
24
Cal
Cal@OpenSea_8·
@oratnek_ill I am surprised it is still above 65. Feels like it should be in the 50s. Is S5TH included in your overall Market Condition score calculation on your dashboard along with S5FI and S5TW for market breath?
English
1
0
1
62
oratnek
oratnek@oratnek_ill·
S5TH This shows the percentage of S&P500 stocks trading above their 200SMA. Since $RSP has been moving mostly sideways, S5TH is currently at 65.40. I am not being optimistic about the current market at all, but if you’re feeling fear due to the recent pullback, it’s still too early. When S5TH starts falling below 50, that’s when you’ll start to feel real fear. That said, no one knows yet whether it will actually get there.
oratnek tweet media
English
3
1
35
3.7K
Cal
Cal@OpenSea_8·
Interesting concept. Kelly Criterion often leads to big risk exposure if win rate is above 30% on 3:1RR. At 35% win rate, a full Kelly would risk ~13% total equity per trade. Even half Kelly or quarter Kelly seems aggressive. It is very sensitive though so a small adjustment to win rate and RR could greatly alter the Kelly %. I personally get uncomfortable if I risk more than 1.5% equity per trade. 😅
English
0
0
0
48
oratnek
oratnek@oratnek_ill·
I adjust my position sizing based on market conditions. When my market condition score is between 50 and 80, where my performance is strongest, I reduce the number of positions and increase the size of each position. I keep detailed trade records, so I use the Kelly Criterion for sizing. I apply half Kelly in the 50 to 80 range, and quarter Kelly outside of it. I also run Monte Carlo simulations to continuously assess the robustness of my strategy.
ZAIN@reach_zain

@oratnek_ill Do you allot fix percentage size of portfolio in trade or it depend on SL % /100?

English
3
2
31
3.7K