Orion Engine
1.8K posts

Orion Engine
@OrionEngineApp
Find similar past market setups across 30+ years of price action, macro regimes, correlations, volatility; then study what happened next. Try ORION free below ↓

$SPY just logged its lowest volume day since mid-February. Market stopped moving over the last four hours there.

Great find by @colin_gladman! In fact, when searching for similar historical ranges for the past two months of price action, I noticed that most of times, the sweep always happens right before the reversal. You can see it pretty clearly in the historical view below.

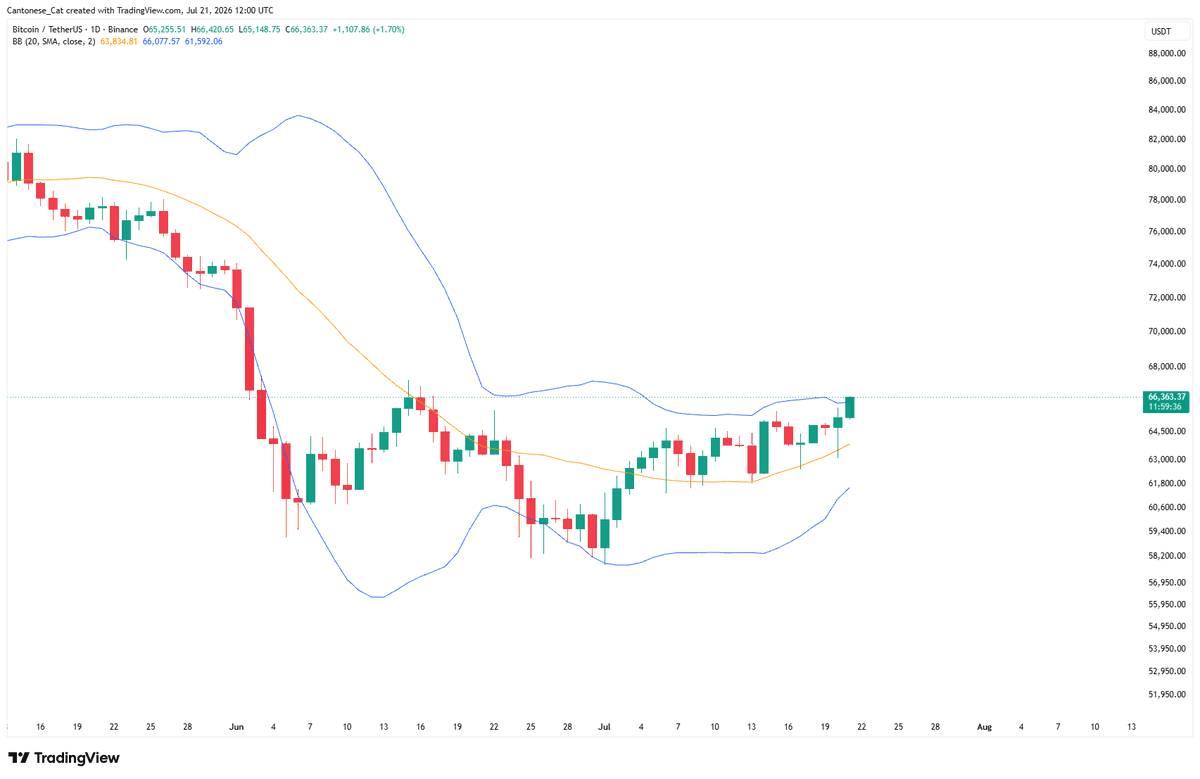
$BTC #Bitcoin so far the slow upwards momentum from early July has been tracking as expected below with a series of higher highs and higher lows in a tight channel. The same search for a clue on short term direction remains the same: this PA is telling of an imminent breakout.

$BTC #Bitcoin so far the slow upwards momentum from early July has been tracking as expected below with a series of higher highs and higher lows in a tight channel. The same search for a clue on short term direction remains the same: this PA is telling of an imminent breakout.


Observing the 6 month chart, $BTC usually prints 2 red 6 month candles before continuing higher. The current 6 month candle closes in July, 25 days from now. So, based on this theory, the next 6 month candle should be green, meaning the move down we're seeing right now could actually be the capitulation candle. Because we topped earlier in this bull cycle (October), Q4 sellers were front run. If that's the case, it's reasonable to assume Q4 buyers will get front run as well.

$BTC #Bitcoin so far the slow upwards momentum from early July has been tracking as expected below with a series of higher highs and higher lows in a tight channel. The same search for a clue on short term direction remains the same: this PA is telling of an imminent breakout.


Credit anxiety is showing up in the broader credit-protection market. CDX just crossed above its 50-day moving average after 66 straight days below it. Historically, periods above this threshold have been a tougher backdrop for equities.


$BTC #Bitcoin so far the slow upwards momentum from early July has been tracking as expected below with a series of higher highs and higher lows in a tight channel. The same search for a clue on short term direction remains the same: this PA is telling of an imminent breakout.


$BTC LTF Price has been forming this ascending wedge which typically is a bearish one. We need to break decisively above that 66.3 ish in order to run to our 69-72k target. Otherwise we risk having another painful experience in the dog house at low 60s. Lets move it, we need bulls to pick up some steam here.

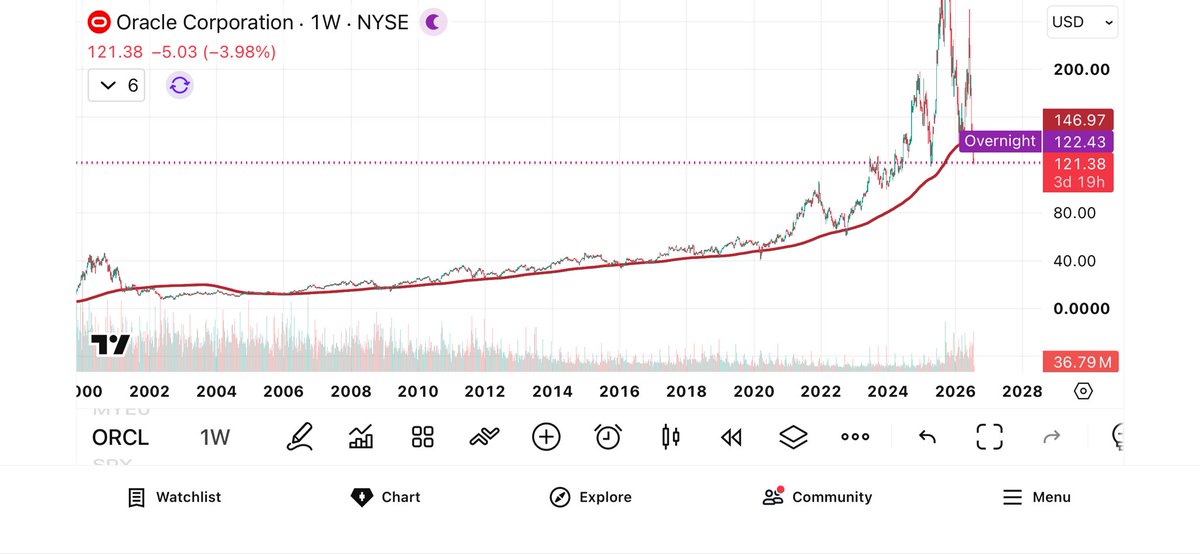
$ORCL not the time to be bearish historically speaking. While the price action has been nasty for the past year, it is also the same price action that usually preceded the big runs in the stock like in 1990, 1998 and 2002. There's no AI boom without ORCL... @Globalflows

Great find by @colin_gladman! In fact, when searching for similar historical ranges for the past two months of price action, I noticed that most of times, the sweep always happens right before the reversal. You can see it pretty clearly in the historical view below.


$ORCL not the time to be bearish historically speaking. While the price action has been nasty for the past year, it is also the same price action that usually preceded the big runs in the stock like in 1990, 1998 and 2002. There's no AI boom without ORCL... @Globalflows


$BTC #Bitcoin so far the slow upwards momentum from early July has been tracking as expected below with a series of higher highs and higher lows in a tight channel. The same search for a clue on short term direction remains the same: this PA is telling of an imminent breakout.


$BTC #Bitcoin wants higher based off the price action of the last 4 months. If we compare with historical analogs of similar behaviour over this timeframe, the consensus was a grind higher for the coming months. Considering how little Saylor selling and war starting have managed to push the coin below $60k, it really does seem like the bottom is in.

$ORCL not the time to be bearish historically speaking. While the price action has been nasty for the past year, it is also the same price action that usually preceded the big runs in the stock like in 1990, 1998 and 2002. There's no AI boom without ORCL... @Globalflows