TradeAstra

6.8K posts

TradeAstra banner
TradeAstra

TradeAstra

@PHI_StockMarket

TradeAstra | Stocks • Trading • Breakouts 📈 Educational only. Not financial advice.

Katılım Ekim 2021
36 Takip Edilen2.7K Takipçiler
Sabitlenmiş Tweet
TradeAstra
TradeAstra@PHI_StockMarket·
🚀 IS YOUR CHART READY FOR THE UPGRADE OF THE YEAR? 🚀 Forget indicator overload. THIS changes everything. 🔥 INTRODUCING THE "ALL-IN-ONE ALPHA" INDICATOR 🔥 This isn't just another tool. It's your co-pilot, your analyst, and your edge—automated. 
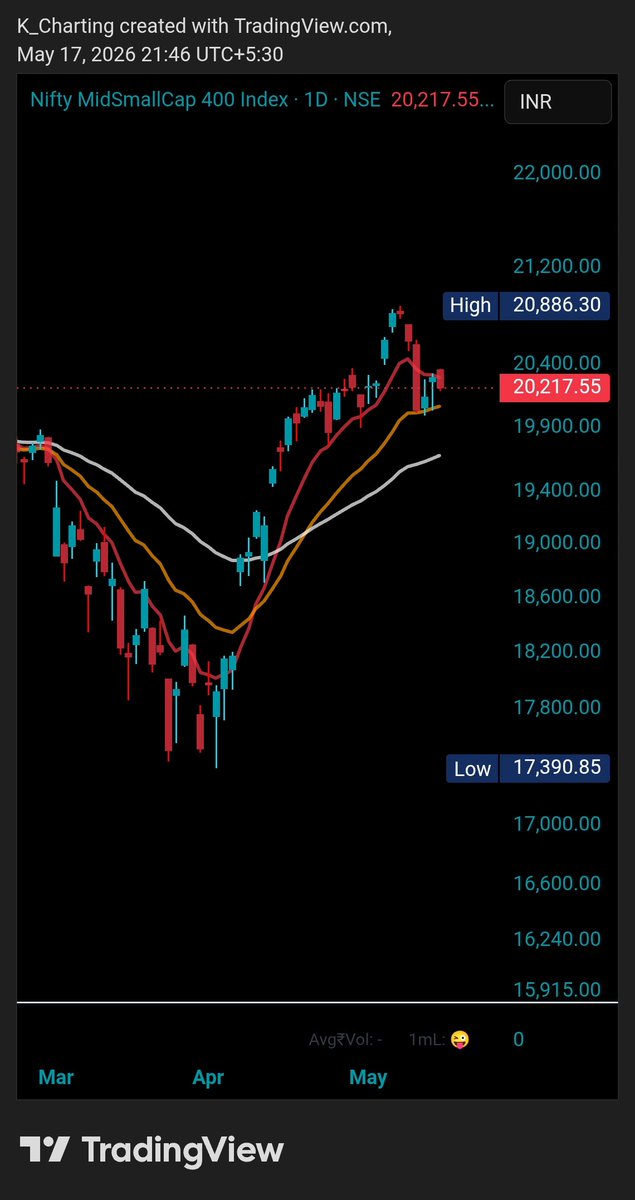
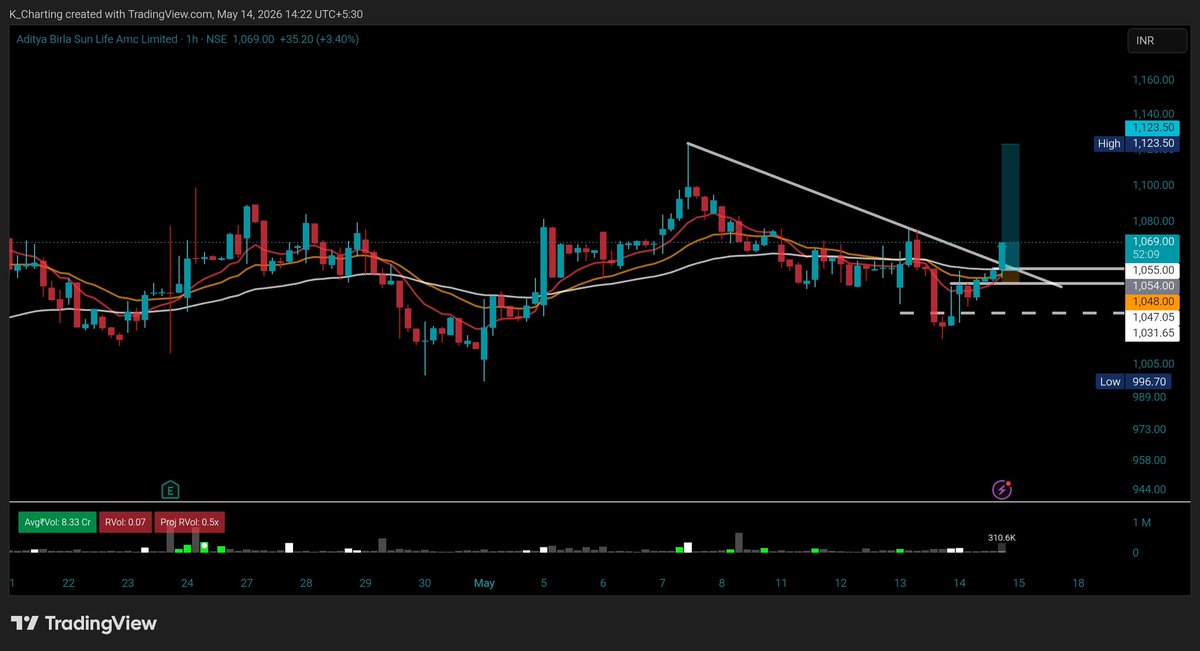
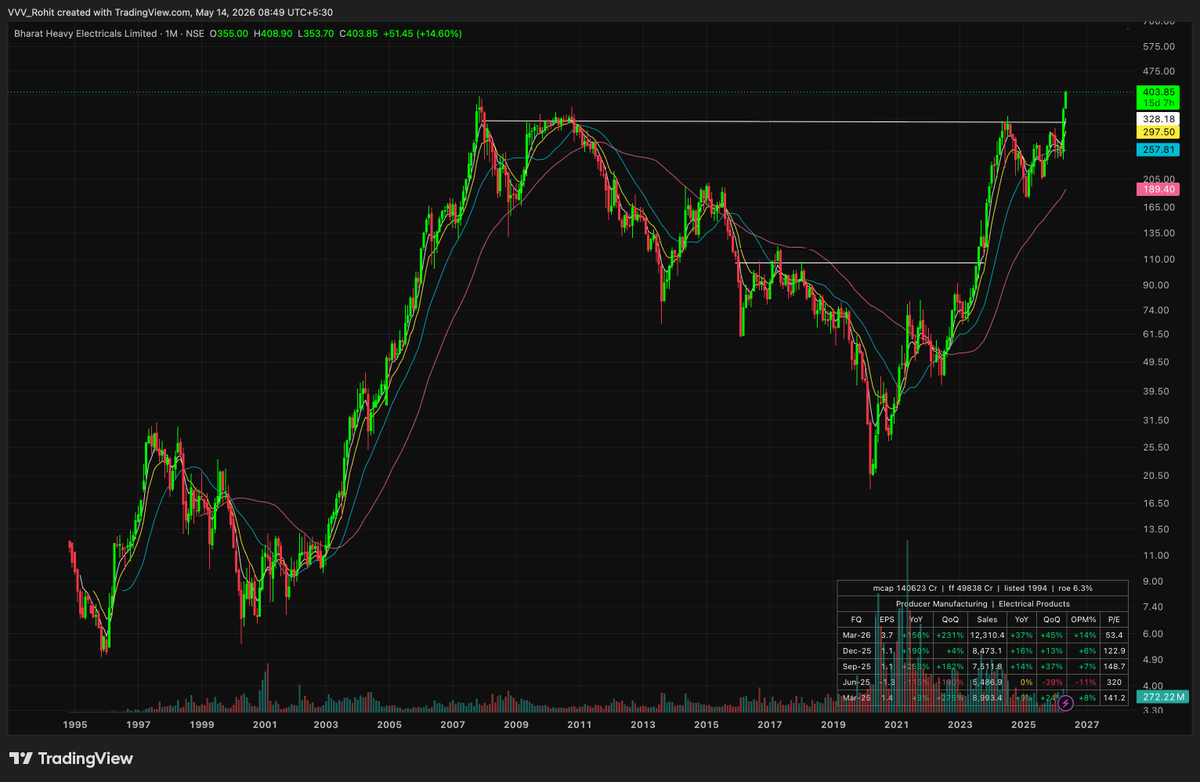
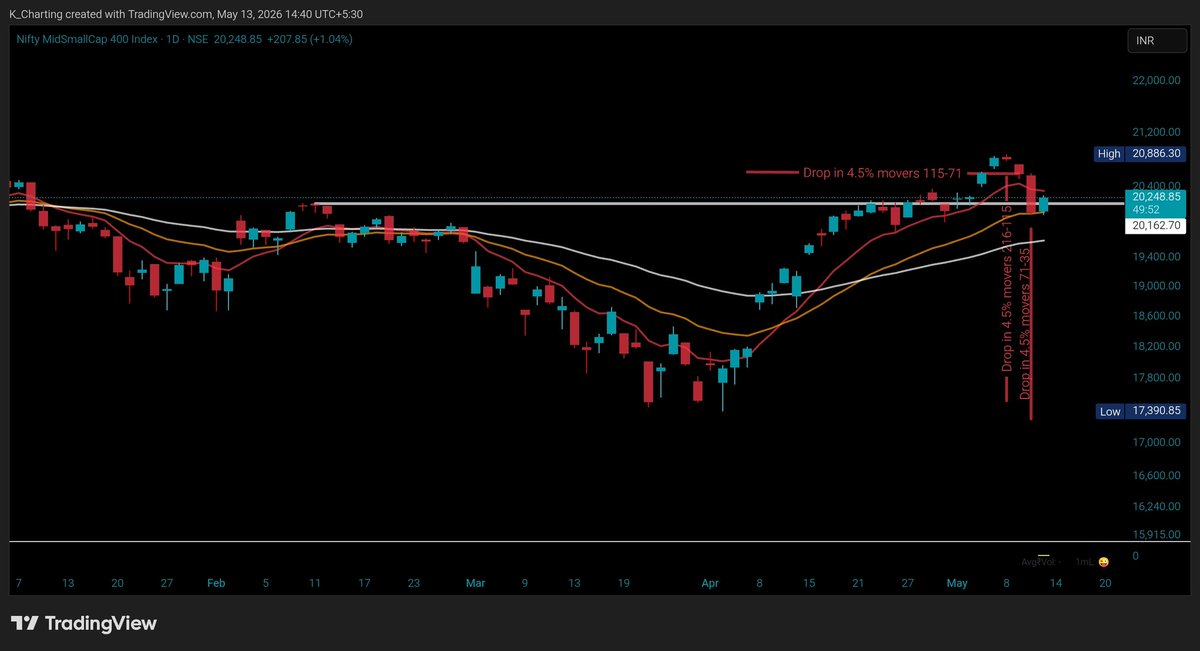
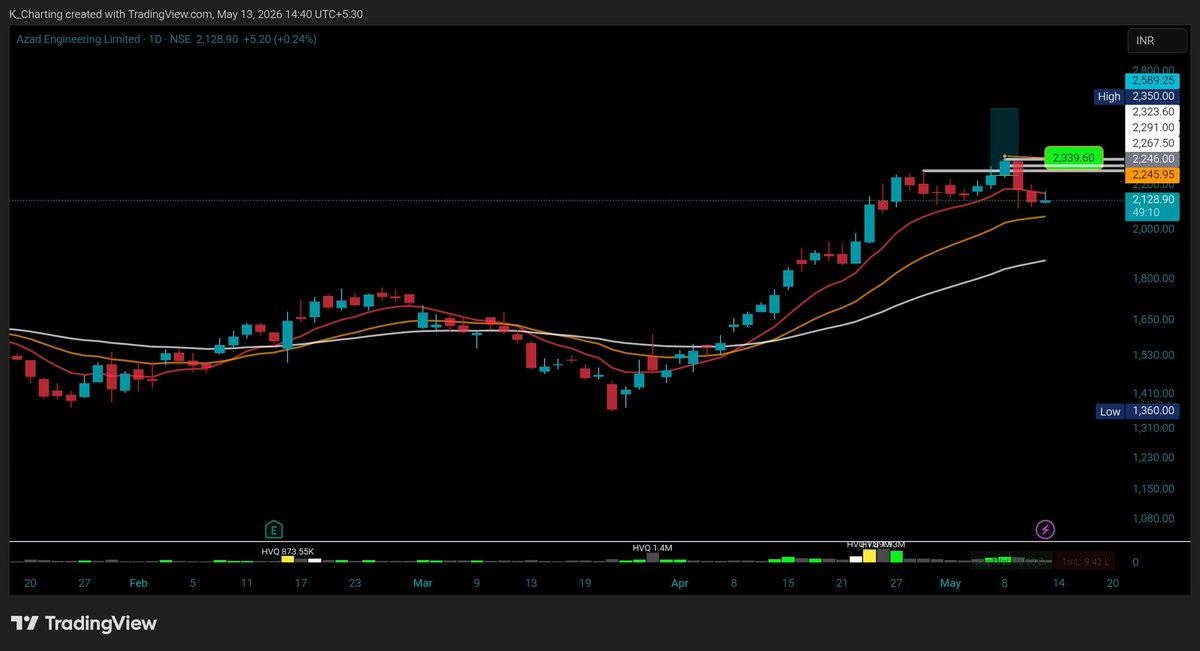
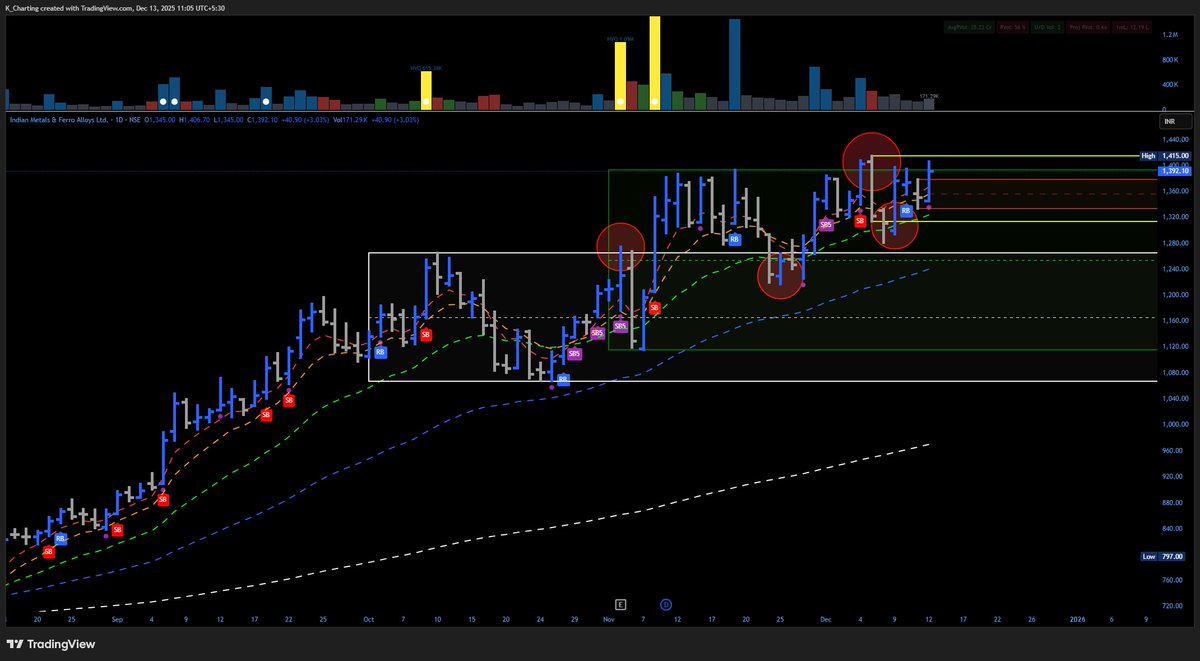
📊 5 Dynamic EMAs (5, 9, 10, 21, 200) See the trend story INSTANTLY. From lightning-fast momentum (5) to the unwavering trend king (200)—it’s all on screen. ✅ SMART MONEY BUY SIGNALS (INCLUDES ICT LOGIC) It hunts for retracement buys, liquidity grabs, and FVG fills like a bloodhound. And the BEST part? IT IGNORES SIGNALS IN DOWNTRENDS. No more catching falling knives. Only high-probability setups. 
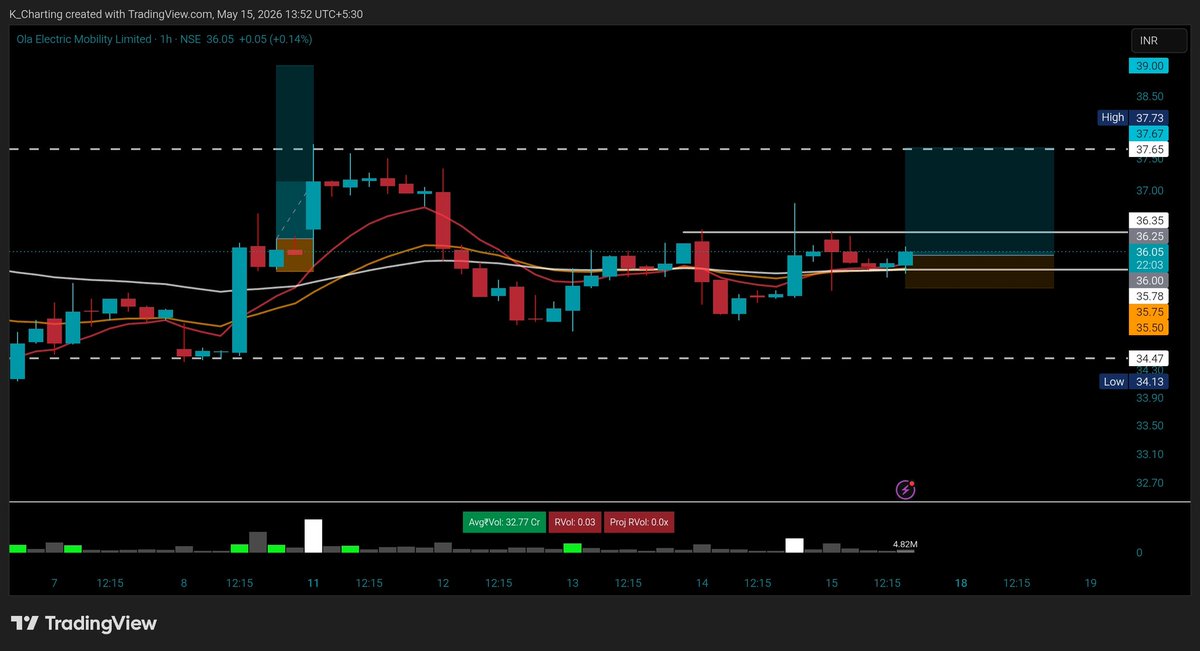
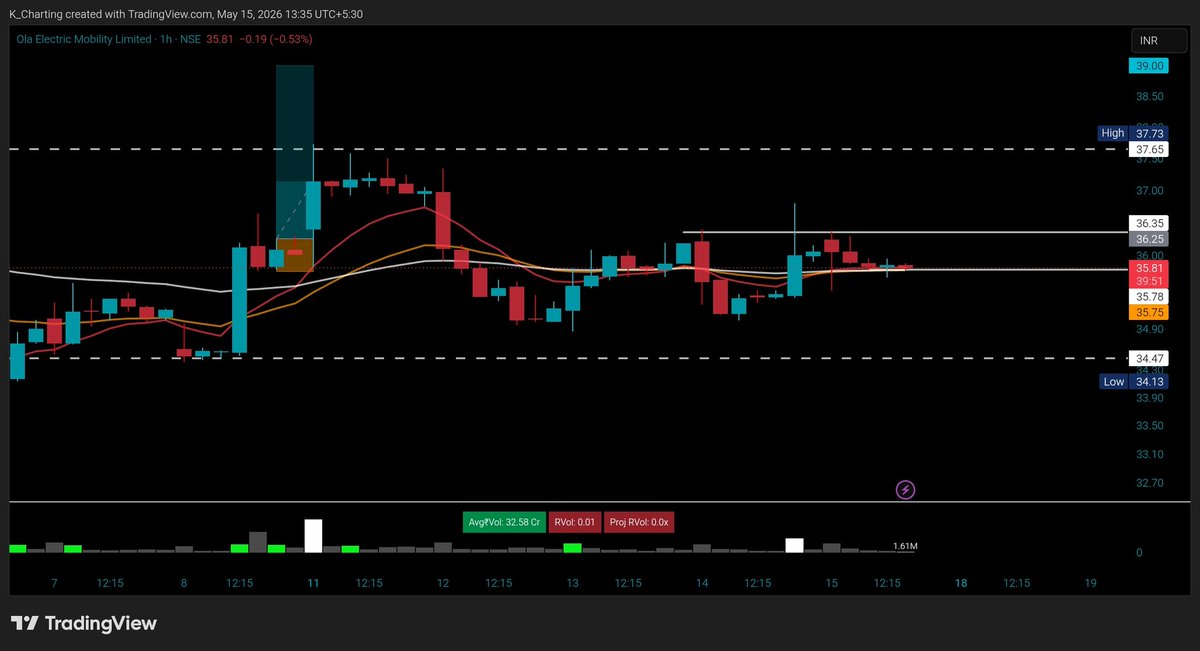
🎯 INSTANT KEY LEVELS: YOUR ROADMAP See the Monthly (White/Green), Weekly (Yellow), & Daily (Red) High/Low like NEVER before. These aren't just lines—they are BANK LIQUIDITY ZONES where big players place orders. The image shows you EXACTLY where price respects them. Game. Changer. Highlighted reactions to Key levels is highlighted in the chart with red circles 
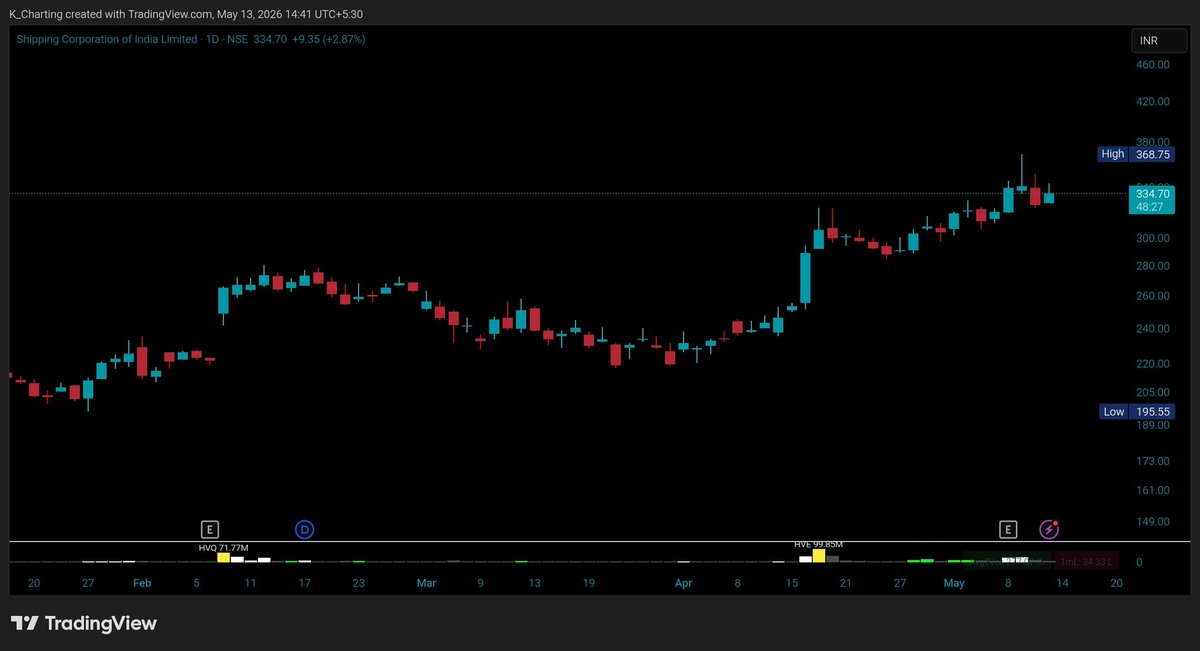
📈 VOLUME CONFIRMATION IS LIVE! (Purple Dots) "Volume precedes price." Now you SEE it. Spots higher volume + higher closes—the UNMISTAKABLE signature of real buying pressure. Dump weak breakouts for GOOD. 
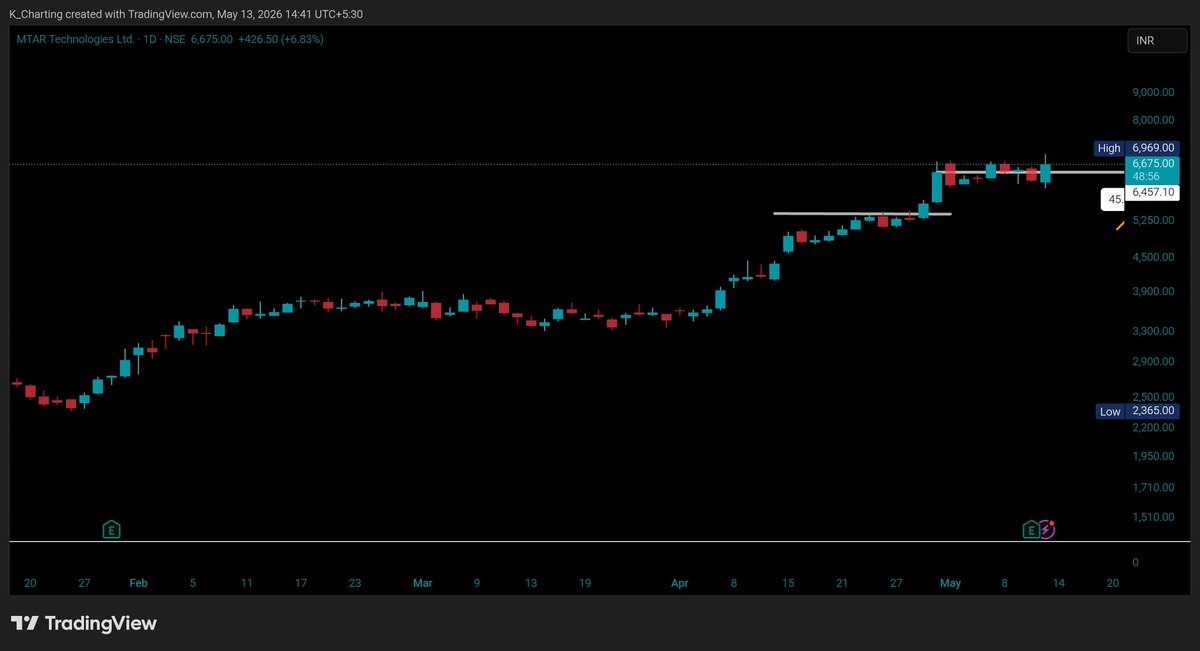
⚡ FRESH BREAKOUT SIGNALS – NO CLUTTER! - "SB5": Alerts ONLY on a FRESH 5-Day High Break. Not yesterday's news. NEW momentum. - "SB20": Flags a FRESH 20-Day High Breakout—a potential TREND SHIFT signal. No repeats. No noise. Just PURE breakout power. ⚠️ Exit Signals? They're there if you want them. But we built this for AGGRESSORS who manage trades live for MAX gains. ✨ AND YES… IT'S FULLY CUSTOMIZABLE. Your rules. Your strategy. Tweak EVERYTHING. LOOK AT THE CHART. It's CLEAN. It's POWERFUL. It's ACTIONABLE. This is the CLARITY you've been paying mentors thousands to teach you—now automated. THE HYPE IS REAL. THE REAL FRIEND IS HERE. Doubtful how it works? You can send me 4 charts name and I will share with you Charts of those, to help you understand how it works. "Pehle Istemaal kro, Phir Vishwas kro" Drop a "🔥" if you see the vision! #TradingView #forex #DayTrading #AlgorithmicTrading #ICTtrading #TradingSetup #BuyTheDip #BreakoutTrading #VolumeProfile #TechnicalAnalysis #FinTwit #Alpha
TradeAstra tweet media
English
1
0
3
2.5K
TradeAstra
TradeAstra@PHI_StockMarket·
The quality of the move is not only judged by the bigger candles it has, it is also judged through how controlled the pull back is. Shallow pullback = Institutions holding up while absorbing the supply.
English
0
0
0
33
TradeAstra
TradeAstra@PHI_StockMarket·
SL.hit
English
0
0
0
26
TradeAstra
TradeAstra@PHI_StockMarket·
#tejasnet Entered as showing some momentum and resumption. It's probably the first day of momentum today
TradeAstra tweet mediaTradeAstra tweet mediaTradeAstra tweet mediaTradeAstra tweet media
English
1
0
0
213
TradeAstra
TradeAstra@PHI_StockMarket·
@mystocks_in Deciding the entire trading activity with an index of 50 stocks ? How can we apply the thesis for universe of stocks? On the contrary the nifty mid small 400 index , is above the EMAs. Did you have many SL hits recently?
TradeAstra tweet media
English
0
0
0
493
Mystocks
Mystocks@mystocks_in·
Nifty - Below 9 Ema and its not good sign for trader and investor, Also break Awvap and retest that also, its clear sign of selling in market now what to do in this market. - Don't buy in huge quantity - Try to avoid heavy positions for overnight - Avoid Intraday trading for some days.
Mystocks tweet media
English
5
6
164
28.4K
TradeAstra
TradeAstra@PHI_StockMarket·
@anshul1217 If it has to go up, if we can possibly break above the first 5 min range, it will go up And if we have to go up, we can consider the opposite? Can this be possible scenarios?
English
0
0
0
11
TradeAstra
TradeAstra@PHI_StockMarket·
Lets train your eyes to visualize to see what can happen next - How many of you can visualize these 2 scenarios. Tell in comments, for each scenario, what would the starting will be like , how you want it to behave and THEN I WILL SHARE MY VIEW POINT ON HOW TO CATCH IT EARLY!
TradeAstra tweet media
English
1
0
0
112
TradeAstra
TradeAstra@PHI_StockMarket·
Will #olaelec resume its momentum from here? First entry on 12th may was a sl
TradeAstra tweet media
English
0
0
0
526
TradeAstra
TradeAstra@PHI_StockMarket·
SL hit, out
TradeAstra@PHI_StockMarket

#abslamc As the markets are trying to sustain for day 2. There is also a momentum shift spotted in this stock. Before i could post this, it already started to move. Entered with a SL of 0.56% here. Considering the recent SL hit, has taken half of the position size to test.

English
0
0
0
85
TradeAstra
TradeAstra@PHI_StockMarket·
If something worked for someone, it does not mean it will work for you. So stop copying / following twitter handles (including mine) blindly. Create your own edge!
English
0
0
0
82
TradeAstra
TradeAstra@PHI_StockMarket·
Quickly gets risk free! Will not allow it to go to loss now
TradeAstra tweet media
TradeAstra@PHI_StockMarket

#abslamc As the markets are trying to sustain for day 2. There is also a momentum shift spotted in this stock. Before i could post this, it already started to move. Entered with a SL of 0.56% here. Considering the recent SL hit, has taken half of the position size to test.

English
0
0
1
114
TradeAstra
TradeAstra@PHI_StockMarket·
#abslamc As the markets are trying to sustain for day 2. There is also a momentum shift spotted in this stock. Before i could post this, it already started to move. Entered with a SL of 0.56% here. Considering the recent SL hit, has taken half of the position size to test.
TradeAstra tweet mediaTradeAstra tweet media
English
1
0
0
320
TradeAstra
TradeAstra@PHI_StockMarket·
@VVVStockAnalyst I agree. Monthly charts give you a very different perspective & are more clear as well. I have been trading based on monthly charts analysis since more than 2 years, they are boring and require a lot more patience to wait, as compared to Daily Bhel is good, but not currently
English
0
0
1
412
Volatility Volume and Value
Volatility Volume and Value@VVVStockAnalyst·
Important Concept of Multiyear Large bases : Always take the larger picture, the Monthly charts. Many stocks that are coming out of large multi year bases backed by strong results & thematic wave looks like extended/moved, but these names possess more potential than you think. In many of these stocks, there might not be opportunity to purchase it right away, but look at the bigger perspective, they are just coming out of 20 year old bases, they have more potential that we can imagine, this first leg will probably look small in the larger aspect of things after few weeks/months. So always keep larger perspective in monthly charts for keeping a few names as "Important" to watch Most big multiyear base breakouts of 2023/2024 were the ones that kept forming smaller bases and moving higher alongside the way. BHEL is doing something similar, when you see only daily chart, you will be compelled to say it has already moved, but opening the monthly chart whispers something else " I'm just starting" There are multiple such stocks in this phase that will probably be big leaders doing 1000's of % move in the upcoming bull market. Maybe not BHEL but this set of stocks having these Large Multi year breakout alongside results and theme is the list to focus for the next 6-9 months. Disc: not a buy/sell recomendation. A learning concept that has helped me make money, so sharing the same.
Volatility Volume and Value tweet media
English
14
14
328
24.9K
TradeAstra
TradeAstra@PHI_StockMarket·
#Godavaribiorefineries Any day, there can be N number of setups. You cannot trade all. Even if you do, you make peanuts then. You need ONE good trade. My focus is here. All other noise is shut down for me. Nalco TSL hit, shaken out! (Education purpose) Godavarilongphi
TradeAstra tweet mediaTradeAstra tweet mediaTradeAstra tweet media
English
1
0
0
793
TradeAstra
TradeAstra@PHI_StockMarket·
You’d ideally want: -Another 1–3 sessions of healthy upside participation -continued low downside expansion -rising 5D winners -stable/improving breadth That would suggest: Supply genuinely absorbed
TradeAstra@PHI_StockMarket

Summary is - The market showed strong internal rebound after panic selling, but confirmation now depends on whether upside participation can persist while downside pressure remains suppressed. If not, this can be only short-covering / relief rally

English
0
0
0
92
TradeAstra
TradeAstra@PHI_StockMarket·
Summary is - The market showed strong internal rebound after panic selling, but confirmation now depends on whether upside participation can persist while downside pressure remains suppressed. If not, this can be only short-covering / relief rally
TradeAstra@PHI_StockMarket

Why no trades today! Read between lines when interpreting data -Most of leaders are extended with overhead supply buildup -Today move looks like an extended downside pullback only -Not enough signs to show that supply is absorbed -Only few leaders participating in up-move

English
0
0
0
175
TradeAstra
TradeAstra@PHI_StockMarket·
Why no trades today! Read between lines when interpreting data -Most of leaders are extended with overhead supply buildup -Today move looks like an extended downside pullback only -Not enough signs to show that supply is absorbed -Only few leaders participating in up-move
TradeAstra tweet mediaTradeAstra tweet mediaTradeAstra tweet mediaTradeAstra tweet media
English
0
0
0
151
TradeAstra retweetledi
Chhirag Kedia
Chhirag Kedia@swing_ka_sultan·
DOOMSDAY INCOMING… 3…2…1 What I find most fascinating about human behavior is that every small bounce during a bear market crash feels like the start of a new bull market, and similarly, in a bull market, even a small correction makes people behave as if a full bear market is returning. A mere 3% cut in the small-cap index, and people start reacting as if a 1929, 2008, 2018–19, or even a COVID-style crash is unfolding. And often, the same people will regret six months later that they did not participate enough when the market kept moving higher. And then, some go on to call it the “most hated” bull market. The reasons may be different today, but nothing new is happening now that did not happen in the 2017, 2020–21, or 2023–24 bull markets. We saw several sharp shakeouts and short corrections in those phases as well. That is how the market absorbs supply, resets sentiment, and stays healthy. The craziest thing I read today was someone posting an index chart and claiming that “nothing good happens below the 200 DMA.” For a moment, I thought it was some shit posting. Seriously? Is the 200 DMA responsible for news flow in the market and the resultant correction? We just had one of the easiest money-making months in the last two and a half years, where simply participating in the market could have made enough money that even people with the most average skill sets are up 20% to 40%. And that still isn’t considered “good enough” as the index is below the 200 DMA? They claim that experts may make money in such markets, but most people do not have the same skill set. No, folks, you do not need some magical skill set. You just need to place the damn stop-loss and follow your trailing stop-loss. And if you do not even have that skill, or more accurately, that discipline, you are not going to make or preserve money in the market regardless of whether the index is above or below some stupid moving average. Do not let other people impose their own mental barriers on you. They failed to make money because of some illogical rule they followed, and now they are trying to pass that limitation on to others.
English
10
6
128
11.4K