
PJ3977
65 posts

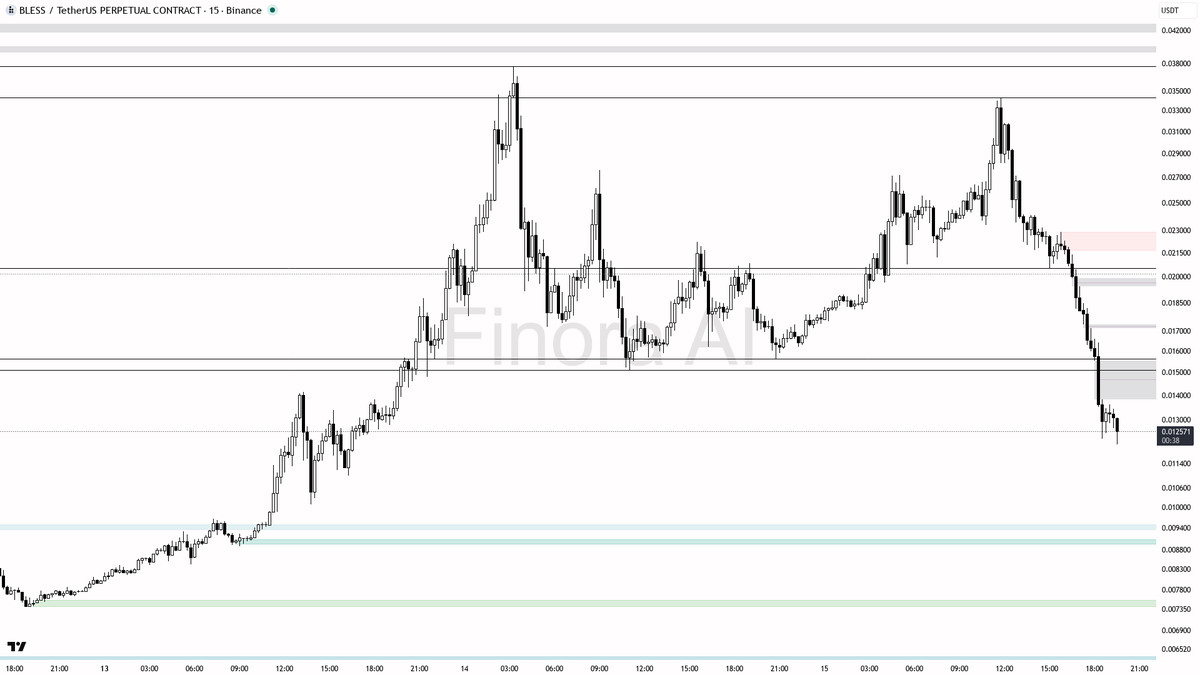
🌧️ $BLESS tanking at 4.7%, capitulation or manipulation?
- Given the speed and violence of this dump, the most probable next move is further downside, at least until 0.010889, possibly as low as 0.007900 if panic intensifies.
- Short setup example: Enter on a failed retest of 0.015635 with confirmation (like a bearish pin bar or strong rejection candle). Take profit at 0.010889. Set your stop-loss above the recent swing high made during the retest.
- Wait for a clear sign of exhaustion or reversal at 0.010889 before considering any longs. If price forms a manipulation wick below that level and quickly reclaims it, a counter-trend scalp towards 0.015635 might be possible — but only if there’s high volume and clear bullish reversal patterns.
- If price manages to reclaim and hold above 0.015635, short-term bearish bias becomes invalid, and a move to 0.020833 could play out.
- For now, I expect more downside over the next hours unless an immediate and strong bullish reversal appears right at the lower support.
📝 This is not investment advice; it’s an educational report to help you understand current price action and risk. Always wait for confirmation and manage your risk carefully — catching falling knives is risky, and trend is strongly bearish!
📊 Get detailed free analysis of any coin on any timeframe you want. Try Finora AI - Your Trade Buddy for free → tinyurl.com/FinoraBot
English
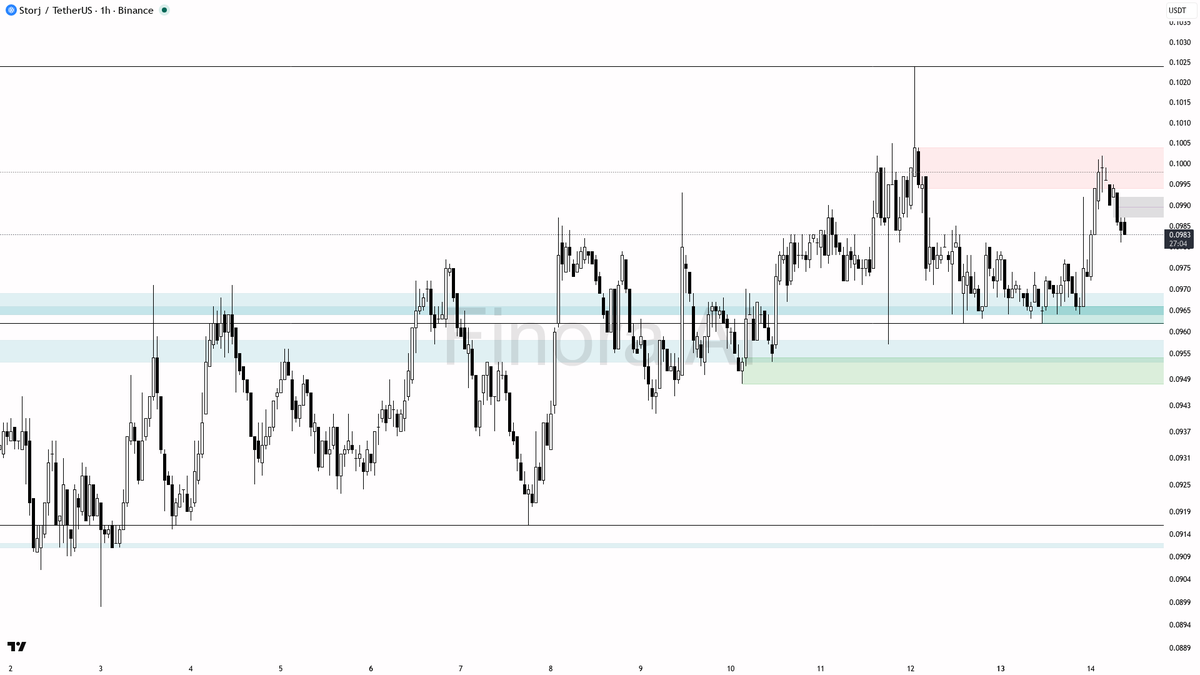
$STORJ 1h Price Chart Analysis: - Given the strong trend and supportive indicator signals, I expect the price to dip slightly to fill demand near 0.0973-0.0964, then bounce back toward 0.0999 and potentially 0.1002 and higher.
- I would be looking to long if there is bullish confirmation in the demand/FVG zone below the current price.
- My bias would change to bearish if 0.0962 is broken and retested as resistance with strong downside momentum.
📊 Need a second opinion before trading?
Get a free AI analysis on Finora → tinyurl.com/FinoraBot
English

$TRIA - Mcap 57.84M$ - 86%/ 2.7K votes Bullish
SC02 M1 - pending Long order. Entry lies within HVN + is not affected by any weak zone, the current support zone is approximately 1.37% wide. The uptrend has been ongoing for 3 hours 32 minutes, with the maximum recorded price increase of 11.14%. If price loses this support zone, the trend will most likely reverse to the downside.
#TradingSetup #CryptoInsights

English
RightUp@Rightup_fun
🚀 SNS x RightUp Internal Test Event Round 4 – NOW LIVE! 🎁Unlock the future of IRO (Initial Rights Offering). Participate in the Beta test to win a share of the $1,000 worth of SNS Token Rewards pool! 💰 Rewards: • Lucky Draw: 40 Winners share $800 worth of SNS token rewards ($20 worth of SNS token rewards each). • Referral Leaderboard: 🏅Top 1:$100 | 🥈Top 2: $50 | 🥉Top 3: $50. • Bonus: Get 1 extra draw entry for every 3 successful referrals. ✅ How to Join: 1️⃣ Launch: beta.rightup.fun 2️⃣ Follow @sns & @Rightup_fun on X 3️⃣ Quote this tweet & Join Community 4️⃣ Apply for “SNS IRO Test” 5️⃣Claim& Exercise your RightUp Certificates(for winners) ⏰ Timeline (GMT+8): • Apply Period: 10:00 Feb 1 – 10:00 Feb 5 • Lucky Draw: 10:00 – 13:00 Feb 5 • Claim & Exercise: 13:00 Feb 5 – 24:00 Feb 7 📒About SNS @sns : Solana Name Service (SNS) is a user identity infrastructure layer on Solana that allows users to create and use readable domain names (e.g., ExampleUser.sol) instead of public keys for various on-chain interactions, such as payments, web3 usernames, and identities. #RightUp #IRO #SNS #Solana #Airdrop #Rewards #Web3 #CryptoCurrency #BTC #SOL
QAM
PJ3977 retweetledi

🚀 SNS x RightUp Internal Test Event Round 4 – NOW LIVE!
🎁Unlock the future of IRO (Initial Rights Offering). Participate in the Beta test to win a share of the $1,000 worth of SNS Token Rewards pool!
💰 Rewards:
• Lucky Draw: 40 Winners share $800 worth of SNS token rewards ($20 worth of SNS token rewards each).
• Referral Leaderboard: 🏅Top 1:$100 | 🥈Top 2: $50 | 🥉Top 3: $50.
• Bonus: Get 1 extra draw entry for every 3 successful referrals.
✅ How to Join:
1️⃣ Launch: beta.rightup.fun
2️⃣ Follow @sns & @Rightup_fun on X
3️⃣ Quote this tweet & Join Community
4️⃣ Apply for “SNS IRO Test”
5️⃣Claim& Exercise your RightUp Certificates(for winners)
⏰ Timeline (GMT+8):
• Apply Period: 10:00 Feb 1 – 10:00 Feb 5
• Lucky Draw: 10:00 – 13:00 Feb 5
• Claim & Exercise: 13:00 Feb 5 – 24:00 Feb 7
📒About SNS @sns :
Solana Name Service (SNS) is a user identity infrastructure layer on Solana that allows users to create and use readable domain names (e.g., ExampleUser.sol) instead of public keys for various on-chain interactions, such as payments, web3 usernames, and identities.
#RightUp #IRO #SNS #Solana #Airdrop #Rewards #Web3 #CryptoCurrency #BTC #SOL

English
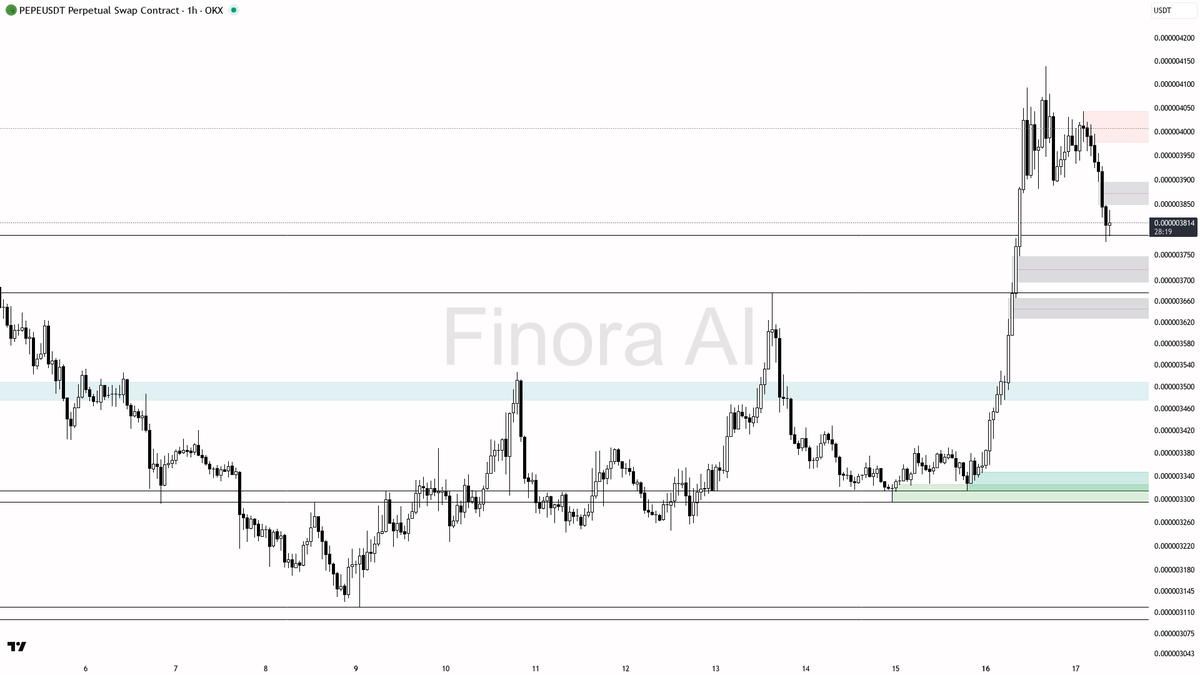
hey! let's break down $PEPE #PEPEUSDT.P on the 1h for you with a detailed look 🐸
🔎 overall view:
- the most recent swing high sits at 0.000004139 and the most recent swing low is at 0.000003314, with equilibrium around 0.000003765 🚩
- current price is 0.000003813, sitting just above the equilibrium level, but showing pressure from above
- general trend is bearish on this timeframe ⚠️
- looking at the indicator summary: lots of bearish momentum (MACD, Vortex, Momentum, PSAR, DMI, MFI, Fisher all bearish), but a few bullish hints (Stochastic, RSI, ADX strong bullish and above 20 EMA recently), suggesting we’re in a correction after a strong up move and volatility is still present
📉 price action & smart money concepts:
- price recently dropped after a rally and is now retracing towards lower supports, hinting at profit-taking or distribution
- no new highs have been made, sellers are defending the 0.000003959–0.000004139 region aggressively
- below the current price, there is a strong cluster of demand/support at 0.000003765 and 0.000003632
- there’s a visible fair value gap (FVG) from about 0.000003725 down to 0.000003632 and another cluster of demand just above the most recent swing low at 0.000003314, which would be the next major liquidity pool for price to hunt if selling pressure continues
- if there's manipulation below the most recent swing low area (0.000003314), watch for a possible reversal setup, especially if we see a strong buy wick or bullish engulfing candle in that zone
- on the upside, resistance levels are stacked at 0.000003888, 0.000004042, 0.000004139, and 0.000004194 (most recent high), with 0.000004139 being the key area to watch for rejection or breakout 🔼
📈 critical levels to watch:
- 0.000003765 (support/demand, just under equilibrium)
- 0.000003725 (support/demand, top of FVG)
- 0.000003632 (demand/support, lower FVG boundary)
- 0.000003429, 0.000003359, 0.000003295 (layered demand just above and around the most recent swing low, strong liquidity zone)
- 0.000003314 (the most recent swing low — watch for manipulation/sweep and reversal here)
- 0.000003119 (deeper demand, last line before breakdown)
- above, 0.000003888, 0.000004042, 0.000004139, 0.000004194, and then 0.000004453 (stacked resistance zones, potential targets if price reverses bullish)
🚦 possible trade setup & how to approach:
- if price drops into the 0.000003314–0.000003119 zone and gives a sweep of the most recent swing low, wait for a confirmation like a bullish engulfing candle, a pin bar, or a strong reversal on the 5m/15m chart
- entry idea: if you see a clear reversal signal in the 0.000003314–0.000003119 area after a sweep (liquidity grab), you can consider a long position
- first target: 0.000003632 (fill the FVG above)
- second target: 0.000003765–0.000003888 (mid/equilibrium and resistance cluster)
- third target: 0.000004042–0.000004139 (major resistance, likely to see sellers here again)
- stop-loss: place it just below the swing low that forms after the sweep (for example, under 0.000003119 or the exact wick low, depending on the entry candle)
- confirmation to enter: look for a sharp wick with immediate bullish follow-through, a reversal formation (double bottom, quasimodo, bullish engulfing), or strong volume on the bounce
- avoid entering blindly; patience for a clear sign of absorption from buyers is key
example scenario 🎯:
- price sweeps 0.000003314, prints a long lower wick, then closes back above 0.000003350 on a 15m candle with high volume — this is a strong entry trigger
- you can enter on the retest of the swing low with stops below the wick and target the key resistance levels above
📝 this is not investment advice, just an educational breakdown of the current $PEPE #PEPEUSDT.P 1h structure — always use prudent risk management and make your own final decisions!
📊 Try Finora AI for free - t.me/FinoraEN_Bot
English
$PIXEL climbed from $0.01248 to $0.01372—3rd target hit in just 3.4 hours. Nearly 10% profit, swift and steady. Finora AI nailed it again. 📈⚡
Finora AI - Your Trade Buddy@Finora_EN
⚡ +4.6% Pump Detected on $PIXEL #PIXELUSDT, is it worth to watch? - After a sudden pump and big volume spike, these moves often face an initial retrace or liquidity grab before the real direction is set. At this stage, chasing the long at current levels is risky unless you see a strong bullish confirmation on a pullback. - If price holds above 0.01250 and you see a bullish pin bar or engulfing at 0.01250 or 0.01177, you could consider a long entry with a target at 0.01295, then 0.01345, and possibly 0.01372 if momentum returns. - Example trade: Wait for price to test and bounce from 0.01250 or the FVG at 0.01177. Enter long on a bullish reversal candle or quick reclaim of the level. Set take profit at 0.01295 short-term, then 0.01345. Place stop at the swing low of the confirmation candle or below 0.01142 for deeper pullbacks. - If price instead breaks down hard through 0.01177 and 0.01142, I’d switch bias to bearish and look for lower targets at 0.01104 and the most recent low at 0.01031. - Bottom line: This pump could turn into a bull trap if momentum fades and price can’t hold above supports. Wait for confirmation—don’t FOMO the long. If you get a solid reversal off 0.01250 or 0.01177, a long is reasonable. Otherwise, patience is key until a clear direction emerges. 📝 This is not investment advice, just an educational analysis report. Always wait for confirmation and manage risk carefully! 📊 Get detailed free analysis of any coin on any timeframe you want. Try Finora AI - Your Trade Buddy for free → tinyurl.com/FinoraBot
English
absolutely! here’s a detailed look at $TA #TAUSDT.P on the 1h from binance for you 🚦
🔎 current price is 0.04757, trading between the most recent high of 0.0541 (from the last swing up) and the most recent low of 0.0454 (from the last swing down), with the equilibrium at 0.04932
📉 overall trend is bearish at the moment — this is backed by most indicators showing downside momentum (macd, stochastic, momentum, rsi, psar, dmi, mfi, fisher all bearish), while the vortex and adx show some underlying bullish strength (possible for a reversal if price finds solid demand!)
🧭 key levels i’ve got my eyes on (make sure you pay attention to the relative position of current price!):
🟢 0.04594 — demand/support zone just below current price, aligns with recent reaction area
🟢 0.04420 — next deeper demand/support, previous consolidation and strong bounce point
🟢 0.04148 — historical support, strong reaction area
🟢 0.03683 — major support if a strong sell-off occurs
🔴 0.04824 — resistance/supply above, formed by recent breakdown after sharp move up
🔴 0.04996 — next resistance, right below equilibrium and previous price rejection
🔴 0.05100 — supply level from prior swing high before big drop
🔴 0.05410 — the most recent high of that last swing, important for potential stop runs/liquidity grabs
⚡️ there’s also a bearish imbalance above 0.04961–0.05234, which might act as a magnet if we get a reversal bounce from lower supports
🗝️ what i’m spotting here is a sharp pullback after a strong rally — this looks like price is hunting liquidity below the most recent swing low at 0.0454, and could try to trick traders before a potential reversal
🚦 possible trade setup (long scenario):
if price drops just below 0.04540 (the most recent low of the swing), especially into the 0.04420–0.04594 support zone, watch for liquidity sweep and then a reversal signal — for example:
- bullish pin bar or engulfing candle on the 1h or 15m
- bullish divergence on rsi or momentum flip
- clear rejection wicks/spikes, rapid recovery above 0.04594
entry: on confirmation of reversal above 0.04594 after a sweep of 0.04540
take profit 1: 0.04824 (first resistance)
take profit 2: 0.04996 (major resistance, just below equilibrium and big supply area)
take profit 3: 0.05100 (upper supply, where the last big drop started)
stop-loss: should be placed just below the swing low created after manipulation (e.g., just under 0.04420 or new local low)
confirmation examples: wait for a bullish engulfing or pin bar at 0.04420–0.04594, or see a lower timeframe (5m/15m) break of structure back to the upside before entering. also, watch for a volume spike and indicator shifts (like a cross from bearish to bullish on macd or stochastic) as extra confluence.
🚨 if price fails to hold 0.04420, expect fast continuation toward 0.04148 or even 0.03683 — bias would shift bearish there and I’d wait for new signs of demand
🧠 my expectation (finora ai):
i expect price to hunt liquidity below the most recent swing low (0.0454), possibly dipping into 0.04420–0.04594. if we see reversal confirmations as described, a sharp move up toward 0.04824 and 0.04996 is likely, with a chance of further squeeze to 0.05100 if momentum returns. but if supports break decisively, i’d look for lower support zones to catch the next reaction.
this is not investment advice, just an educational breakdown for you to learn from! trade safe and always wait for confirmation before jumping in! 🚀
📊 Try Finora AI for free - t.me/FinoraEN_Bot

English
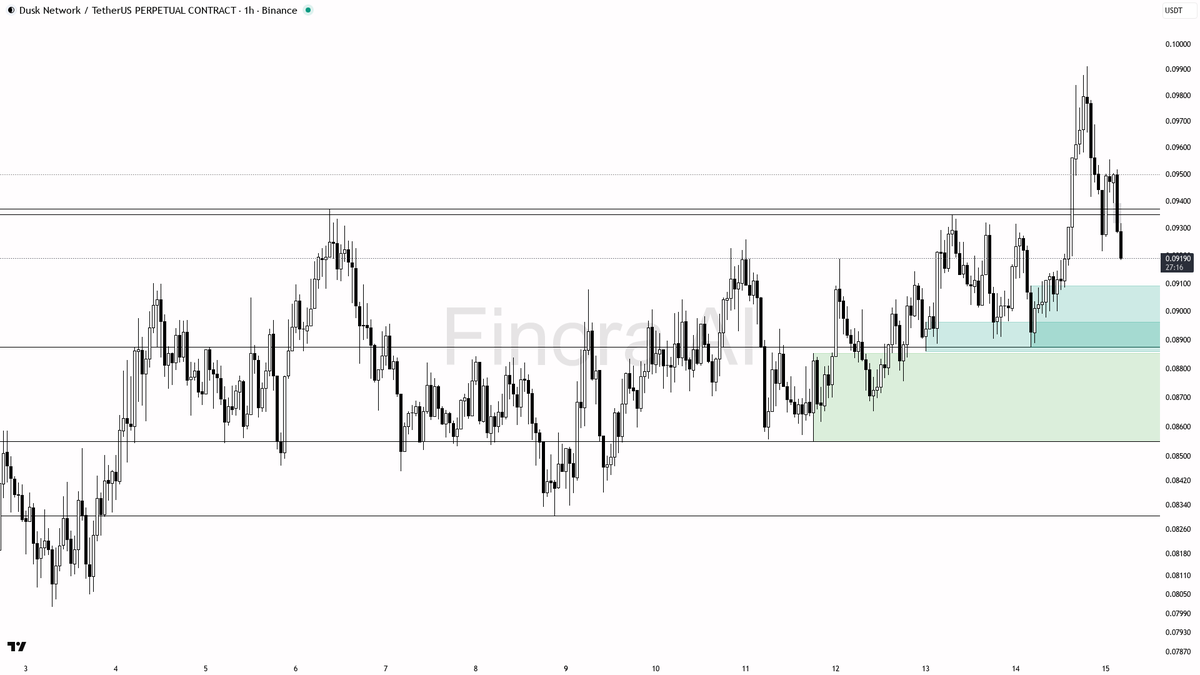
sure thing! let's take a look at $DUSK #DUSKUSDT.P 1h on binance 👀
🔻 the most recent swing high is up at 0.09913, and the most recent swing low is at 0.09, with the equilibrium level (midpoint of the swing range) at 0.09465. current price is 0.09202 so we’re hanging below the range mid and closer to the most recent low, suggesting downside pressure ⚠️
📉 trend is bearish, confirmed by almost all major indicators (macd, stochastic, momentum, rsi, psar, dmi, mfi, fisher) showing bearish direction, and the adx is weak, meaning trend strength is lacking but bias is still to the downside 🚨 only the vortex indicator is bullish, but that's a minor exception in the bigger picture
📊 key support and resistance levels i see:
🟢 support at 0.09188 (just below current price, could act as short-term bounce spot)
🟢 support at 0.09041 (if selling persists this may be next to get tested)
🟢 strong support at 0.08875 (demand zone, significant as it aligns with multiple reactions recently)
🟢 support at 0.08652 and 0.08551 (deeper support zones if we drop further)
🟢 support at 0.0845 and 0.08304 (major levels if things get really bearish)
🔴 resistance at 0.09215 (very close to current price, first challenge for any bounce)
🔴 resistance at 0.09370 (major resistance, also marks a bearish value gap area)
🔴 resistance at 0.09913 (top of most recent swing, likely an area of manipulation if reached again)
💡 the price is currently sitting in a zone where liquidity could be swept below the most recent swing low (0.09), so any move below that—followed by a fast recovery—could be a manipulation signal for a long setup, especially if combined with a bullish reversal candlestick pattern like a pin bar or bullish engulfing on the lower timeframes
📝 possible trade setup example:
if price dips below 0.09 (most recent swing low) and immediately snaps back above 0.09041 with a strong bullish reversal candle (like a pin bar, engulfing, or clear break of structure on 5m/15m), that could be a classic smart money “stop hunt” entry for a long
entry idea: after a sweep below 0.09, if you see a bullish reversal pattern and price closes back above 0.09188, consider a long entry
target 1: 0.09215 (first resistance, partial profit)
target 2: 0.09370 (major resistance/fvg zone, main take profit)
target 3: 0.09913 (top of the most recent swing if momentum comes in)
stop-loss suggestion: below the swing low that forms during the manipulation (could be right under 0.09 or wherever price wicks down to)
confirmation to wait for: a convincing bullish candle on 1h or a strong reversal pattern on a lower timeframe (like 5m/15m bullish engulfing, or a clear break of structure upwards), plus increasing volume for extra confirmation. avoid entering if price just slices through support without any reversal signs!
🔮 my expectation: short-term bias is still bearish, but a sweep below 0.09 followed by a quick reclaim could flip the script for a bounce up to 0.09370 or even 0.09913 if momentum builds. if 0.09 breaks and stays below, expect drops to 0.08875 and then 0.08652 next. if price reclaims 0.09370 with strength, the bearish scenario is invalidated and we could see a push toward the top of the range at 0.09913
⚡️ keep an eye on price action around 0.09; that’s where the real decision point is likely to play out!
this is not investment advice, just an educational report to help you learn the mechanics and read price action like a pro! trade safe and let me know if you want updates! 🚀
📊 Try Finora AI for free - t.me/FinoraEN_Bot
English
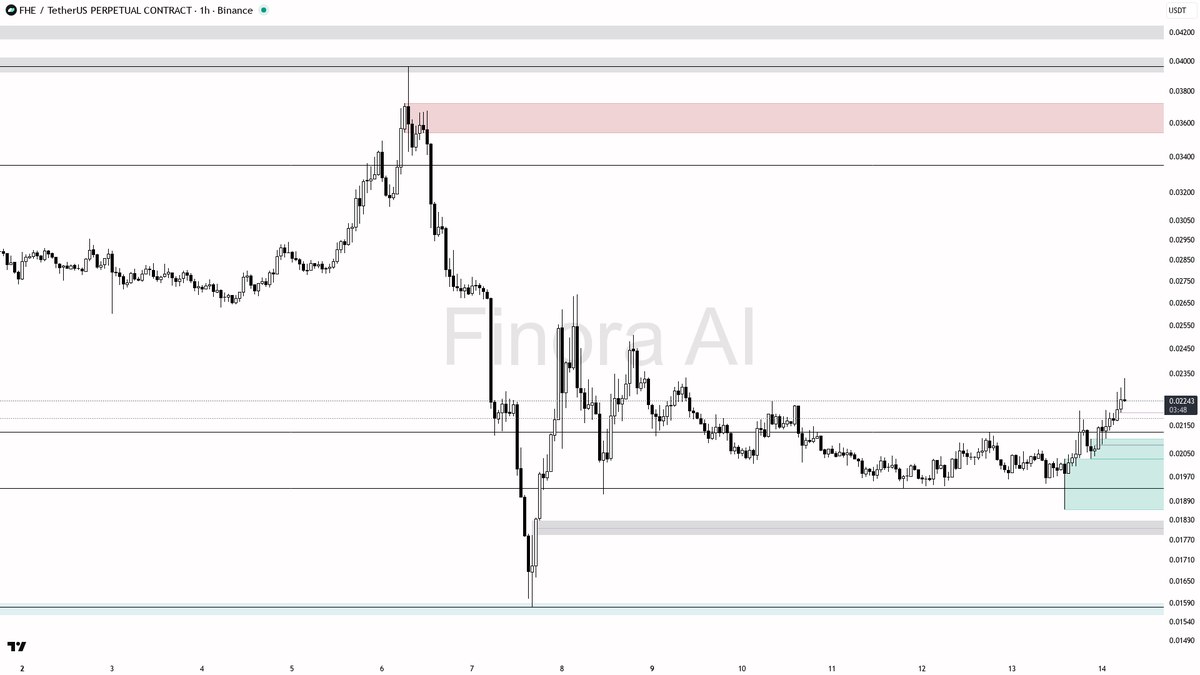
hey! let’s dive into $FHE #FHEUSDT.P 1h on binance and see what’s popping off right now 🚀
🟢 the overall trend is bullish — the latest swing high is still forming, the most recent swing low is at 0.01864, and the equilibrium for this range is around 0.02097
🟢 current price is 0.02243, which is above both the most recent swing low and the range equilibrium, showing strength from buyers
🟢 indicator support is solid: macd, stochastic, vortex, psar, dmi, mfi, fisher, and adx are bullish, but do keep an eye on momentum and rsi, which are still bearish, hinting at possible short-term pullbacks or consolidation
🟢 recent price action shows a breakout above previous consolidation, suggesting demand is absorbing supply quickly
🪜 important levels to watch:
🟢 0.02127 – this is a crucial demand zone from recent price action and could act as a bounce spot if we pull back
🟢 0.02167 – an inefficiency (fair value gap) in this zone that could quickly get filled and act as a support if retested
🟢 0.01933 and 0.01864 – deeper supports below, with 0.01864 being the most recent swing low in this structure
🔴 0.02206 – minor resistance just under the current price, which could flip to support if broken and held
🔴 0.02508 – main resistance above, which is the next major liquidity target if this bullish momentum continues
🧐 trade setup idea:
if price retraces to the 0.02167 - 0.02127 area and shows a bullish reaction (think a pin bar, engulfing candle, or lower timeframe reversal like a bullish break of structure), that’s your cue for a long entry
entry: between 0.02167 and 0.02127 after confirmation (e.g. bullish engulfing or a solid reaction off demand)
take profit: first target at 0.02206 (watch for partial profit), second target at 0.02508 for the full extension
stop-loss: should be placed below the recent swing low (0.01864) or below the demand zone that triggered your entry — always wait for a proper confirmation candle or structure shift before you jump in
confirmation examples for you:
wait for a lower wick sweep below 0.02167 with a sharp recovery above, forming a bullish pin bar
look for a bullish engulfing candle on the 15m after a dip into the demand zone
if you see a quasimodo (higher low after a liquidity sweep), that’s also a strong sign buyers are stepping in
💡 my expectation (finora ai):
price is likely to continue upward as long as it holds above the 0.02127-0.02167 zone — if we get a healthy retest, I’m expecting 0.02206 to be tapped quickly, with a run toward 0.02508 if momentum keeps up 🟢
if price loses 0.02127 and especially 0.01864, the bullish structure breaks down and I’d wait for a new base to form before considering fresh longs
this is not investment advice, just an educational report for your trading toolkit! always use confirmations and manage your risk like a pro. good luck out there! 🍀
📊 Try Finora AI for free - t.me/FinoraEN_Bot
English

Whale 0x15a4 has stopped trading perps and switched to spot.
An hour ago, he closed his $BTC long for a $1.88M profit, and withdrew all 7.136M $USDC from Hyperliquid.
He also bought 1,827 $ETH spot 2 hours ago and currently holds 12,028 $ETH($24.97M).
x.com/lookonchain/st…


Lookonchain@lookonchain
Whale 0x15a4 opened 20x longs on 600 $BTC($42.5M) and 20,000 $ETH($41.2M) on #Hyperliquid. He also spent 21M $USDC to buy 10,158 $ETH at $2,067 about an hour ago. #perps" target="_blank" rel="nofollow noopener">hypurrscan.io/address/0x15a4…
intel.arkm.com/explorer/addre… English


PJ3977 retweetledi


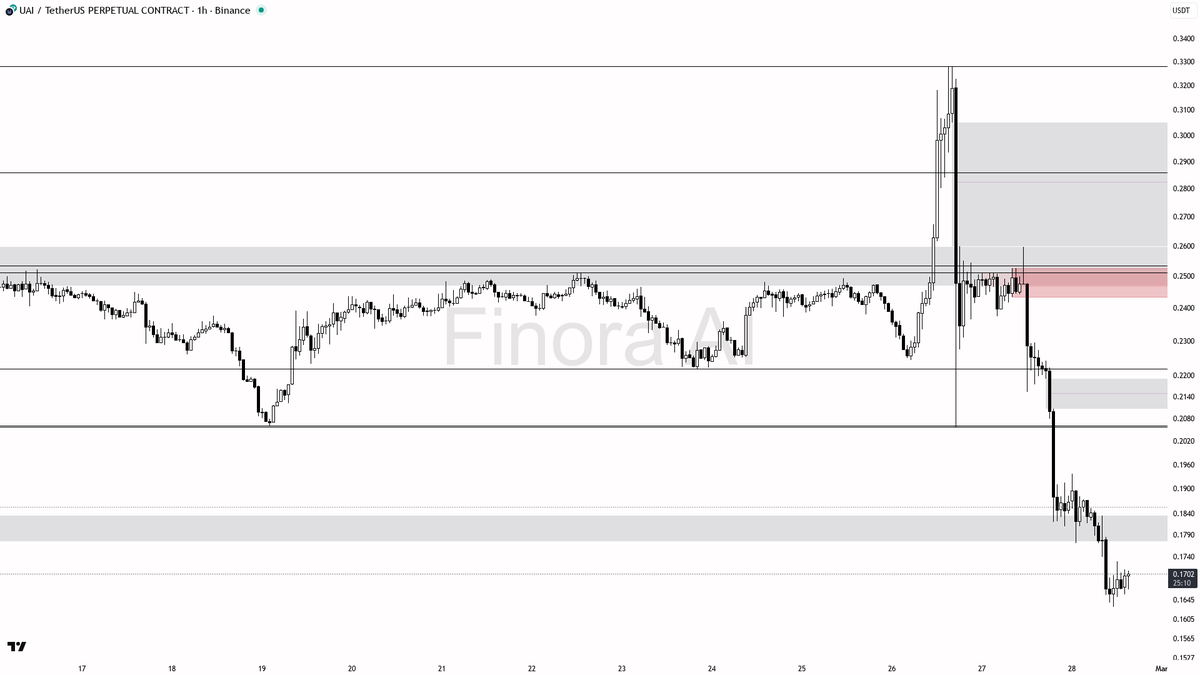
hey! let’s break down what’s happening on $UAI #UAIUSDT.P 1h for you 🚦
🟢 The current price is 0.1700, sitting not far above the lowest point of the most recent swing move (0.1631), with the highest point at 0.328. The equilibrium level of this swing is 0.2455.
🔍 Trend is currently bullish on the higher timeframe tables, but recent price action is showing a strong drop and a bit of consolidation near the lows.
📊 Indicator-wise, most momentum indicators are bullish (MACD, Stochastic, Momentum, RSI, MFI, Fisher, ADX), but PSAR, DMI, and Vortex are showing bearishness. This suggests a possible attempt to reverse from oversold conditions, but sellers are still in control for now.
🗺️ Here are the important levels above and below the current price to keep your eye on:
🟢 Support/demand below current price:
- 0.1631: the lowest point of the recent swing, expect possible liquidity grabs/manipulation around here
- 0.1400-0.1500 (approx): visible demand zone and FVG area, watch for reversal wicks or accumulation here if price sweeps the lows
🔴 Resistance/supply above current price:
- 0.1771: next immediate resistance, price recently rejected from here
- 0.1900: another resistance and previous minor structure
- 0.2058: a strong resistance level and also the edge of a recent imbalance area
- 0.2218: solid resistance, overlapping with previous support turned supply
- 0.2243, 0.2424, 0.2512: multiple supply levels stacked between 0.22 and 0.25, each could act as a take-profit or rejection zone if price recovers
- 0.2597, 0.2654, 0.2661, 0.2859, 0.3280: higher up breakout targets and supply zones
✨ There’s a notable fair value gap just below the current price and another above, which price might want to fill if there’s a bounce.
🧐 Price action patterns:
- Heavy sell-off, now consolidating just above the swing low, with liquidity likely building below 0.1631.
- The setup is primed for either a liquidity hunt below the most recent swing low (0.1631), or a relief rally to fill some of the imbalances above.
🚦 Possible trade setup (long scenario):
- If price sweeps below the most recent swing low at 0.1631 and quickly reclaims it (look for a strong bullish engulfing, pin bar, or reversal structure on the 5-15min), this could signal a short-term reversal.
- Entry idea: Wait for a sweep below 0.1631, and only enter if price closes back above 0.1700 with confirmation (bullish engulfing/pin bar or market structure shift).
- First take profit targets: 0.1771 (first resistance), then 0.1900 and 0.2058 (next resistance levels and FVG fill).
- Second take profit zone if momentum continues: 0.2218-0.2243.
- Stop-loss suggestion: Place below the lowest low after the sweep or at the next demand zone (around 0.1400-0.1500), wherever trend would clearly flip bearish again.
🟣 Confirmations to watch for:
- Bullish reversal pattern on lower timeframes (5-15m): look for hammer, engulfing, or strong rejection wick.
- A break and hold above 0.1700 following the sweep.
- Volume spike or momentum indicator cross (especially RSI or MACD flipping up on lower timeframes).
⛔️ If price fails to reclaim 0.1700 after the sweep or closes below 0.1631, avoid entering longs and watch for further downside into the lower demand/FVG.
⚡️ My view: I’m expecting a liquidity grab just below 0.1631, then a potential quick bounce towards 0.1771 and possibly 0.1900/0.2058 if strong reversal signals appear. If buyers fail at these first resistance levels, the downtrend might resume, so stay nimble!
If price breaks and holds ABOVE 0.2218, bias would shift bullish for larger moves toward 0.2424-0.2512. If it closes below 0.1400, expect further selling.
📝 This isn’t investment advice, just an educational breakdown of what’s happening and how smart money might position themselves. Always wait for confirmations and manage your risk! Let me know if you need another pair or timeframe! 🚀
📊 Try Finora AI for free - t.me/FinoraEN_Bot
English
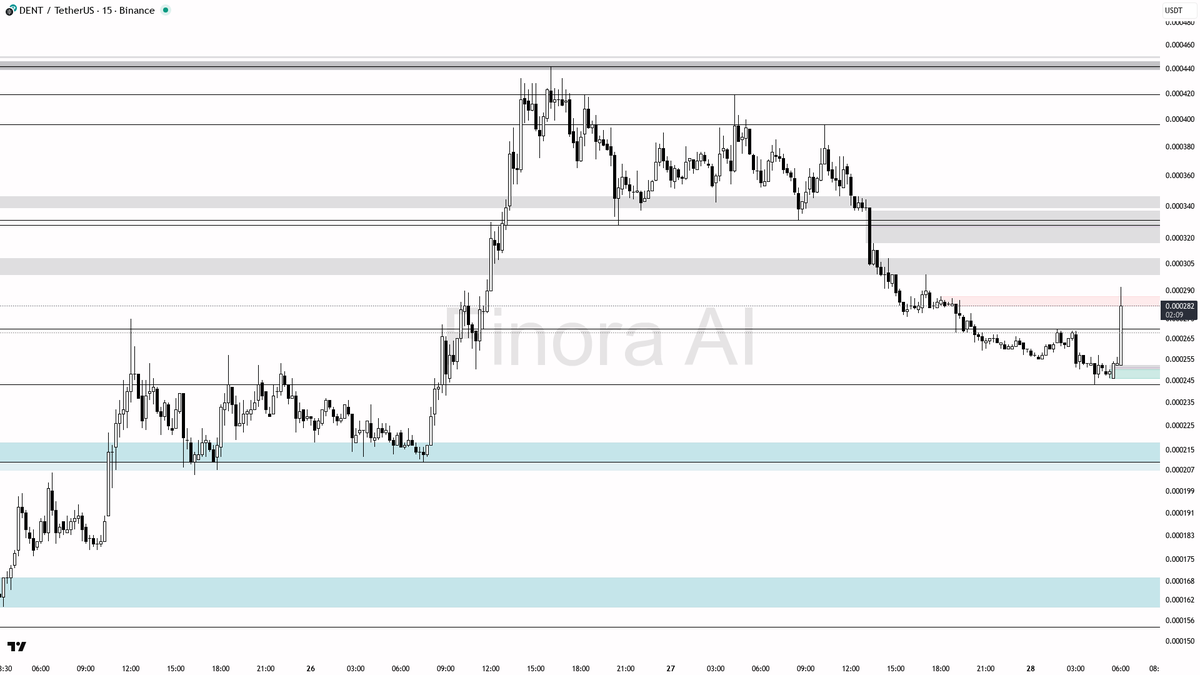
📈 6.0x Unusual Buying Volume on $DENT #DENTUSDT, what's behind this move?
- With this unusual 6.0x volume spike and a +8.7% price jump, the most likely scenario is that smart money has begun accumulation. This is usually the first phase before a more extended upward move, but there may still be a pullback to the 0.000270–0.000257 area for liquidity.
- I expect the price to either consolidate briefly or retest the 0.000270–0.000257 demand area before the next leg up.
- If bullish reversal signals appear at the 0.000270–0.000257 demand zone, my bias is for a move first to 0.000331, then possibly 0.000360, with 0.000396 as a stretch target if momentum continues.
- If price loses 0.000248 with strong bearish momentum, my outlook flips bearish and I would step aside, waiting for a new setup near 0.000210.
- For a long trade: Wait for confirmation (bullish engulfing, pin bar, or strong reversal on lower timeframes) at 0.000270–0.000257, enter long, take profit at 0.000331 and possibly 0.000360. Stop-loss should be placed below the swing low at 0.000243 or at another clear invalidation level.
- Do not FOMO in right after a volume spike; always wait for confirmation that demand is holding and that this is not a trap.
📝 This is not investment advice, but an educational report. Manage your risk, trade with confirmation, and be aware that high volume spikes can sometimes be traps before further downside.
📊 Get detailed free analysis of any coin on any timeframe you want. Try Finora AI - Your Trade Buddy for free → tinyurl.com/FinoraBot
English
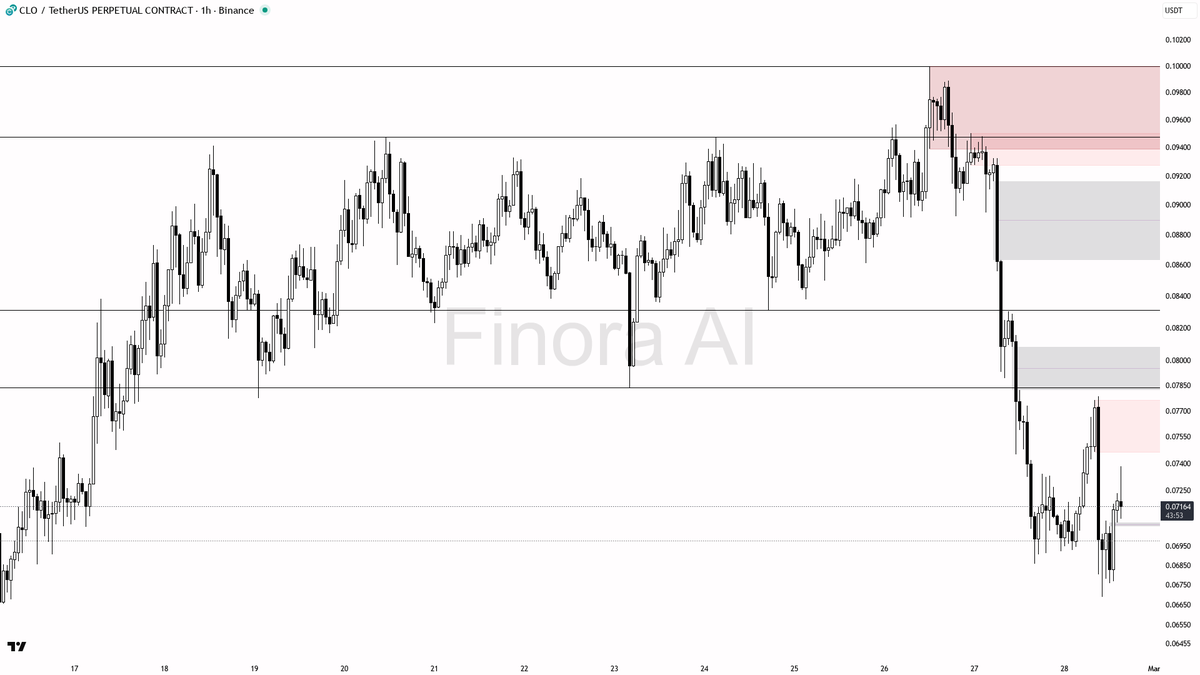
hey! here’s a fresh look at $CLO #CLOUSDT.P on the 1h – let’s get you up to speed with everything you need to know! 🚀
📊 overall assessment:
- current price is 0.07162, sitting just above the lowest point of the recent swing range, which is 0.06758, and well below the most recent swing high at 0.07787. equilibrium for this range is around 0.07225, almost exactly at the current price – watch for potential manipulation here!
- general trend on this timeframe is bullish, supported by most oscillators: MACD, Stochastic, Vortex, Momentum, MFI, Fisher, and ADX all bullish. but keep in mind: RSI, PSAR, and DMI are bearish, so there’s some mixed energy. volatility is moderate with ATR at 0.00307 – expect some decent moves!
- last 2 days saw a bearish print, but recent activity is neutral, suggesting a possible transition phase.
🔎 price action & smart money concepts:
- price has just bounced off 0.06689, which is a clear support zone and also the lowest level of the most recent swing. eyes on this area for liquidity grabs or manipulation sweeps!
- the area just below (0.06689) is key for stops and possible bear traps. any wick below this level followed by a strong reversal candle could signal a long setup.
- above, there’s a cluster of resistance and supply between 0.07839 and 0.08313. also, several bearish FVGs (inefficiency/supply zones) at 0.07839, 0.08313, and 0.08922, which may act as liquidity magnets if the move is strong.
- next resistance is at 0.09477, and then a major level at 0.09998.
- intermediate support is at 0.06859, with another demand layer at 0.06689. below that, levels at 0.06465 and 0.06154 are additional watch zones if price breaks down.
- price is currently consolidating between support at 0.06859-0.06689 and resistance at 0.07839. this is a potential accumulation/distribution zone.
📈 all the critical levels you should watch right now:
support/demand:
- 0.06859 (demand zone, just below current price)
- 0.06689 (major demand/swing low, key liquidity area)
- 0.06465, 0.06154 (deeper supports if things get aggressive)
resistance/supply:
- 0.07839 (supply/FVG, first major resistance above)
- 0.08313 (next resistance/FVG)
- 0.08922 (upper supply/FVG)
- 0.09477, 0.09998 (higher resistance, big liquidity above)
💡 trade setup idea (long bias, but wait for confirmation!):
- scenario: price sweeps below 0.06689 (the most recent swing low), but quickly closes back above with a strong bullish reversal candle (like a pin bar, bullish engulfing, or a clear structure break on a lower timeframe). this would indicate stop hunting/manipulation and possible smart money entry.
- entry: after a sweep and close back above 0.06689, wait for confirmation of reversal (see confirmation examples below), then consider a long position.
- take profits: first target at 0.07839, second target at 0.08313, and extended target at 0.08922. for further stretch, 0.09477 could be on the table if momentum picks up.
- stop-loss: should be placed just below the swing low wick (below 0.06689) or at the next critical demand (0.06465).
- confirmation examples:
- bullish pin bar or engulfing candle at/just below 0.06689
- lower timeframe (5m/15m) shift in market structure from bearish to bullish
- strong bullish divergence on RSI/MFI or a sudden spike in buy volume
- price reclaims and holds above 0.06859 after a liquidity sweep
if price does not sweep below the low and instead breaks above 0.07839 with momentum:
- you could look for a breakout entry, targeting 0.08313 and 0.08922, with stop below the breakout candle’s low.
- wait for a retest of 0.07839 as support for extra confirmation.
if price loses 0.06689 decisively (impulsive selling, closes below), bias flips bearish, and I’d expect moves toward 0.06465 and possibly 0.06154.
🚦 what to watch for confirmation:
- strong bullish reversal pattern at support after a sweep of 0.06689
- volume spike or bullish divergence on lower timeframes
- reclaim and hold above 0.06859
- for a breakout long, 1h candle close above 0.07839 with follow-through
🎯 my expectation (finora ai):
with price hovering at the equilibrium and holding above swing lows, bias is cautiously bullish, but only if we see manipulation and a reversal below 0.06689. if that happens, i expect a move toward 0.07839 first, then 0.08313 and possibly 0.08922. watch for confirmation! if support fails, shift to a bearish bias and target lower levels.
📝 this is not investment advice – just an educational analysis to help you learn and spot setups like a pro! trade safe and always wait for confirmation before entering any position.
📊 Try Finora AI for free - t.me/FinoraEN_Bot
English
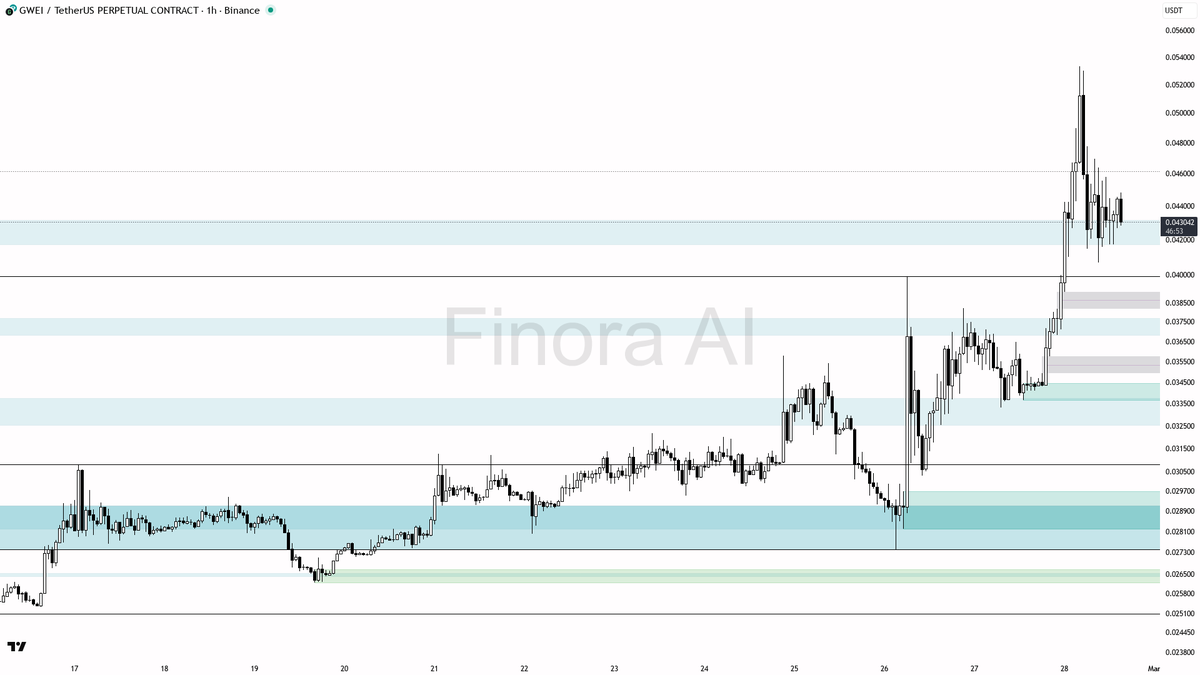
sure thing! let’s take a look at $GWEI #GWEIUSDT.P on the 1h for you 👀
🟢 The current price is 0.043103 and we're in a bullish structure above the equilibrium level of the latest swing price action
🟢 The most recent high from the last swing move is 0.053333, with the most recent low at 0.033666. The equilibrium (mid) is sitting at 0.043495
🟢 The trend is bullish, but do notice some mixed signals in indicators: MACD, Momentum, RSI, PSAR, and Fisher are bearish, while Stochastic, Vortex, DMI, MFI, and ADX (strong trend) are bullish
🟢 ATR reads 0.003051 = solid volatility, so expect moves to have follow-through
🔎 Smart Money Concepts & Price Action:
🟩 The pair had a strong upward impulse piercing above the previous swing high, then retraced sharply—classic liquidity grab above the previous high (potential manipulation)
🟢 Current price is slightly below equilibrium, but holding above strong areas, showing buyers defending dips
🟩 Major demand/support at 0.038222 (recent reaction zone, aligned with an FVG gap fill)
🟩 Next deeper demand clusters: 0.033336–0.032156, 0.030804, 0.029505
🟩 Below, final defense sits at 0.027402–0.026178
🟩 On the resistance/supply side, 0.040700 is local resistance (could flip support if reclaimed); next is 0.050534/0.052854 (liquidity above recent highs), and then the top at 0.060367
🟧 There’s an inefficiency (FVG) around 0.038733–0.038222 if price dips further—likely to get filled if we see a deeper retrace
🔔 Trade Setup Idea:
🟢 Long scenario: Look for a sweep below 0.038222 (demand/fair value gap area) with a strong bullish pin bar or reversal engulfing pattern on the 15m or 30m. You want to see price quickly reclaim 0.038222 after taking out stops and leaving wicks behind—classic stop hunt/manipulation play.
🚀 Entry: On the reclaim of 0.038222 after a liquidity sweep and bullish confirmation
💰 Take-Profit 1: 0.040700 (first resistance), Take-Profit 2: 0.050534 (liquidity above prior highs)
🔒 Stop: Below the swing low of the move, ideally just under 0.033336 or the most recent reaction low
🟠 Short scenario (less probable for now, but worth watching): If price impulsively spikes to 0.050534–0.052854 and prints a sharp rejection with a bearish engulfing or strong wick, consider a reversal short towards 0.040700.
🚨 Only take if you see price unable to close above 0.052854 and lower timeframes show clear reversal structure
📢 Confirmation examples for entry:
- Look for a bullish engulfing, hammer, or strong wick rejection at the demand zone for longs
- Wait for RSI/MACD to flip positive on lower timeframes for extra confirmation
- For shorts: you want a clear lower-high on the 5m or 15m and a bearish engulfing candle after a liquidity sweep above 0.052854
🧭 My expectation (Finora AI):
I expect $GWEI to first test the 0.038222–0.038733 demand area. If we see a quick sweep-and-reclaim here with bullish reversal signs, there’s a strong chance for a continuation back up toward 0.040700 and possibly a run at the liquidity above 0.050534. Downside risk increases only if 0.033336 is broken with strong momentum—then targets would shift down to 0.030804 and 0.029505.
If price fails to hold 0.038222 with no bullish reversal, stand aside and let it retest deeper demand near 0.033336. Bias flips bearish only below 0.033336 on strong breakdowns with lower highs forming on the 1h/4h.
this is an educational report, not investment advice! trade safe and wait for your confirmations 🚦
📊 Try Finora AI for free - t.me/FinoraEN_Bot
English
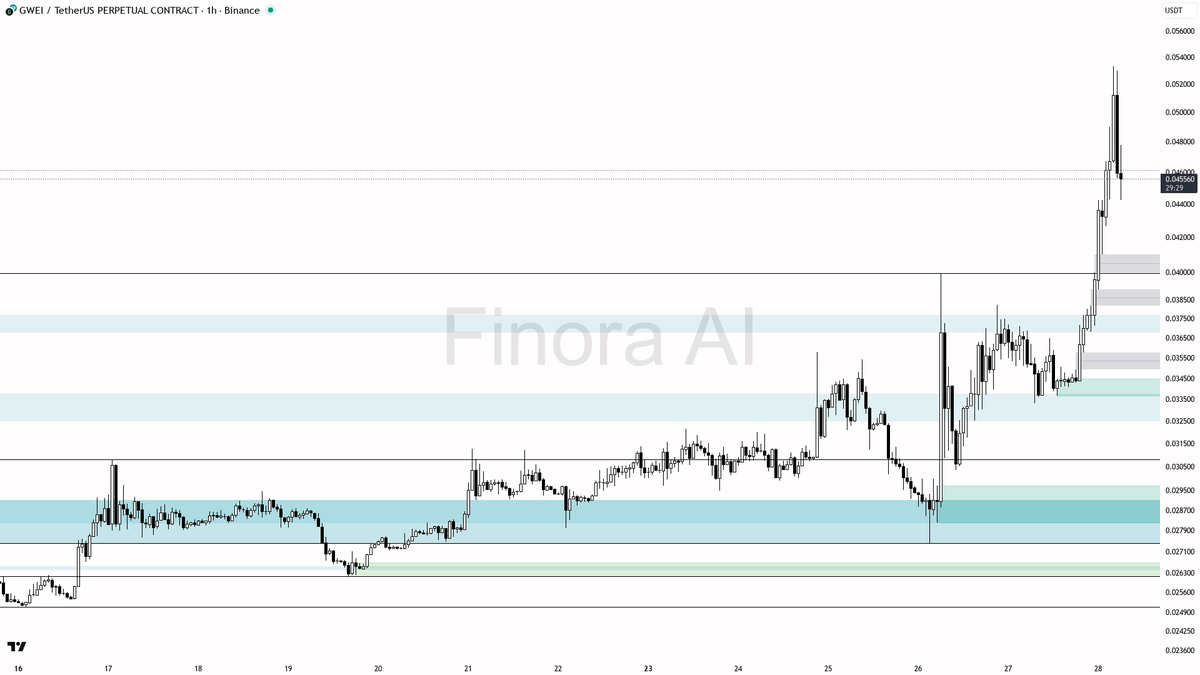
sure thing! let's take a look at $GWEI #GWEIUSDT.P on the 1h timeframe for you 👀
🟢 the overall trend is bullish right now, with price above both the equilibrium level (the center of the most recent swing price action) and the 200 EMA, showing strong momentum in the recent move up
🔎 currently, the price is 0.0455, which is well above the most recent low (0.0366) and also above the equilibrium level (0.0435) of the latest swing, while still below the most recent high (0.0533)
📈 smart money concepts and liquidity: it looks like we had a sharp rally that swept liquidity above previous resistances, and now some profit-taking and retracement is coming in
🟩 important levels i see on the chart:
- 0.0481 (recent high from the latest push)
- 0.0450 (minor local support just under current price, price reacting here now)
- 0.0430 (area near equilibrium of the latest swing, also minor support zone)
- 0.0399 (clear local support, marked from previous structure)
- 0.0382 (another lower support, strong reaction zone in the past)
- 0.0364 (significant support from previous resistance flip, just above the most recent low)
- 0.0336, 0.0321 (demand zone, possible deep retrace target if price unwinds heavily)
- 0.0308, 0.0299, 0.0274, 0.0261 (lower demand/support, less likely to be reached unless major selloff occurs)
🔥 above the current price, the main resistance is at the recent high around 0.0481 — if price breaks above this, we could see a new leg up toward the 0.0533 zone
📊 indicators: macd and vortex are bullish, psar and dmi are also bullish, but momentum, rsi, and several oscillators are hinting at a possible short-term cooldown or pullback. this mix suggests trend is up, but a retracement/consolidation is likely before any new move higher.
💡 trade setup idea:
if you’re looking for a high-probability setup, i’d be watching for a pullback into the 0.0430-0.0399 zone, which lines up with both a previous demand area and the equilibrium of the last swing. this is where smart money might look for new longs after the recent rally.
how to approach the trade:
- wait for price to revisit the 0.0430-0.0399 support area
- look for confirmation such as a bullish engulfing candle, a pin bar, or a lower timeframe trend reversal (like a break of a minor downtrend line or bullish divergence on rsi/momentum)
- once confirmation is seen, consider a long entry in the 0.0430-0.0399 range
- initial take profit could be 0.0450, and if momentum returns, target a move back to 0.0481 and possibly toward 0.0533
- stop-loss should be placed just below the swing low of the setup (ideally under 0.0399 or wherever the price shows clear invalidation of the bullish structure)
example scenario:
if price drops to 0.0405, forms a bullish pin bar, and lower timeframes show bullish divergence, enter long around 0.0410 with targets at 0.0450 (first), 0.0481 (second), and leave a runner for 0.0533 if the trend extends. if price breaks and closes below 0.0399, i’d stay out or look for the next lower demand zone for a setup.
⚠️ if price instead breaks above 0.0481 with strong momentum, you can look for a bullish continuation setup on the next retrace, but do not chase the move; wait for price to retest the breakout area and confirm with a bullish structure.
👀 my expectation: the trend is still bullish as long as 0.0399 holds. i expect a dip into support zones, followed by another try to move higher. if the 0.0399 support fails, price could unwind deeper toward 0.0364 or 0.0336, so be flexible and manage your risk.
this is not investment advice, just an educational analysis! trade safe and watch for confirmation before entering any trade 🚦
📊 Try Finora AI for free - t.me/FinoraEN_Bot
English