Parag Singla
618 posts


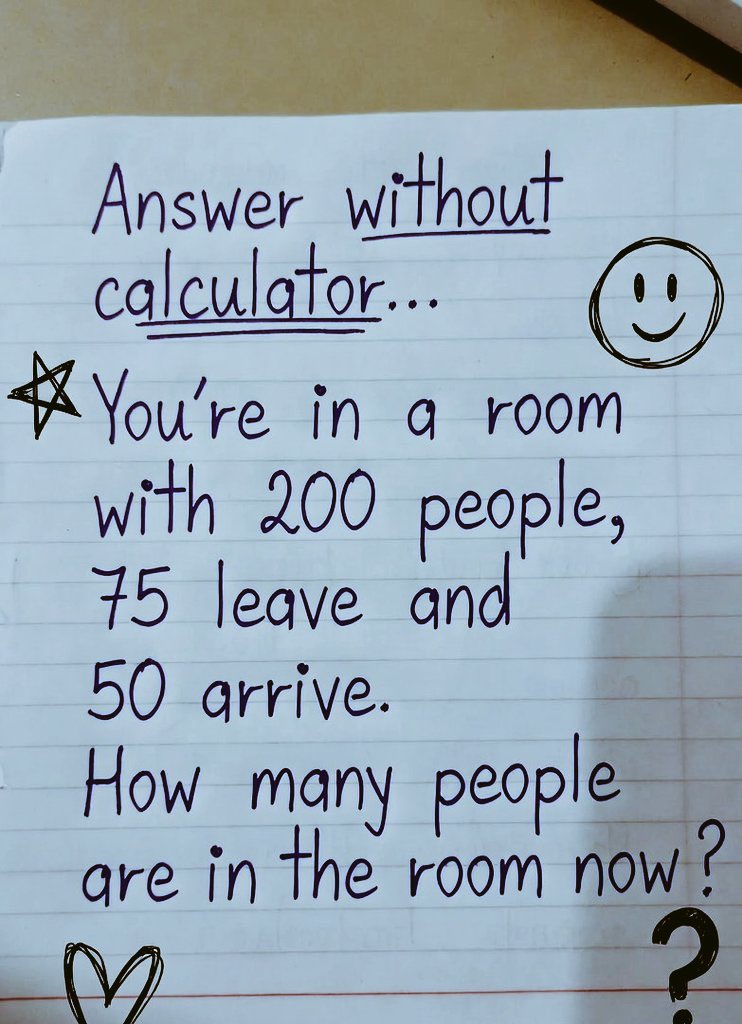
Only a few people find the right answer if you get it right your IQ is different.
How many members in there room?
English
@CryptoBheem Bro do Update on macro picture and which zone we might bottom.
English



GM.
If you had to go ALL-IN on ONE asset today...
What's your pick?
👇
English
@chartexpt Bro this is gold not crypto coin it won’t go below that deep expecting max 3600-3800
English

$XAUt update.
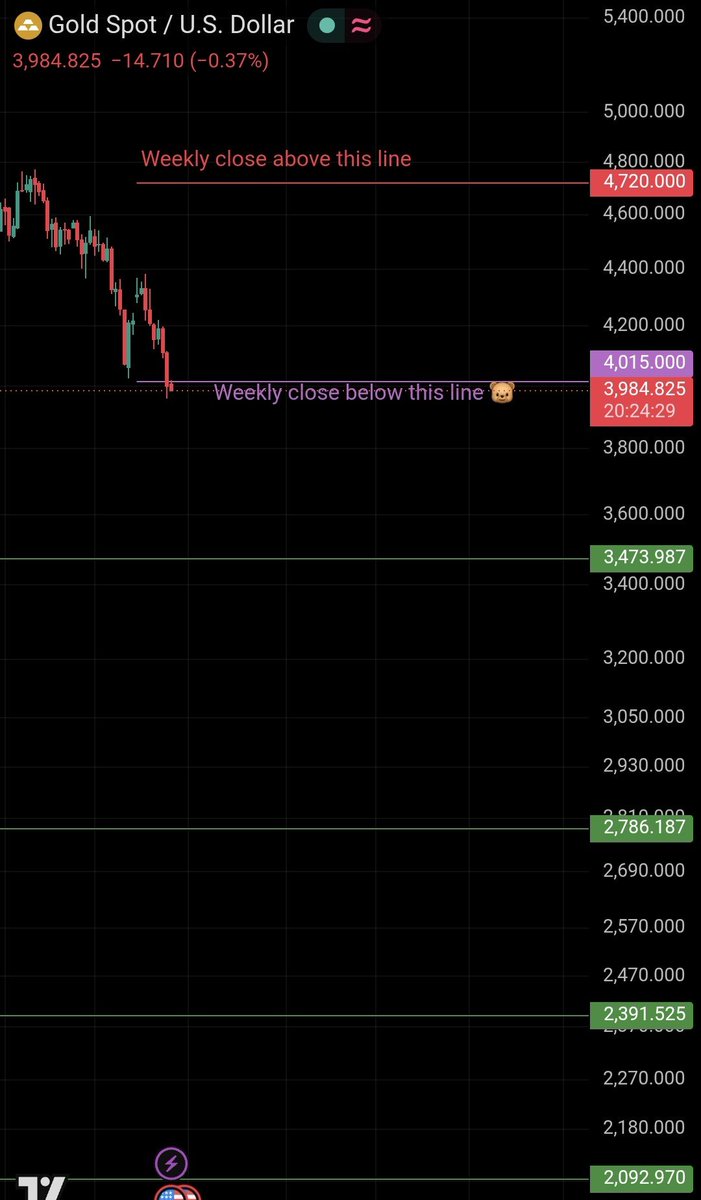
The daily close on #Gold is below 4015.
Structurally speaking, there's an 80-90% probability that the bulls are officially cooked.💀
Waiting for the weekly candle close below 4015 for final confirmation,
However, for absolute confirmation, we must wait for the weekly candle to close below 4015.
Nfa.
Always do your own research.
HaxKai@chartexpt
$XAUt Weekly Study Reading the Macro Ranges. Let's look at the $Gold Spot weekly chart. Price action is heavily defined by two major structural boundaries. Understanding candle closes around these lines keeps you on the right side of the trend. The Bearish Trigger Zone. Notice the purple horizontal floor marked at 4015. A Weekly candle body close below 4015 triggers a breakdown in the macro structure, flipping our bias firmly bearish 🐻. Until a candle body actually secures a close under this floor, don't rush into trading a breakdown. The Bullish Breakout Confirmation. On the upper side, we have a clear horizontal resistance line waiting at 4720. To confirm a strong trend reversal and continuation to the upside, we strictly require a Weekly candle close above 4720. Any temporary push without a candle body lock is just a wick trap. High-timeframe rules demand patience. Let the weekly candle bodies settle beyond either 4,720 or 4,015 to define the clean macro direction. Refuse to chase the consolidation noise. Strictly for educational purposes. DYOR.
English
Parag Singla retweetledi


Parag Singla retweetledi


Parag Singla retweetledi




Parag Singla retweetledi

Parag Singla retweetledi