Patrick Mellacher

955 posts

Patrick Mellacher banner
Patrick Mellacher

Patrick Mellacher

@Patrick_M_Econ

Assistant prof & Deputy Head of the Schumpeter Centre @UniGraz | Agent-based models in (economic) epidemiology, political economy, growth & macro | own views

Graz Katılım Mayıs 2020
664 Takip Edilen634 Takipçiler
Sabitlenmiş Tweet
Patrick Mellacher
Patrick Mellacher@Patrick_M_Econ·
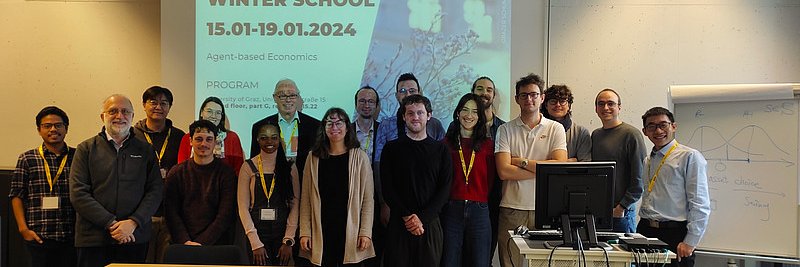
Really happy to announce this year's Graz Schumpeter Winter School and COLIBRI Focus workshop on "Modelling Opinion Dynamics and Social Change" from 1st-5th of December, featuring an exciting interdisciplinary set of keynote speakers: -> Isabel Almudí, University of Zaragoza -> Francisco Fatas-Villafranca (@FatasFrancisco) , University of Zaragoza -> Rainer Hegselmann, Frankfurt School of Finance & Management -> Théo Konc, Wageningen University -> Jana Lasser (@janalasser) , University of Graz -> Jan Lorenz (@jalorenz) , Constructor University (Bremen) -> Christian Proaño (@CR_Proano) , University of Bamberg -> Thomas Schmickl, University of Graz Find more info and apply to participate and present your own paper: schumpeter-centre.uni-graz.at/de/veranstaltu…
Patrick Mellacher tweet media
English
1
1
6
1.3K
Patrick Mellacher
Patrick Mellacher@Patrick_M_Econ·
Super interesting figure: Labour voters are the only ones who perceive themselves as more "radical" than the party that they voted for. All other voters think that they are more to the center (exact opposite of what the Hotelling model would predict)
joe brindle@JoeBrindle_

@piercepenniless @owenjonesjourno Yup. Post-2024 GE polling showed Green voters consider themselves and the party many points to the left of other parties.

English
0
0
6
162
Patrick Mellacher
Patrick Mellacher@Patrick_M_Econ·
@maxgoedl Yes, but bad for EU producers. Most people in the EU are not rentiers living off of dividends from American companies
English
1
0
0
56
Max Goedl
Max Goedl@maxgoedl·
And, by the same token, slashing EU tariffs on American sourced imports is a big win for EU consumers, not a concession to Trump as many people seem to think. This whole discussion is conceptually confused.
Ricardo Reis@R2Rsquared

The biggest loser---by far---from raising tariffs on EU exports to the US from 1.2% (last year) to 15.1% (new deal) is the American consumer. A win for the US? Do you also think that the US would win if it introduced a federal sales tax on some goods?

English
1
0
5
466
Patrick Mellacher
Patrick Mellacher@Patrick_M_Econ·
Our results must be treated with caution: this is an observational study and there are likely important factors that are unobservable and that we thus cannot control for. Nevertheless, it is striking to see these differences in outcomes. More results here: unipub.uni-graz.at/obvugrveroeff/… Final note at the end: We also wanted to study Germany. However, they told us (months after the election) that it would take some more months to release the data. Now, more than one year after the election, they still have not released the data on the municipal-level.... 5/5
English
0
0
1
38
Patrick Mellacher
Patrick Mellacher@Patrick_M_Econ·
Finally, Sweden contrasts Italy and Austria, because i) the Swedish government had a much more lax approach to Covid-19, and ii) the Swedish major right-wing party SD demanded stricter containment policies. We only observe one significant impact: the SD won in areas with low post-pandemic unemployment (in contrast to Austria, Italy). 4/5
Patrick Mellacher tweet mediaPatrick Mellacher tweet mediaPatrick Mellacher tweet media
English
1
0
0
64
Patrick Mellacher
Patrick Mellacher@Patrick_M_Econ·
Happy to announce the publication of our new preprint: E. Asemota, S. Rossi and I explore how the Covid-19 pandemic has affected support for right-wing populist parties on a local level in the European Parliament elections of 2024 in three contrasting cases: Austria, Italy and Sweden . We use OLS and three different types of spatial regressions (SLX, SEM and SDEM) and control for age, education, degree of urbanization and GRP in the municipalities. Our analysis suggests that the pandemic had a significant impact on voting behavior even years after the last lockdown. 1/5
Patrick Mellacher tweet media
English
1
0
3
146
W. Benedikt Schmal
W. Benedikt Schmal@schmal_w·
@MishaTeplitskiy I guess most code files do not use relative but absolute paths. Cleaning this might already fix most of the errors
English
1
0
1
57
Misha Teplitskiy | Science of Science
The replication packages that scientists post along with their papers don't run 74% of the time😅 Good news is that in many cases the errors are simple to fix.
Misha Teplitskiy | Science of Science tweet media
English
3
0
19
699
Patrick Mellacher
Patrick Mellacher@Patrick_M_Econ·
I'm thrilled to announce the #OA publication of my paper "Growth, inequality and declining business dynamism in a unified Schumpeter Mark I + II model" in ICC (annual issue on Macro and Development): academic.oup.com/icc/advance-ar… The paper reinterprets Schumpeter Mark I and Mark II as interacting engines of growth within a unified framework. In my model, Mark I - centered around the entrepreneur - is crucial during the birth of new industries, while Mark II - innovation through R&D departments - defines the evolution of industries and becomes important over time when looking at a specific industry. The model features an ever-growing number of industries that produce heterogeneous consumption goods. I show that the baseline scenario of the model is able to i) quantitatively fit key indicators on growth and inequality in the US quite nicely and ii) reproduce all ten stylized facts on "declining business dynamism" since the 1980s brought forward by @ufukakcigit and Ates in AEJ macro in 2021. A counterfactual policy analysis highlights two culprits in my model: First, relaxed antitrust enforcements since the 1980s. My model suggests that stringent antitrust policy could have reversed 6 out of 10 facts and mitigated the others (caveat: my model is highly stylized in policy-terms). Second, a parameter that I call "imitation distance penalty". The empirical literature suggests that it is difficult for laggards to catch up with industry leaders if the technological distance between the two is large. If this effect is strong, industries tend to monopolize, thus contributing to the metrics associated with declining business dynamism. I further discuss how Schumpeter Mark I and Mark II are related to declining business dynamism. In my model, massive birth of new industries is associated with a temporary increase in average concentration and inequality, thus contributing to some - but not all - metrics discussed by Akcigit and Ates as signs of declining business dynamism. This is because creating a new industry allows firms to establish a temporary monopoly. They will only face competition after some time (when others had the chance to enter the industry as well). Hence, inequality stemming from Mark I is not per se problematic in the longer term. In contrast, inequality and market concentration stemming from Mark II comes from firms that become technologically too advanced for laggards to catch up. Competition will not solve this problem on its own. I started working on this paper almost 6 years ago. I'm really grateful for all the feedback that I received on this paper, in particular by @AndreaRoventini who has commented on it at multiple stages of the paper (including the very first version that I presented in 2019) and by the referees who did a great job in scrutinizing the paper and model and pushed me to incorporate, among others, a financial sector into the model.
Patrick Mellacher tweet media
English
1
0
4
263
Patrick Mellacher retweetledi
Andrea Roventini
Andrea Roventini@AndreaRoventini·
The call for paper for the 4th Agent-Based Modelling for Policy (ABM4Policy) workshop is finally out! The workshop is co-organized with the European Central Bank. Deadline for paper submissions: April 9th. ecb.europa.eu/press/conferen…
Andrea Roventini tweet media
English
0
11
23
1.7K
Patrick Mellacher
Patrick Mellacher@Patrick_M_Econ·
Auf meine Studie angesprochen, fragte Fr. Belakowitsch gestern im #ORFreport nach den Zahlen zum Zusammenhang zwischen FPÖ Wahlergebnis und Covid-19 Sterblichkeit. Ich liefere diese gerne hier nach. Etwas ältere Zahlen mit deutlich detaillierten Analysen finden sich in meiner 2023 in #JEBO erschienenen Studie #sec0020" target="_blank" rel="nofollow noopener">sciencedirect.com/science/articl… Die Anzahl an Covid-19 Todesfällen im Zeitverlauf sind mittlerweile nicht mehr online verfügbar. Ich muss daher auf ein Backup vom Juni 2023 zurückgreifen. Allerdings sterben seitdem glücklicherweise in Relation nicht mehr so viele Menschen an Covid-19, dass das die Ergebnisse groß verändern würde. Schauen wir uns zunächst einmal den Zusammenhang zwischen Covid-19 Todesfällen und FPÖ-Anteil bei den NRW 2019 auf Bezirksebene am 29.6.2023 an. Wir sehen eine ziemlich hohe, hoch signifikante Korrelation. 1/7
Patrick Mellacher tweet media
Deutsch
59
102
424
53.5K
EKa.Systemanalyse
EKa.Systemanalyse@KochID19·
Gucke mal @oliverbeige @GeoWieland @haake_daniel @RBrinks was für "spannende" Korrelationen da *ähm wissenschaftlich elaboriert und vom ORF promotet werden. Gab's da nicht in Deutschland auch eine ähnliche gelagerte Studie™ bzgl. AfD ;)
Patrick Mellacher@Patrick_M_Econ

Auf meine Studie angesprochen, fragte Fr. Belakowitsch gestern im #ORFreport nach den Zahlen zum Zusammenhang zwischen FPÖ Wahlergebnis und Covid-19 Sterblichkeit. Ich liefere diese gerne hier nach. Etwas ältere Zahlen mit deutlich detaillierten Analysen finden sich in meiner 2023 in #JEBO erschienenen Studie #sec0020" target="_blank" rel="nofollow noopener">sciencedirect.com/science/articl… Die Anzahl an Covid-19 Todesfällen im Zeitverlauf sind mittlerweile nicht mehr online verfügbar. Ich muss daher auf ein Backup vom Juni 2023 zurückgreifen. Allerdings sterben seitdem glücklicherweise in Relation nicht mehr so viele Menschen an Covid-19, dass das die Ergebnisse groß verändern würde. Schauen wir uns zunächst einmal den Zusammenhang zwischen Covid-19 Todesfällen und FPÖ-Anteil bei den NRW 2019 auf Bezirksebene am 29.6.2023 an. Wir sehen eine ziemlich hohe, hoch signifikante Korrelation. 1/7

Deutsch
2
0
5
412
Patrick Mellacher
Patrick Mellacher@Patrick_M_Econ·
@oliverbeige @KochID19 @GeoWieland @haake_daniel @RBrinks Zur Bevölkerungsdichte bitte hier entlang: x.com/Patrick_M_Econ… Zum Endogenitätsproblem bitte das Paper lesen, ich gehe wirklich detailliert darauf ein.
Patrick Mellacher@Patrick_M_Econ

@oliverbeige @zoller_marco @KochID19 @GeoWieland @haake_daniel @RBrinks Das ist nicht richtig. Wenn wir die Bevölkerungsdichte (gemessen an Anz. EW / Dauersiedlungsraum bzw. Anz. EW / Siedlungsraum lt. Statistik Austria) in die Analyse miteinbeziehen, verstärkt sich der Effekt des FPÖ-Wahlergebnisses sogar. 1/2

Deutsch
1
0
0
106
𝕆𝕝𝕚𝕧𝕖𝕣 𝔹𝕖𝕚𝕘𝕖
Card & Kruger funktioniert weil die Subpopulationen in NJ und PA als quasirandomisierte Treatment- und Kontrollgruppen genommen werden können. Sie sind demographisch nahezu identisch. Wenn ich eine Entscheidungsvariable als Separator nehme, die offensichtlich mit dem Ausgang verknüpft ist, dann hab ich Feuer unterm Dach.
Deutsch
1
0
1
121