
Alejandro Pezzola
1.4K posts

Alejandro Pezzola
@Pe_Alejandro07
Lic. en Geografía. Trabajo en la Estación Experimental Agropecuaria Hilario Ascasubi Instituto Nacional de Tecnología Agropecuaria
Mayor Buratovich Katılım Nisan 2019
1K Takip Edilen410 Takipçiler

🚀 Unlock the Power of MaxEnt in Geospatial Modeling! 🌍📊
Comment "MAXENT" to get this code link
#MaxEnt #RemoteSensing #GIS #GeospatialAI #EarthObservation #MachineLearning #SpatialAnalysis #GEE #SatelliteData #EnvironmentalModeling #AIforEarth
English
Alejandro Pezzola retweetledi

En medio del parque Pereyra, hay un instituto Conicet Unlp, el IAR. Hoy, lograron captar las señales de nuestro satelite, en el marco de la mision Artemis II. Gracias por sacarme un rato del barro y hacerme sentir orgulloso de compatriotas.

Español
Alejandro Pezzola retweetledi

🔴 Los incendios en la Patagonia esta mañana desde el espacio
Español
Alejandro Pezzola retweetledi

Un orgullo como argentino ver al embajador Ian Sielecki rehusarse a hablar delante de un mapa donde se identificaban a las Islas Malvinas como territorio británico. No lo conozco, no me importa de qué partido es, aplaudo su gesto patriótico así como repudio el cipayismo de Milei.
Español
Alejandro Pezzola retweetledi
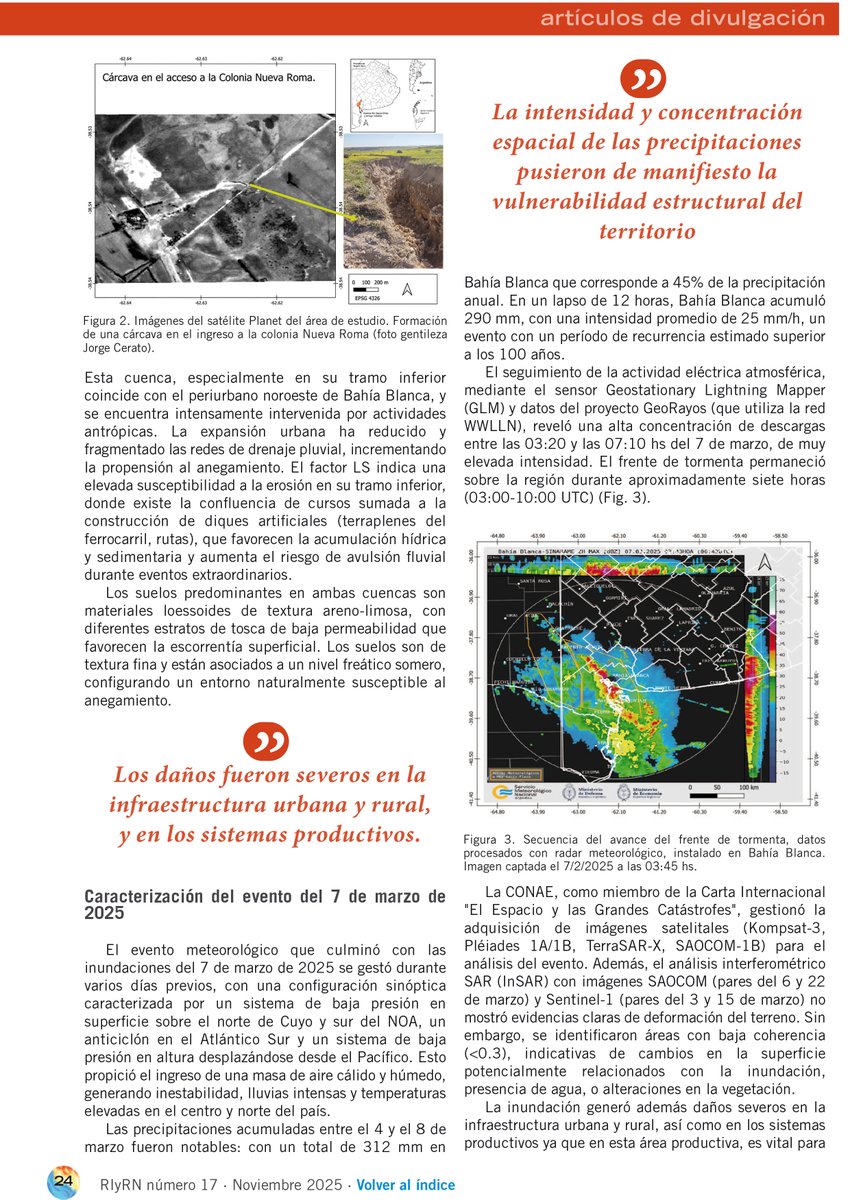
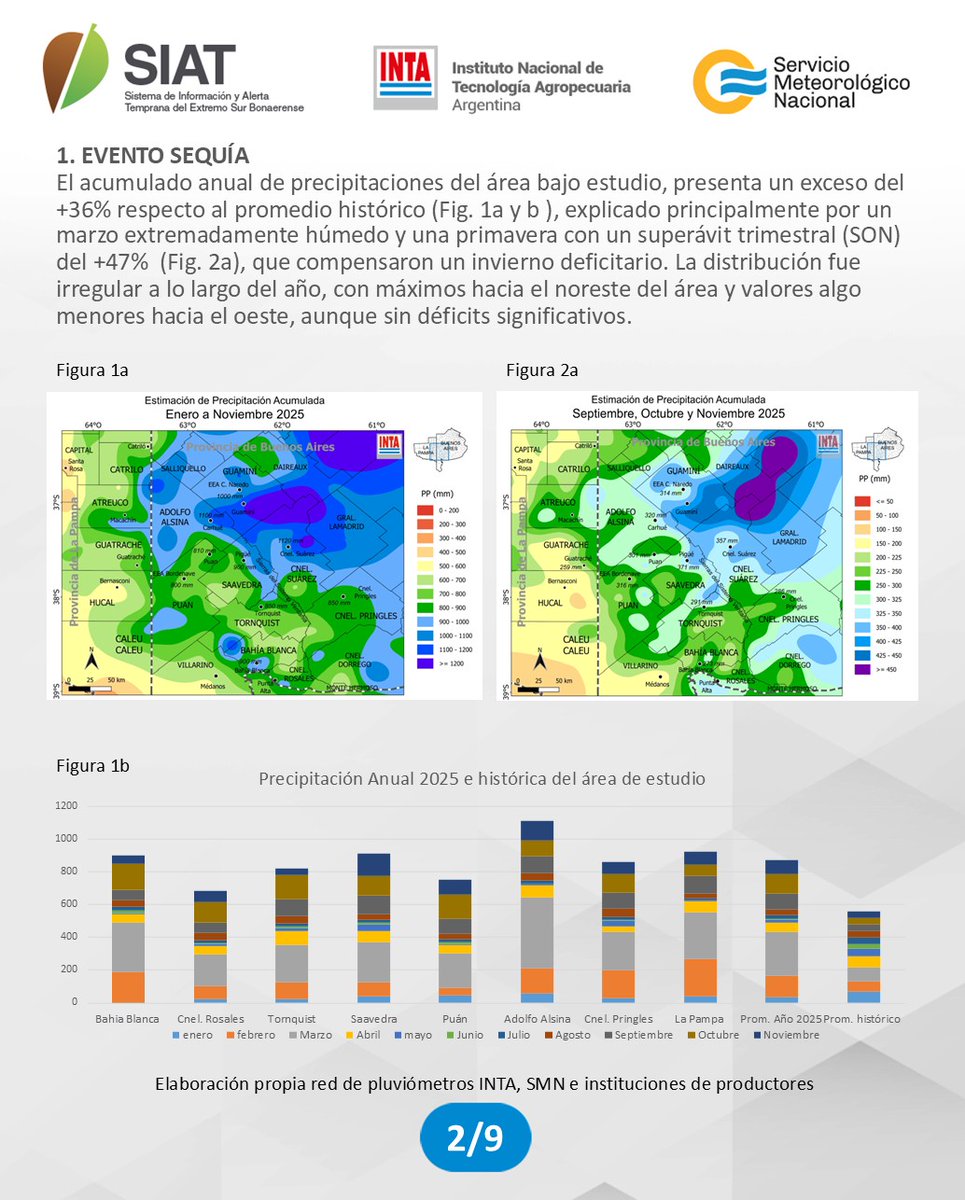
🌊🌊Inundaciones en las Cuencas de Sauce Chico y Saladillo de García: Estrategias de Mitigación
La intensidad y concentración espacial de las precipitaciones pusieron de manifiesto la vulnerabilidad estructural ...
📌 revistarirn.org/revista
🔥#RevistaIyRN 17
#RiesgosNaturales


Español
Alejandro Pezzola retweetledi
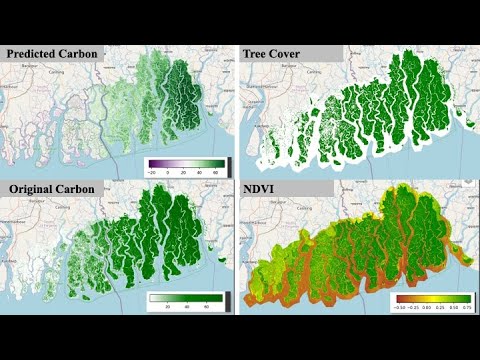
Google Earth Engine Python Tutorial: How to predict Forest Carbon?
Tutorial Link: youtu.be/vzdXGdcNDwg?si…
For more information about registration, visit our website: studyhacksgeospatial.com/google-earth-e…
#forestcarbon #googleearthengine #pythontutorial #carbonprediction #sustainability
YouTube

English
Alejandro Pezzola retweetledi

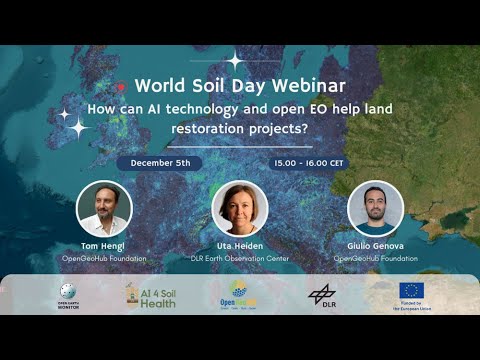
Soil Health Data Cube (#SHDC) has just been updated (to v1.1)! Dynamic soil properties and soil health indicators at 30 m resolution 2000-2024 for pan-EU as #OpenData. Several issues in data and front-end have been systematically improved (thanks to many colleagues from @AI4SoilHealth project and various national agencies). You can access the updated data from stac.EcoDataCube.eu and explore via EcoDataCube.eu (webinar: youtu.be/eMmhepWg6Cs?t=…). For technical documentation see: shdc.ai4soilhealth.eu.
It is now also possible to visualize prediction intervals (uncertainty) and overlay SHDC vs various national cadastral and admin data with many thanks to the @GilabRs and colleagues from the @EarthMonitorOrg project.
Read more about how were the soil health indicators produced (doi.org/10.5194/essd-1…), including soil carbon dynamics (doi.org/10.7717/peerj.…). Projects funded by @REA_research Horizon Europe.
If you are at #EUAgriFoodDays in Brussels (agriculture.ec.europa.eu/eu-agri-food-d…), come to the AI 4 Soil Health stand on Wednesday 17th Dec (Day 3 – Agri-Digital Day) and get a walk through - how can you easily access the SHDC data and how could you use it to help manage land? Which soil agronomy data is still missing and what should we add to SHDC in 2026?
YouTube

English
Alejandro Pezzola retweetledi
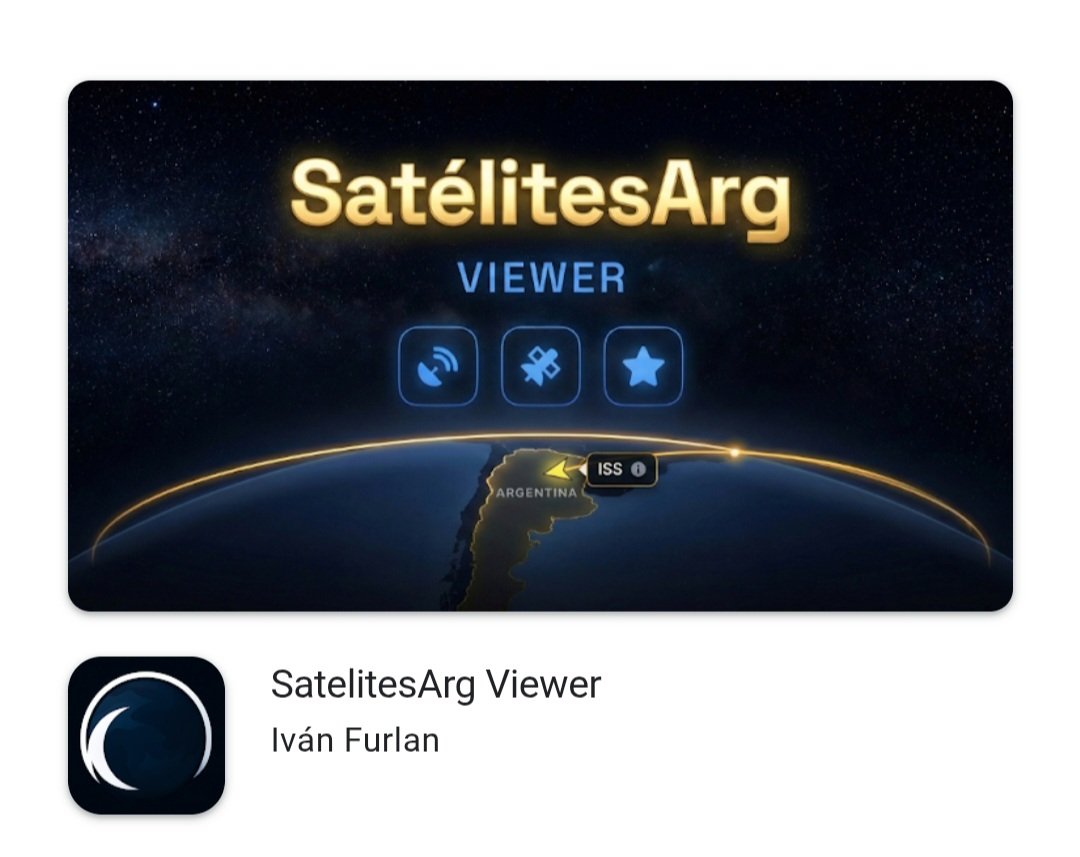
SatelitesArg Viewer ya está en Play Store para Android 🚀📱
Si la prueban, nos ayudan un montón calificándola y dejando una opinión 🙌👇
play.google.com/store/apps/det…
Español
Alejandro Pezzola retweetledi

Google #EarthEngine Tutorial-170 Published: #Crop Production Analysis using #MODIS NPP
youtu.be/Ee3Ht2TXSWo
YouTube
English
Alejandro Pezzola retweetledi

Alejandro Pezzola retweetledi

En 1890, cuando Henri Poincaré se plantó frente al caos del universo y declaró la no existencia de una primera integral uniforme para el problema de tres cuerpos, en realidad estaba abriendo una puerta: la certeza de que el cosmos no es un mecanismo de relojería, sino una danza impredecible donde un suspiro inicial puede decidir el destino de mundos enteros.
Su demostración —elegante, feroz, casi poética— reveló la sensibilidad exquisita a las condiciones iniciales, esa propiedad que hoy llamamos caos determinista. Es decir: cambia una pestaña del sistema, y el futuro entero se vuelve otro.
Pero aquí viene la ironía cósmica, el tipo de giro que le habría arrancado una sonrisa a Poincaré:
a pesar del caos, el sistema también es capaz de engendrar órbitas estables, soluciones que se aferran al equilibrio como si desafiaran la entropía misma. Son raras, caprichosas, casi anómalas… pero existen. Y estas que ves son precisamente algunas de esas configuraciones —islas de estabilidad en un mar turbulento de posibilidades gravitacionales.
En otras palabras:
La gravedad, como la vida, puede ser regimentada o indómita, caótica o armónica, y a veces —solo a veces— las tres cosas al mismo tiempo.
Español
Alejandro Pezzola retweetledi


Alejandro Pezzola retweetledi

🇺🇳En el Día Internacional de los Derechos Humanos compartimos este video del trabajo de búsqueda de personas desaparecidas en el ex Centro Clandestino de La Perla (Córdoba, Argentina).
En el EAAF trabajamos desde 1984 para la restitución de la identidad de personas desaparecidas.
Español
Alejandro Pezzola retweetledi
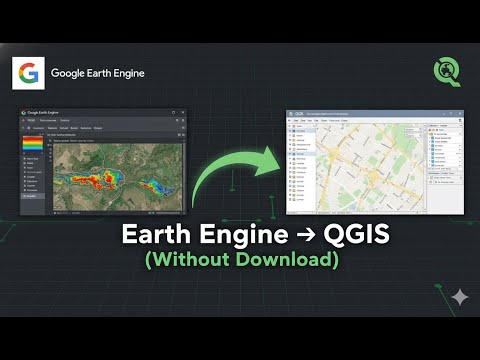
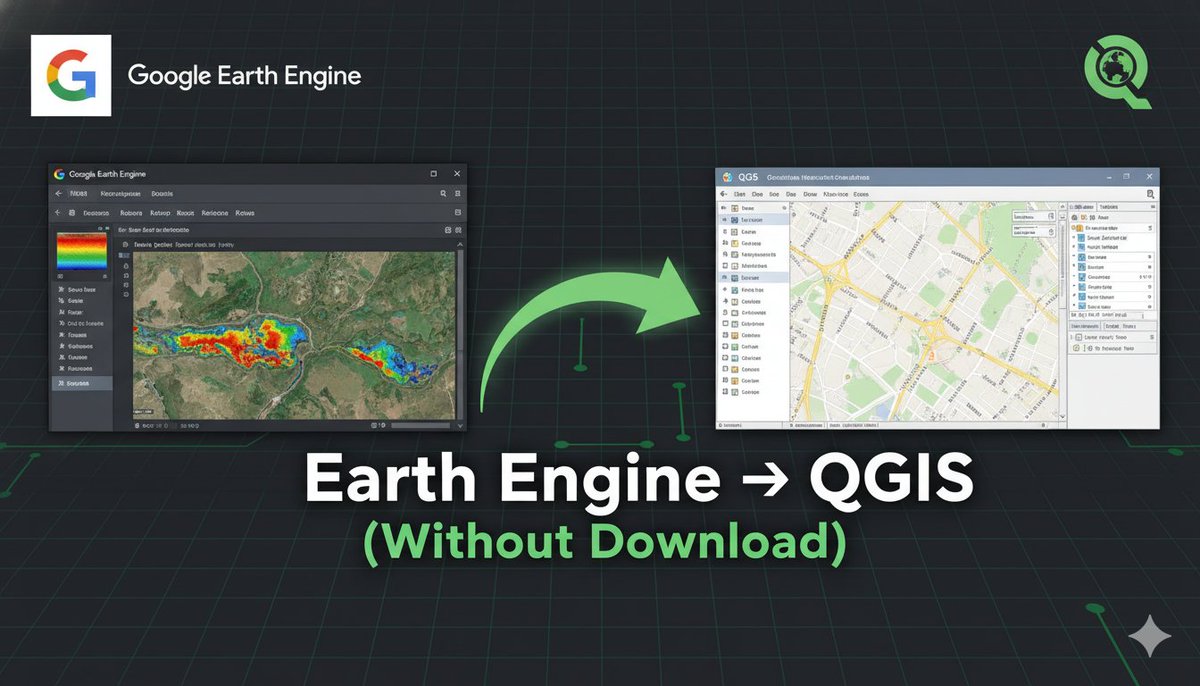
“Adding Imagery from Earth Engine to QGIS WITHOUT Downloading”
Tutorial Link: youtu.be/rOsTorbhSPU
Registration Info: studyhacksgeospatial.com/google-earth-e…
#QGIS #GoogleEarthEngine #RemoteSensing #Tutorial #GEE #GISWorkflow #EarthObservation #GeospatialAnalysis #StudyHacks
YouTube
English
Alejandro Pezzola retweetledi

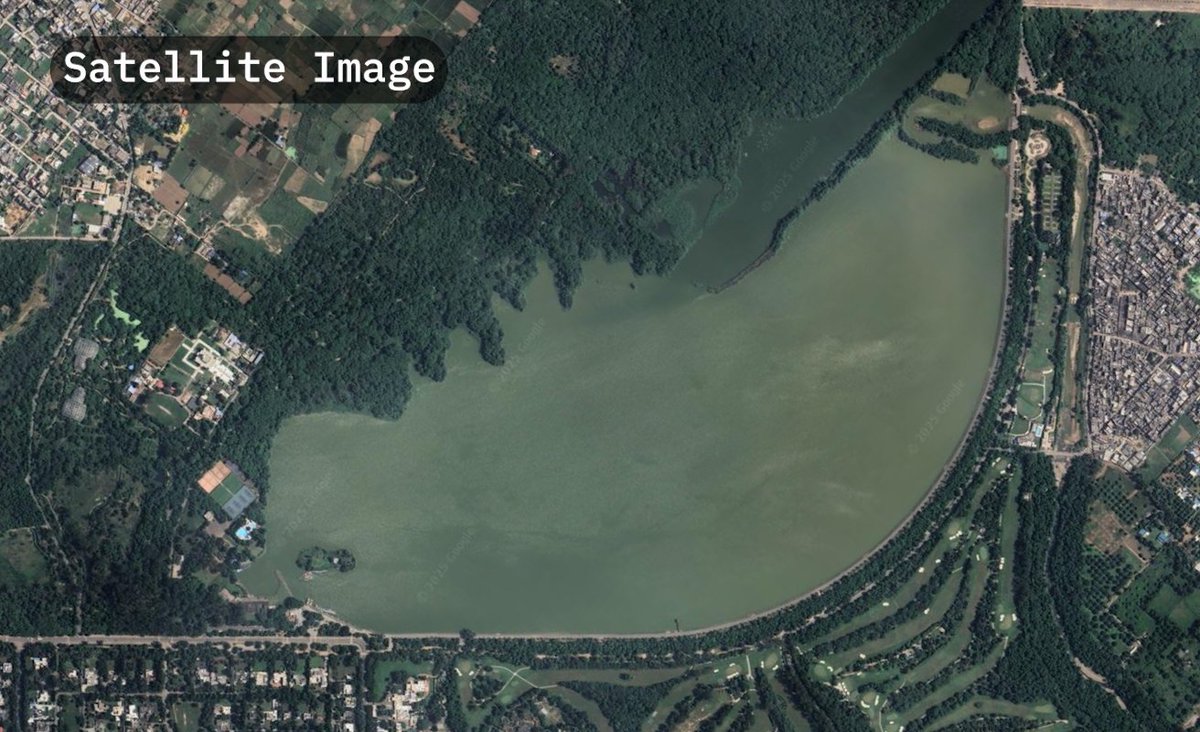
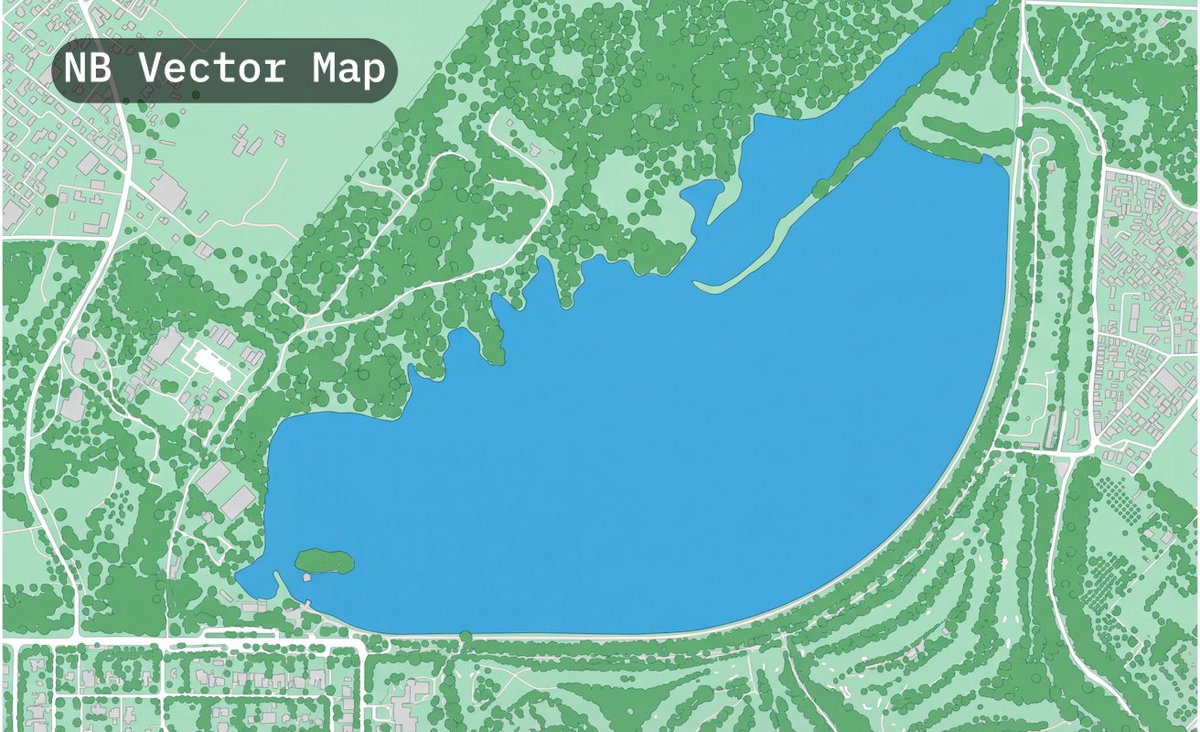
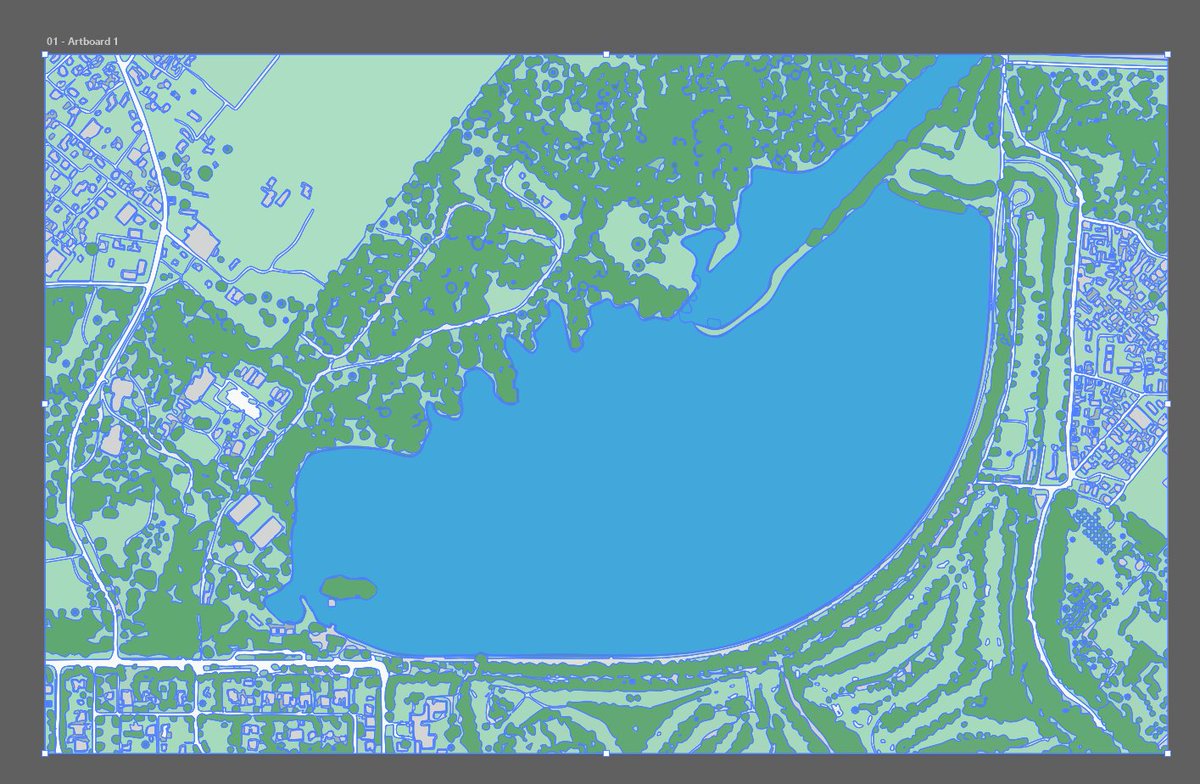
This could be a pretty cool way to generate the set dressing for maps (e.g. agricultural fields, wild forests, manicured parks). Even tried to vectorize the output in illustrator (see below).
My prompts below:
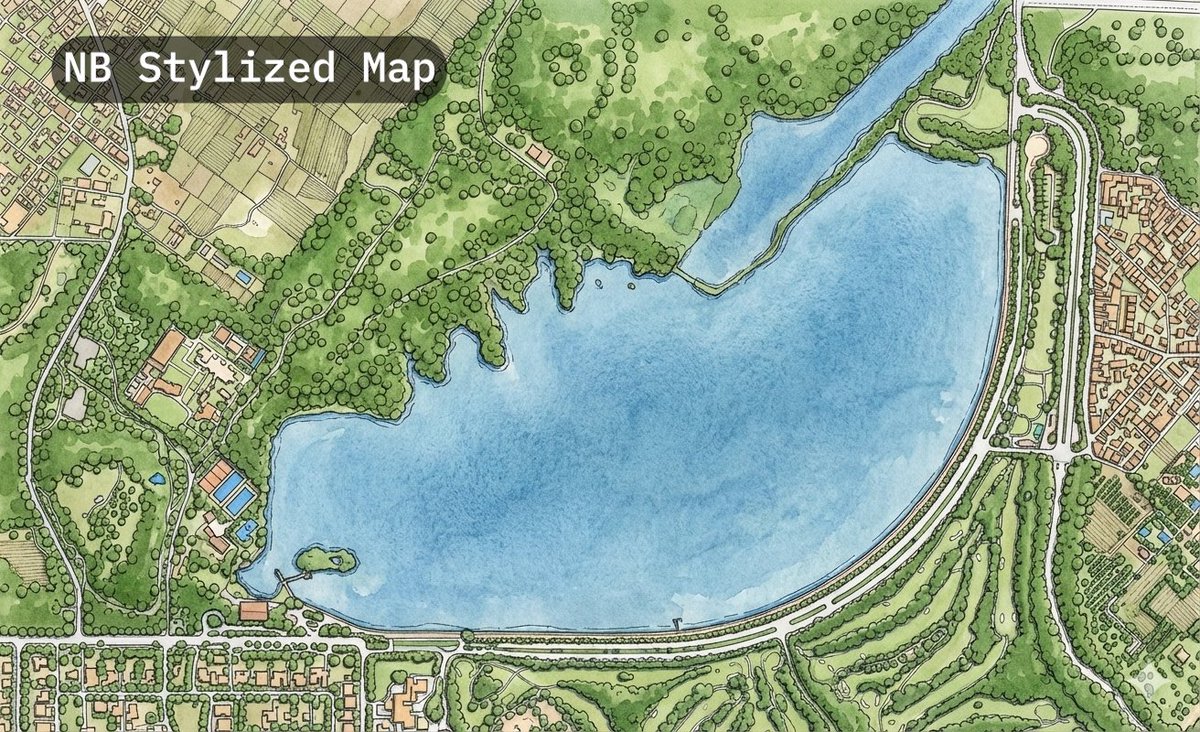
(Stylized Map)
Create a masterpiece-level hand-drawn urban planning map based on the provided satellite image. The style should merge technical accuracy with artistic cartography.
Visual Style:
Ink and watercolor wash aesthetic, but with the precision of a CAD drawing.
Vibrant but natural color palette.
Detailed Elements:
Buildings: Hand-inked outlines with a slight bevel effect for dimensionality.
Nature: Trees should be represented by individual distinct circular canopies for street trees, and textured green washes for parks.
Water: Watercolor texture blue with defined banks.
Roads: Clearly defined clean paths, varying in width based on the satellite image prominence.
Composition: High level of detail, covering all semantic classes (sidewalks, swimming pools, medians). The result should look like a finalized vector illustration ready for print.
("Vector" HD Map)
Role: Act as an expert Cartographer and GIS Specialist specializing in High-Definition (HD) vector mapping.
Task: Convert the attached satellite image into a highly detailed, segmented vector-style map. The output must look like a pristine, digital map interface similar to Apple Maps or a high-end CAD site plan.
Visual Style:
Perspective: Strictly top-down orthographic (2D). No tilt, no camera distortion.
Aesthetic: Flat vector graphics, sharp geometric edges, solid color fills, no gradients, no photographic textures.
Line Work: Clean, continuous Bezier-style curves.
Semantic Segmentation Rules (Color & styling):
Buildings: Render as solid, neutral light-grey shapes (Hex #E5E5E5) with a very subtle, thin darker outline to define edges. Represent precise footprints.
Roadways: Render as distinct white paths with varying widths corresponding to reality (Highways > Streets > Alleys).
Pedestrian Areas: Render sidewalks, walkways, and trails as very light warm-grey lines, distinct from the roads.
Water Bodies: Pools, ponds, and rivers should be a flat, vibrant "Map Blue."
Vegetation:
Lawns/Grass: A soft, pastel mint green.
Trees/Canopy: Distinct, darker green circles or organic blobs placed over the grass layer to represent tree coverage.
Ground/Base: A neutral background color.
Granularity & Detail:
Maintain strict adherence to the spatial layout. Include granular details like driveway cutouts, median strips on roads, and distinct separation between buildings and sidewalks.
Negative Constraints:
Do not include: Shadows cast by buildings, cars, people, clouds, photographic noise, or 3D perspective effects. The image should look like a generated vector file, not a photo filter.
English
Alejandro Pezzola retweetledi

Hoy hace nueve años que publicamos CRIOLLO, nuestra primera App.
Con más de 10mil instalaciones sigue más vigente que nunca!
Acá un recorrido por todas sus portadas a lo largo del tiempo.
play.google.com/store/apps/det…

Español
Alejandro Pezzola retweetledi
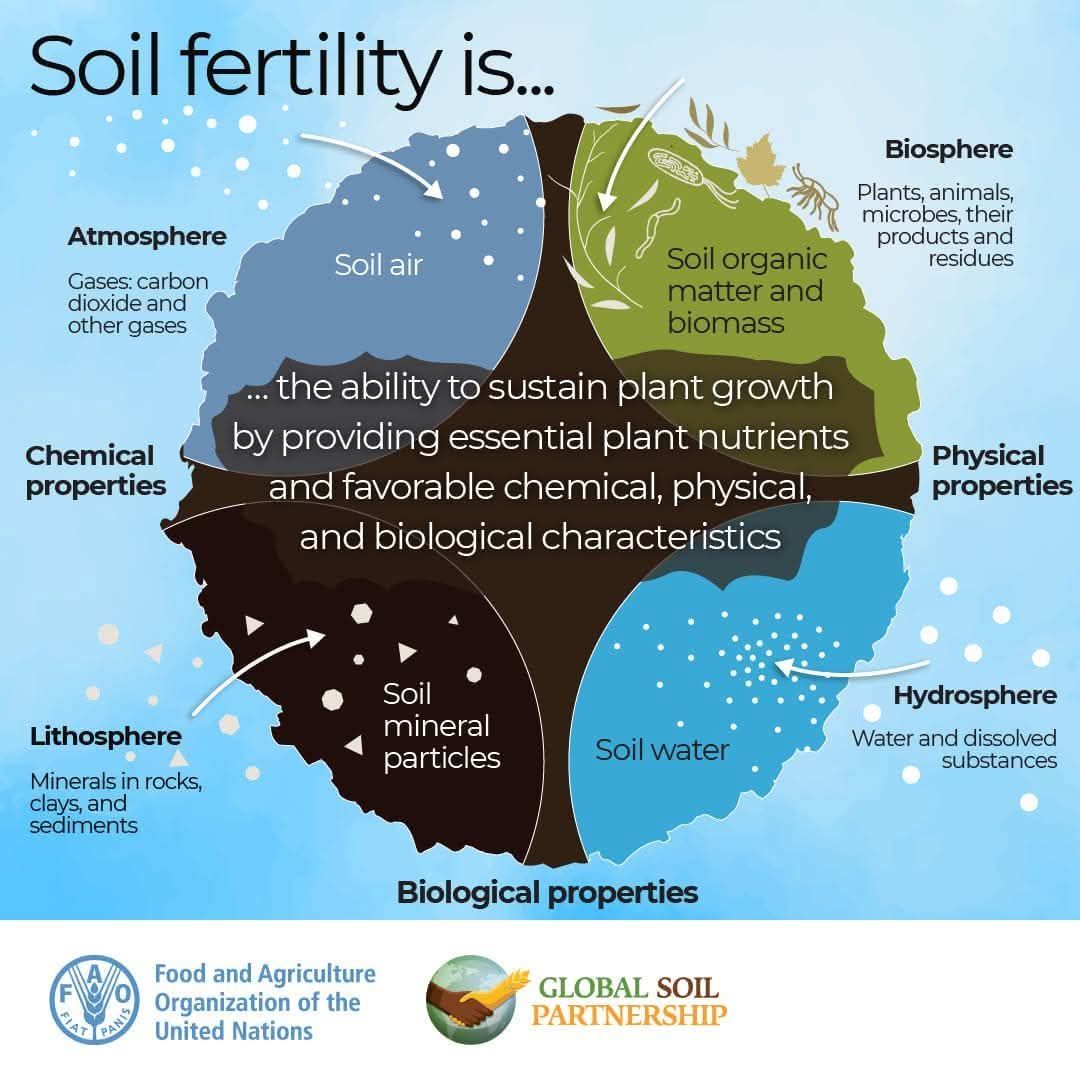
But what is #Soil fertility?
#Soils4Nutrition #SoilHealth #GlobalSoilPartnership
Read more 👇🏿👇🏿👇🏿
doi.org/10.4060/cc0900…
English
Alejandro Pezzola retweetledi

Learn how to visualize Cloud Optimized GeoTIFFs (COGs) right in your browser – no tile server is needed! In this step-by-step tutorial, you'll discover how to load and render COGs instantly using Leafmap within a Jupyter Notebook.
Whether you're working with aerial imagery, LiDAR datasets, or multiband raster data, this guide shows you how to:
Load GeoTIFFs via HTTP URLs
Customize indices, colormaps, and opacity
Combine imagery, elevation & vector data in one map
Run everything 100% serverless in your browser!
👉 Notebook example: leafmap.org/notebooks/108_…
📺 Full video tutorial on YouTube: @giswqs/videos" target="_blank" rel="nofollow noopener">youtube.com/@giswqs/videos
#geospatial #opensource #leafmap #python
English
Alejandro Pezzola retweetledi

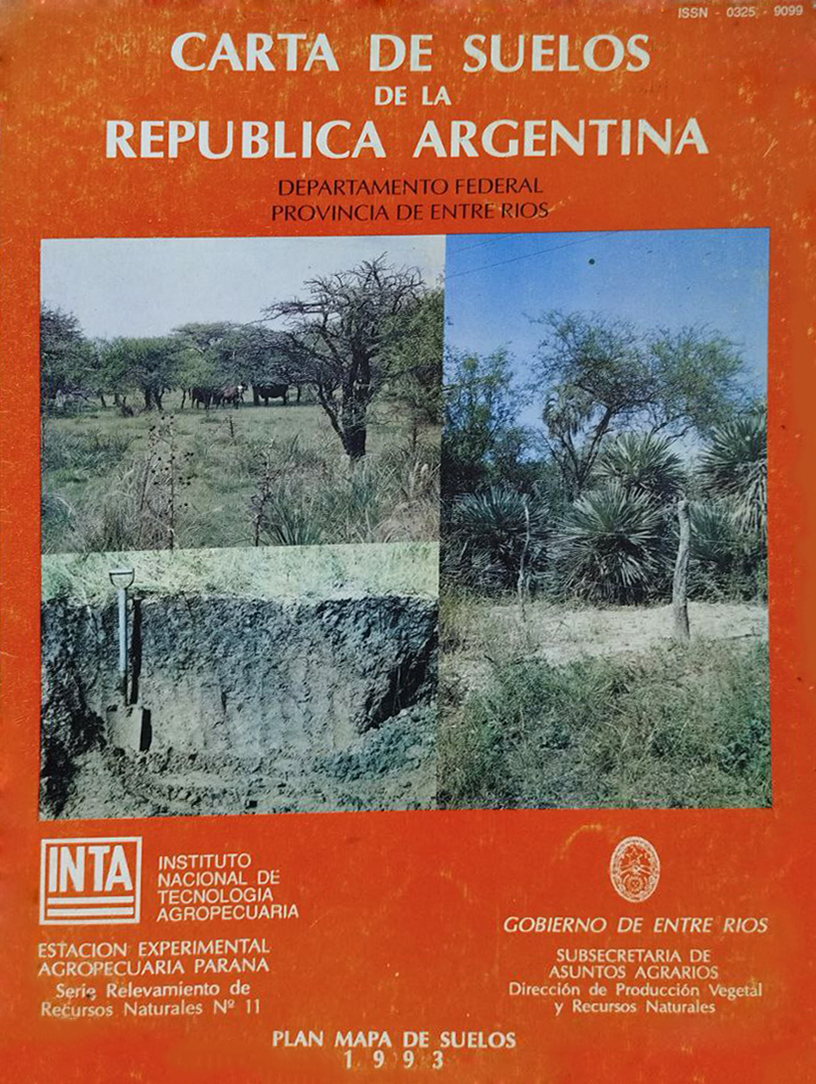
📗Carta de Suelos Dpto. Federal - Entre Ríos Escala 1:100.000
Disponible en: geo-nodo05.inta.gob.ar/catalogue/#/do…
Mapa de Suelos de la provincia de Entre Ríos (shp): geo-nodo05.inta.gob.ar/catalogue/#/da…
@intaargentina #INTAGeo
Español
Alejandro Pezzola retweetledi

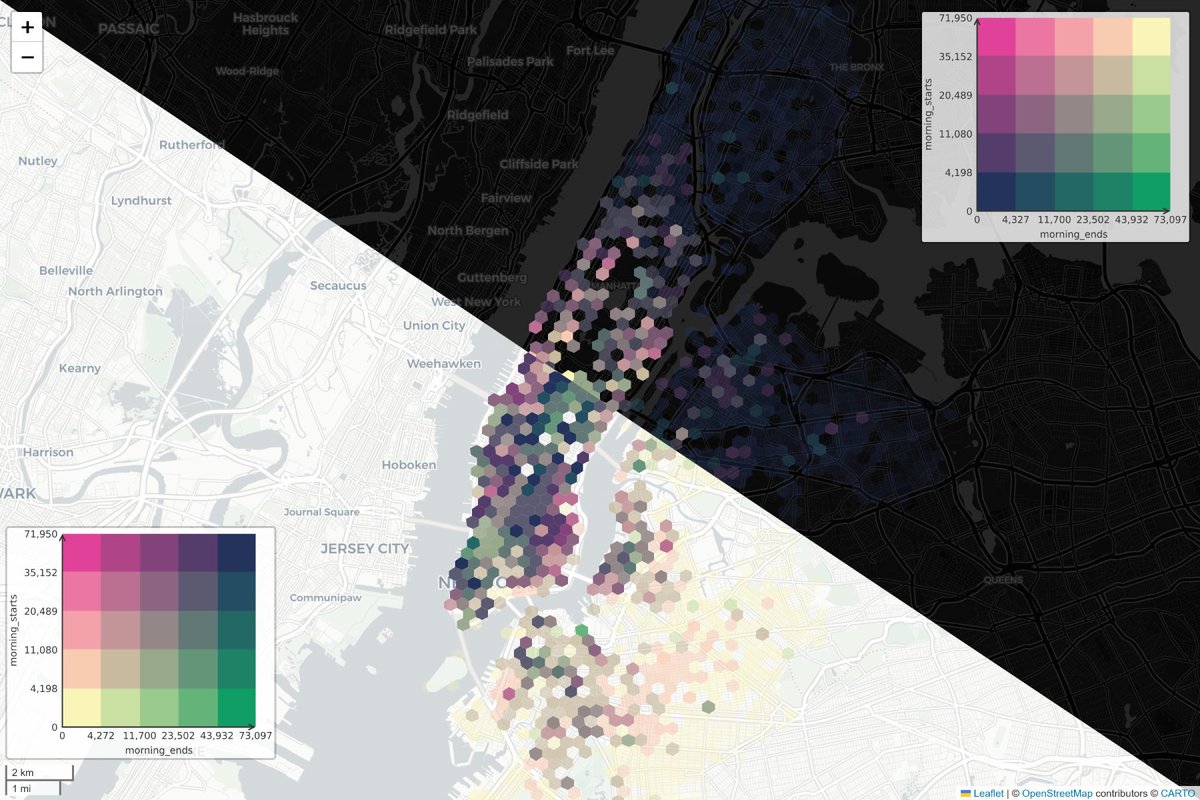
Finally! Meet bivario, Python library for plotting bivariate choropleth maps in Matplotlib and Folium.
Who wants a tutorial on making bivariate climate maps?
English