Pierce&Pierce
365 posts

Pierce&Pierce
@PiercePierceNYC
We provide the highest quality Institutional Grade Intelligence for the Retail Investor.


INTERESTING.... 2 Charts... TOP - USDJPY - Inverted (upside down) the black line is the japan m2 with no lag.. Notice when USD falls against the JPY the Japan M2 goes up... and vice versa.. Here's where it gets interesting... Bitcoin vs Japan m2 + 10 week delay (blue line) When Japan M2 rises 10 weeks later so does bitcoin and alts. When japan m2 falls 10 weeks after so does bitcoin and alts.. SO WHAT??! Well if USD cotinues to weaken vs Japanese Yen then Japan M2 will rally.. and 10 weeks after..... well.... Just look at the charts, tell me what you see, go check it out on trading view. Remember to Inverse the USDJPY chart so it effectively gives you the JPYUSD valuation.


Chicago PMI came in at 54 ISM shows the US business cycle Above 50 = expansion Below 50 = contraction Every major Bitcoin bull market aligned with ISM turning up Not a “4 year cycle”


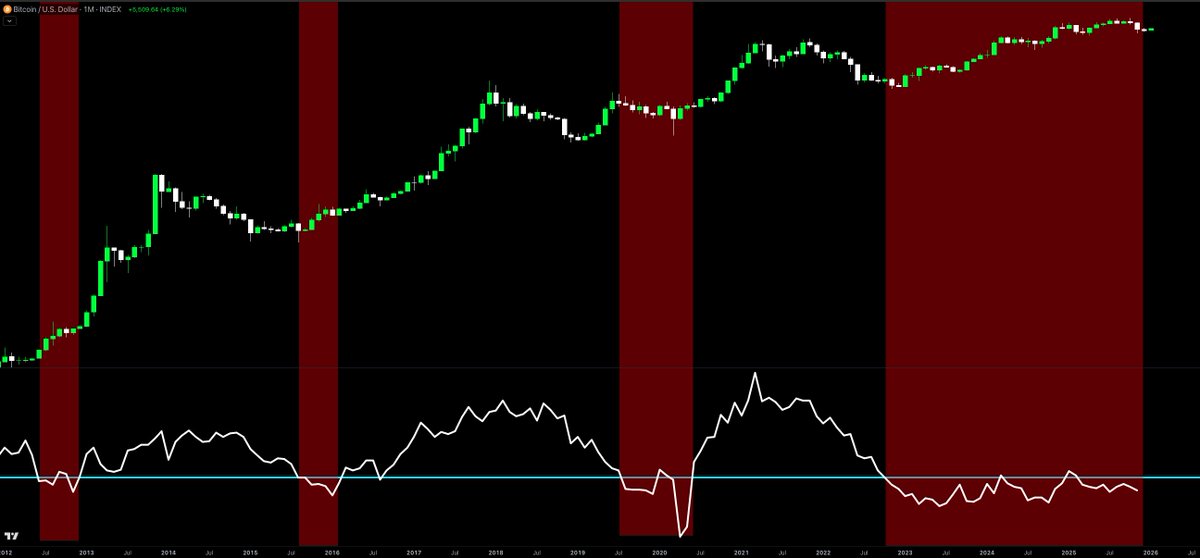
Every Bitcoin cycle top since 2013. Every cycle bottom. Zero false alarms. This week: No signal. Gate closed. Mid-cycle. We post weekly. When conditions shift, we post immediately. You will know before the signal fires. Not after. Follow. Alerts on. pierce-pierce.ghost.io/cri-weekly-das…