
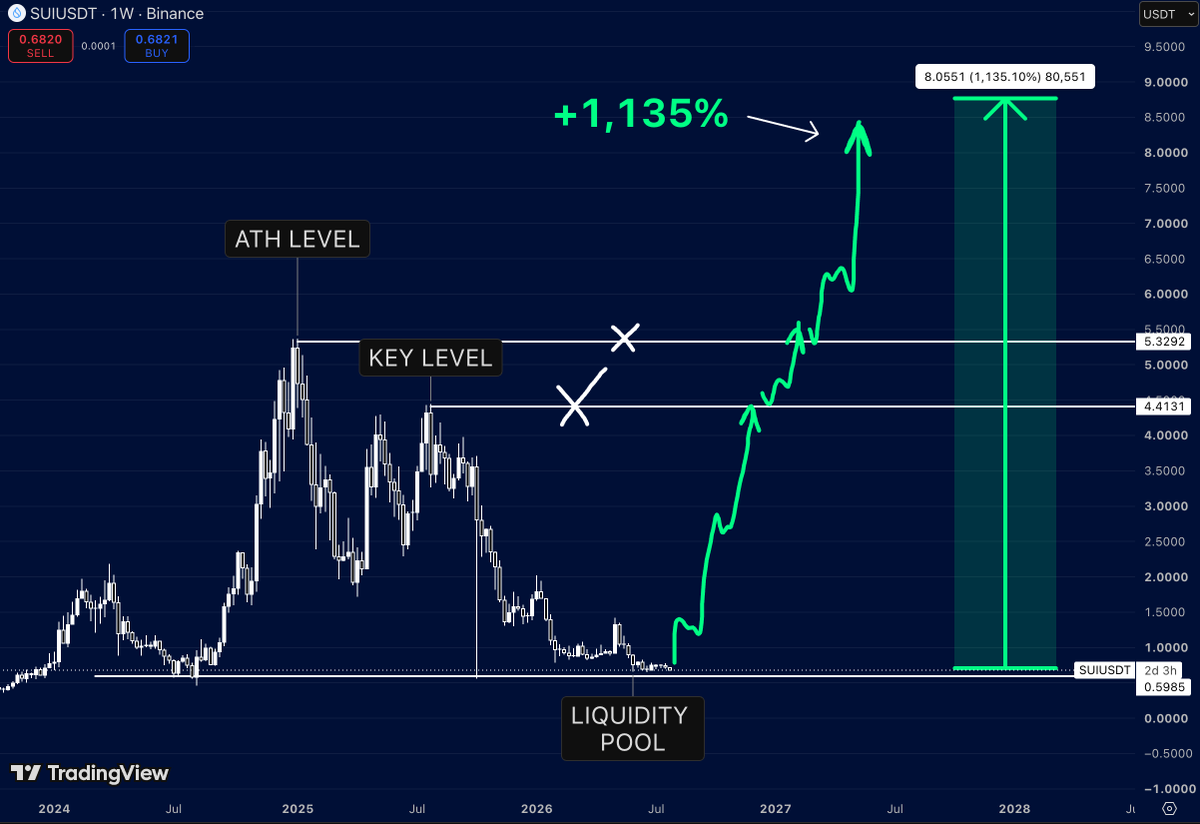
$SUI doesn’t look dead
It looks ignored.
And those are two very different things.
The majority of market participants only see a chart that’s been bleeding for months.
I see something else.
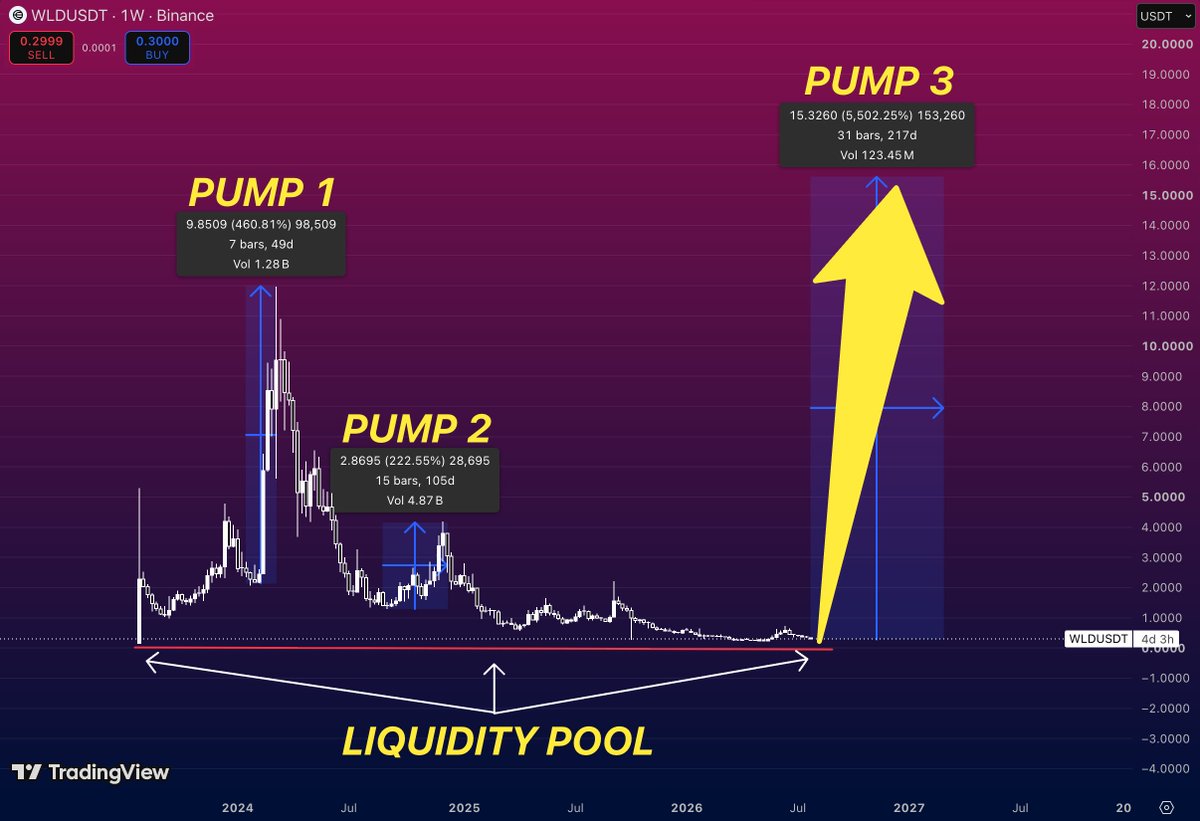
A massive liquidity sweep.
A long period where impatient holders slowly gave up their positions.
Markets don’t bottom when everyone becomes bullish.
They bottom when people stop caring.
That’s exactly what makes these structures interesting.
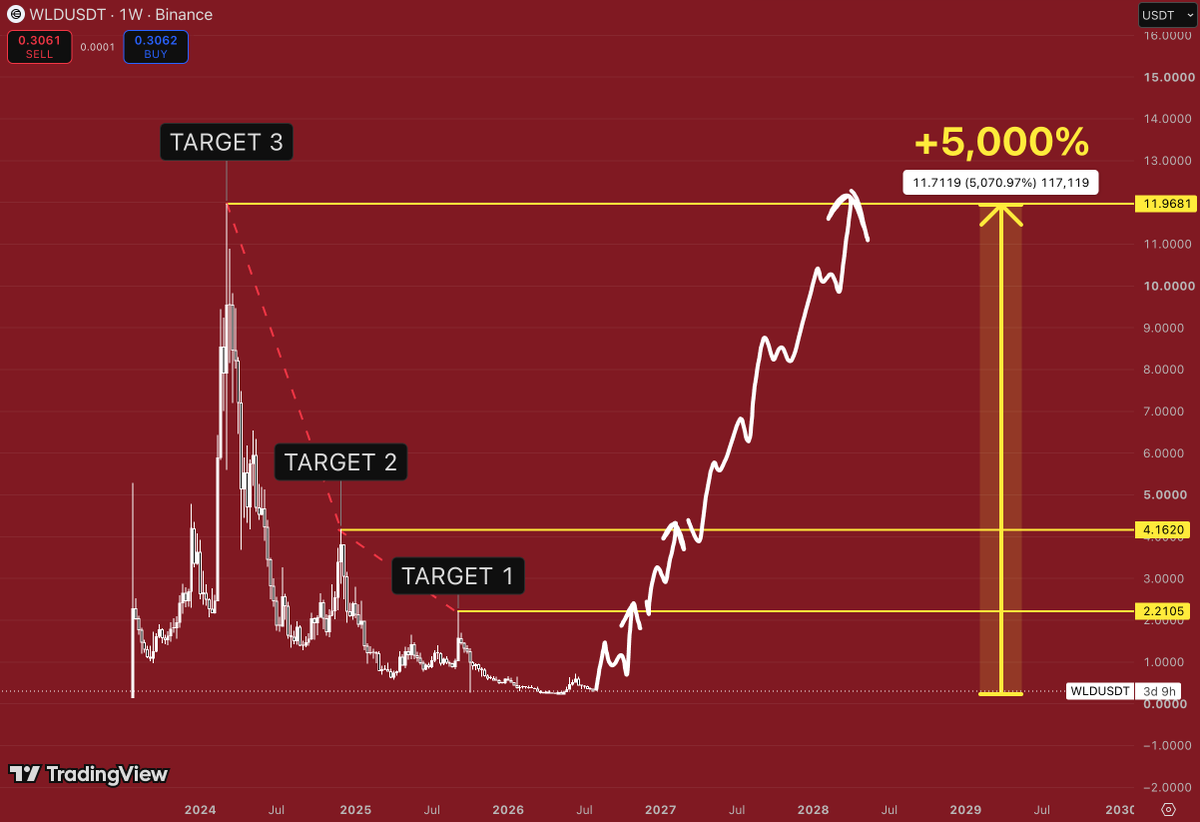
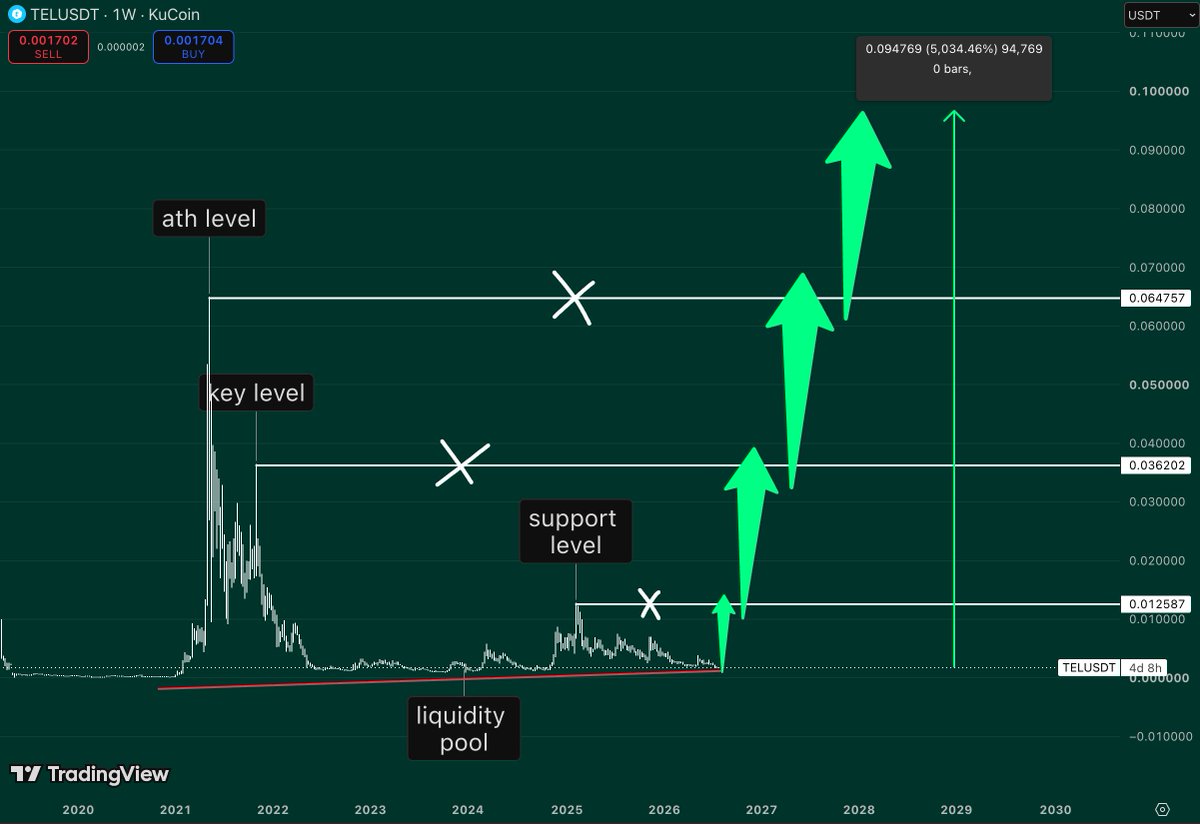
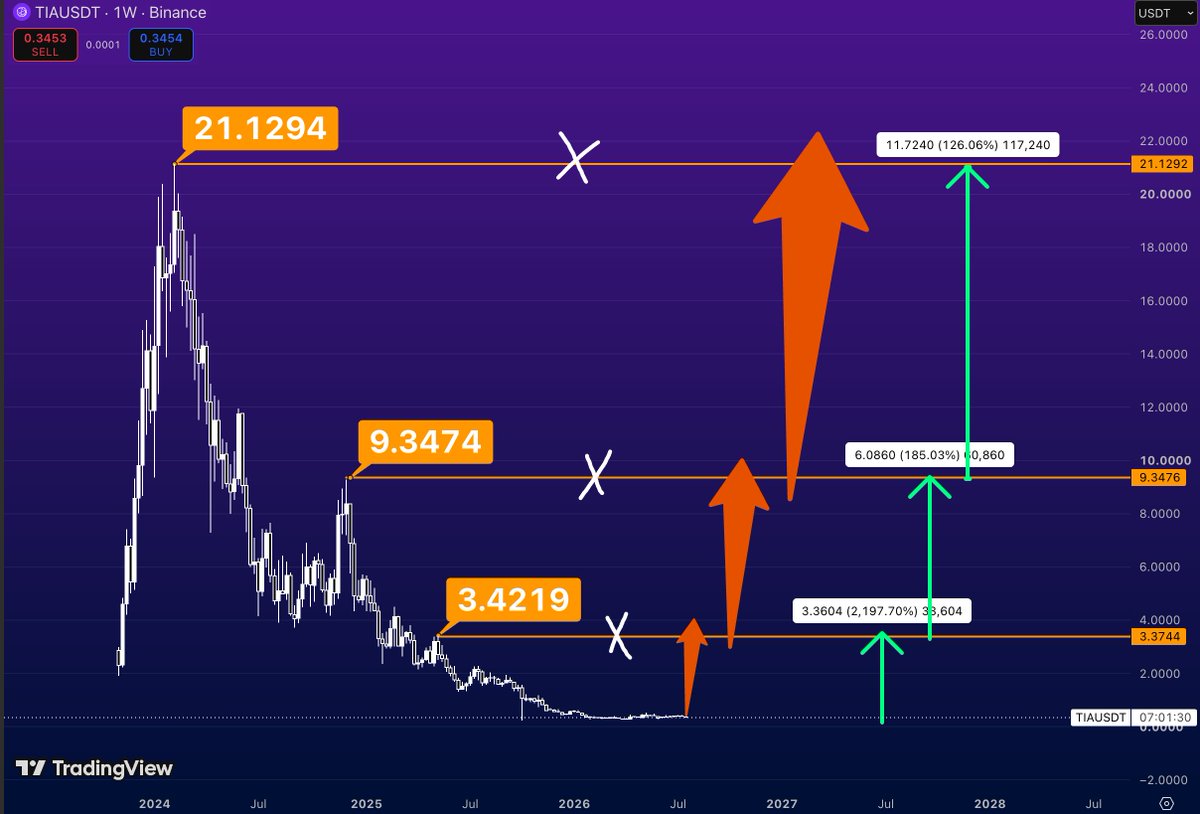
If $SUI can reclaim the first major resistance…
Momentum changes.
If it reclaims the second…
The conversation changes.
And if it starts trading above the previous ATH…
The narrative changes completely.
That’s usually when people convince themselves it was “obvious.”
It never feels obvious at the bottom.
It only feels obvious after a 500% move.
That’s why the best opportunities almost always feel uncomfortable when they first appear.
I’m not interested in chasing green candles.
I’m interested in charts that everyone else has already forgotten.
English