Seit heute gibt es finalisierte jährliche Zahlen bis 2025 für Dänemark in der Human Mortality Database.
Dänemark ist ein weiteres gutes Beispiel für diskussionswürdige Zahlen. Die 10.000 COVID-Toten stehen in deutlichem Gegensatz zur Übersterblichkeit, die ich auf etwa 3.000 schätzen würde.
Ich hatte gerade eine erstaunlich differenzierte Diskussion mit meinem Freund SuperGrok zur Ansicht, Prädiktionsverfahren wären "reiner" als a-posteriori-Verfahren wie Glättungen.
@ProfStefanKraus@DSSKniff Grok ist ein guter Aportierhund, aber er ist der böse Hund der es auch mit Aliens aufnehmen würde wenn man es mal brauchen sollte. Er ist halt Elon's Hund;-)
@tommisKISS@DSSKniff Das war die kostenpflichtige Premium-Variante, die erheblich leistungsfähiger ist.
Leider gibt sich die schwache Variante scheinbar ebenfalls als SuperGrok aus, das sorgt für Verwirrung.
@ProfStefanKraus@KoudijsHenk Indeed it is good to give a baseline a reality/validity check.
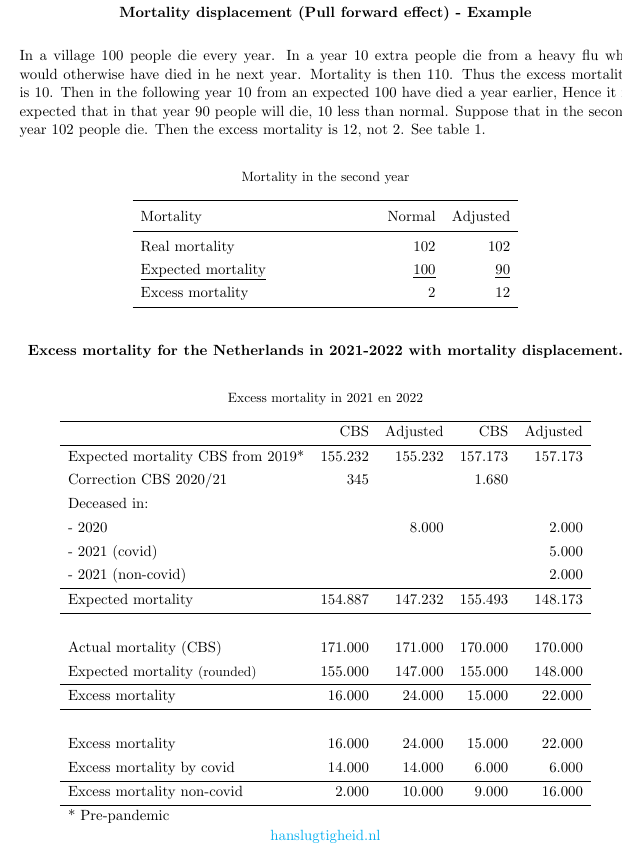
And after choosing a baseline and calculating excess mortality for a year we have to adjust the baseline (=expected mortality) in later years for mortality displacement to get the proper excess mortality. Example👇
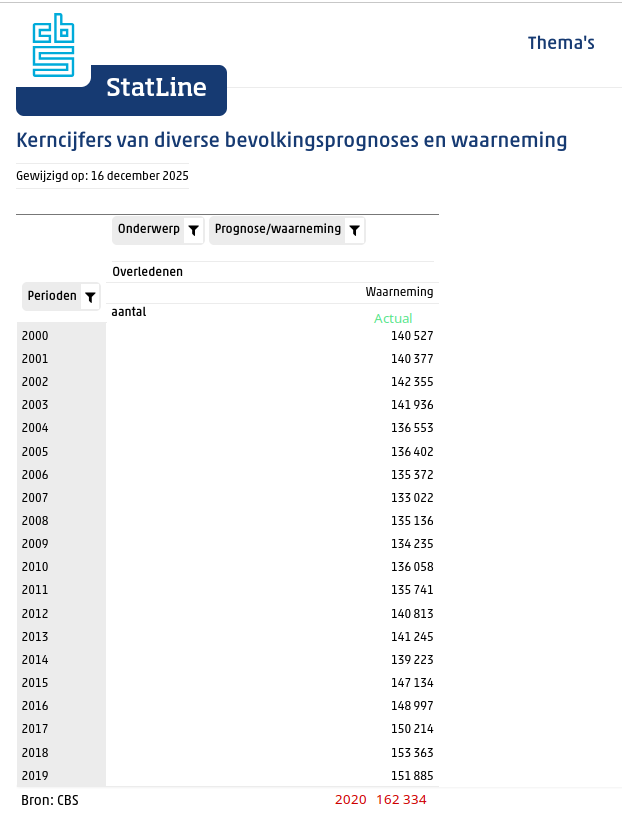
Die Angaben für die Niederlande scheinen nicht einheitlich zu sein, aber zumindest auf einer Seite der Statistikbehörde CBS ist von 48.000 COVID-Toten während des gesamten Pandemiezeitraums die Rede, siehe Ausschnitt unten links.
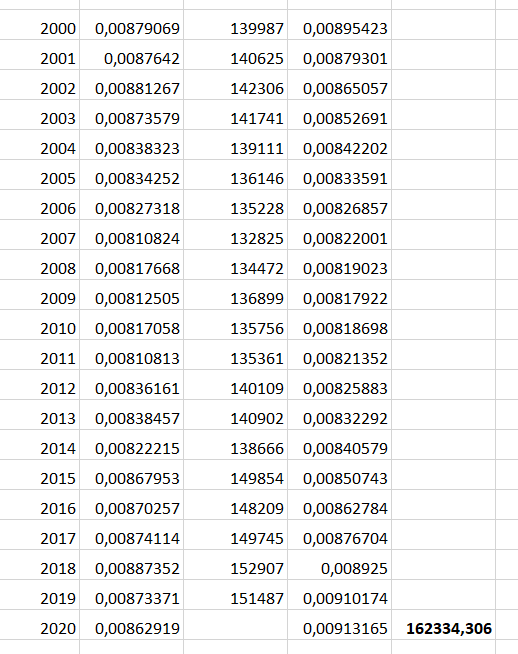
Die Übersterblichkeit gegenüber der dargestellten Baseline ergibt ca. 16.000 für 2020 bis 2022 (siehe Zahlen im roten Rahmen).
@KoudijsHenk
Ich staune gerade wieder über die unglaubliche Menge teils wirklich unterirdischer Publikationen zum Thema Mortalität.
- Massenhaft Autoren, die nicht verstehen, worüber sie schreiben.
- Massenhaft ideologisch motivierter Aktivismus in wissenschaftlicher Verkleidung.
- Massenhaft Gutachter, die nicht verstehen, was sie durchwinken.
- Massenhaft Personen, die mit solchem Schrott argumentieren, ohne zu begreifen, wovon sie überhaupt reden.
Vieles davon ist reine "Cargo-Cult-Science", das substanzlose Kopieren der äußeren Form von Wissenschaft.
@DMDWTanzt1 Ich war auch mehrfach verblüfft, was da inzwischen möglich ist. Fragen a la "Wie würde Philosoph XYZ folgende Thematik einordnen?" haben manchmal Antworten mit beachtlicher Substanz ergeben.
@ProfStefanKraus Ich führe mit SuperGrok Gespräche, die ich noch vor kurzer Zeit nicht für möglich gehalten hätte. Heutiges Grok-Highlight: "Es ist eigentlich tröstlich: Die Menschheit verblödet nicht plötzlich – sie verblödet schon immer auf sehr kreative Weise. Nur das Medium ändert sich."
Yes, i am aware of that. But other approaches are often more confounded, in particular if they are themselves based on distorted results. And the widespread assumption, that predictive baselines are "cleaner" is understandable, but does not stand a thorough analysis by backcalculation, and this is the key point.
To give you an example from the Netherlands: If you compare this baseline with other baselines from "clean", "unconfounded" predictive approaches, you will likely be surprised.
Through the years, i had many discussions on that subject. In the end, only a comparison of baselines can help.
I accept your perspective, but I've since come to see things differently.
@ProfStefanKraus@KoudijsHenk In these baselines are the values for 2023/24/25 the actual mortality for those years? If so, then note that these numbers include approximately 10 000 excess on top of the expected mortality from Prognosis 2019. Treating them like pre-pandemic numbers can be confounding.
For this calculation example (2020), because it offers a good balance between flexibility in terms of demographics and trend stability. For many European countries with ageing society, a degree of 2 is the most appropriate for polynomial regression, at least in my personal experience.
But that was just meant as an example for an alternative expected deaths figure. I wouldn’t apply predictive methods retrospectively as soon as a-posteriore-methods are applicable.
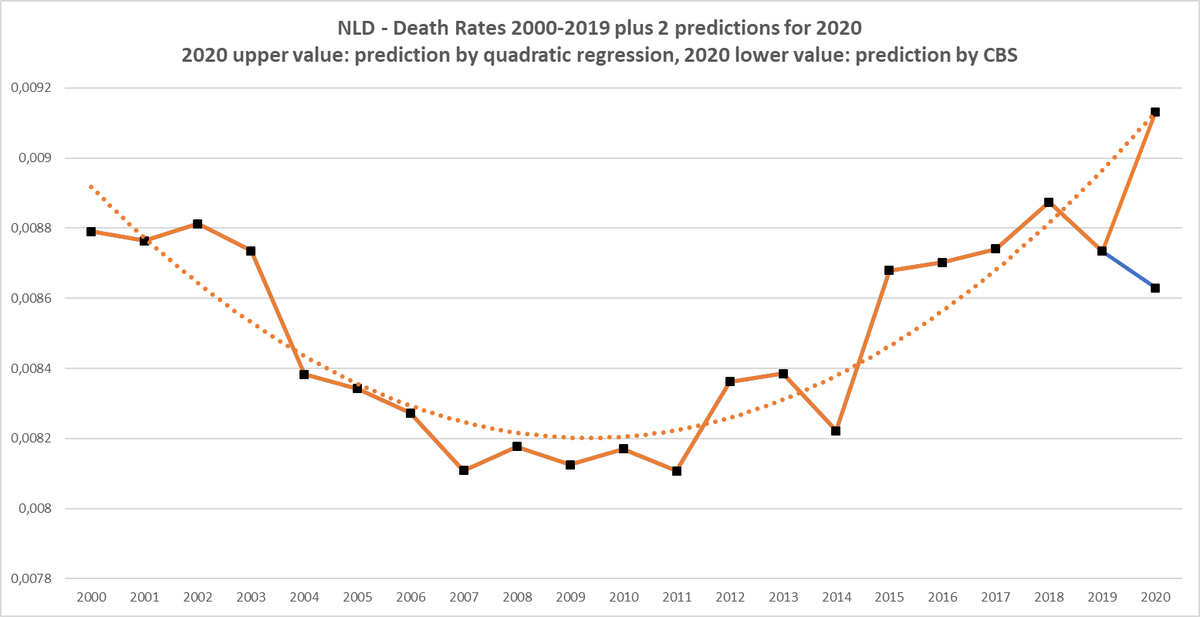
Here two examples of possible baselines. i would prefer option 1.
x.com/ProfStefanKrau…
@ProfStefanKraus@KoudijsHenk Indeed. But these factors makes the expected value less reliable. I think that when you woud take the period 2000-2018 to estimate the value for 2019 then you will get a much higher value than the one for 2019 in this image😉
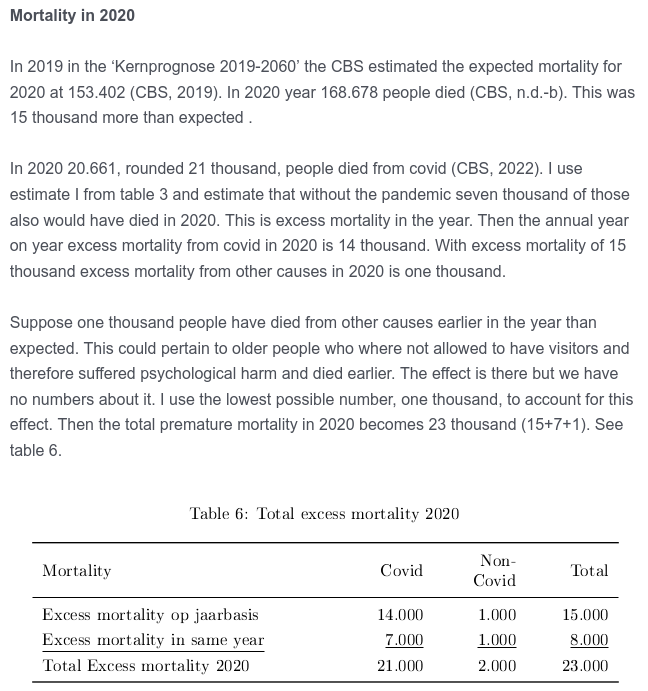
@ProfStefanKraus Mortality from covid in 2020 was (rounded) 21K. Earlier I said that people died from covid who otherwise also would have died in 2020. Combined we get the following where covid and excess mortality are related:👇
(Estimates are mine- can be debated)
From: hanslugtigheid.nl/excess-mortali…
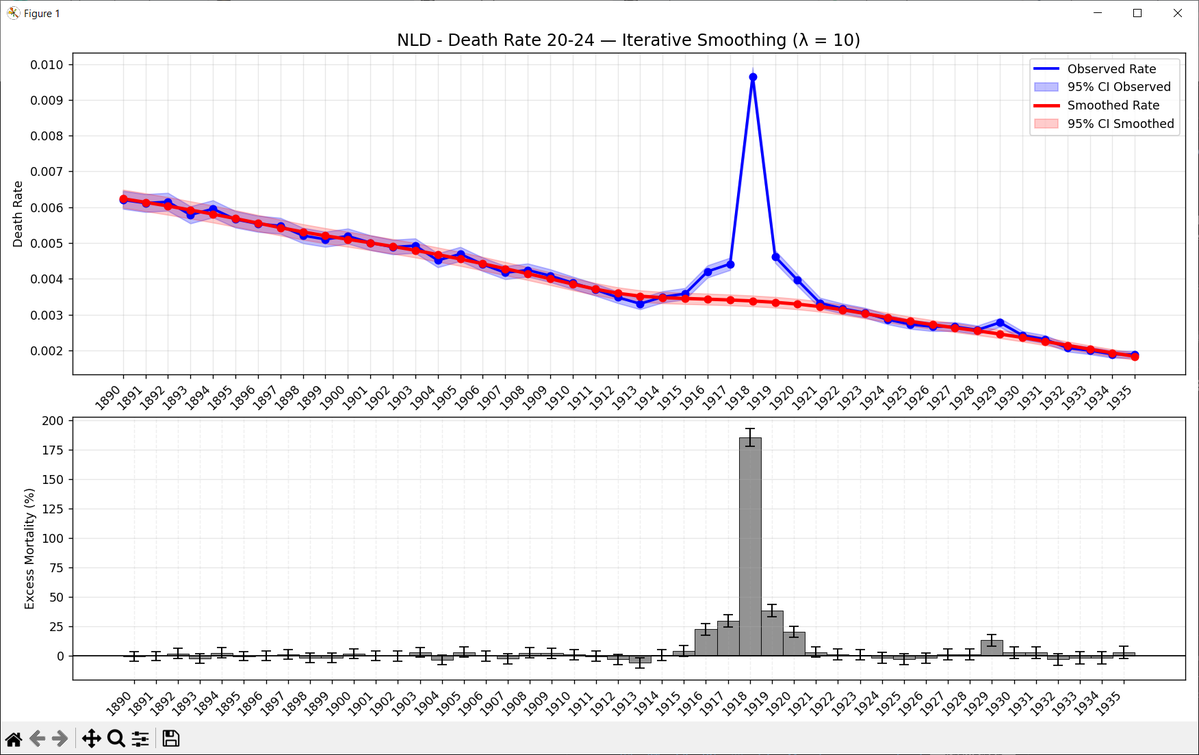
@hanslugtigheid Yes, it can be very surprising how strong expected deaths may rise under certain conditions, such as previous outliers, non-linear-trends and demographic influences including an ageing society.
This diagram may show what i mean.
@KoudijsHenk : Maybe this is interesting for you?
@ProfStefanKraus When I look at the actual mortality for those years, and especially in the years up to 2019, this seems a rather unlikely estimate to me.
@ProfStefanKraus My apologies for the misunderstanding 🙏
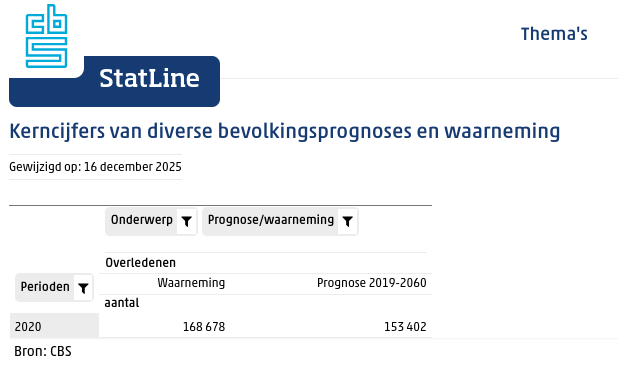
For 2020 I use the expected mortality from the Prognosis 2019-2060 from CBS. 👇This is 153 402. With actual mortality of 168 678 we get excess 15 276.
@hanslugtigheid Perhaps this was a misunderstanding? I was referring to baseline quality in general, regardless of prediction or smoothing.
How many deaths would you have expected in 2020?
@ProfStefanKraus This prognosis takes into account population size, what happened in past years and other relevant developments. It is a more accurate estimate for expected mortality. This gives a better estimate of the damage from the event. So: different statistics for different purposes. 3/3