
Mkpuruoma 💜
74 posts

Mkpuruoma 💜
@RFavvie
Agricultural Economist|| Data Analyst|| SQL, Spreadsheets and Stories Building ✨ Learning ✨ Showing up✨
Katılım Ekim 2020
31 Takip Edilen6 Takipçiler


English
This project deepened my understanding of Data cleaning, Power Query, Pivot Tables, and deriving insights from data. I’m looking forward to more complex datasets and analysis!
📢 Any feedback or tips? Let’s discuss! 🚀📊
#data #DataAnalytics #DataDriven
@Leoklems @lmtechub
English
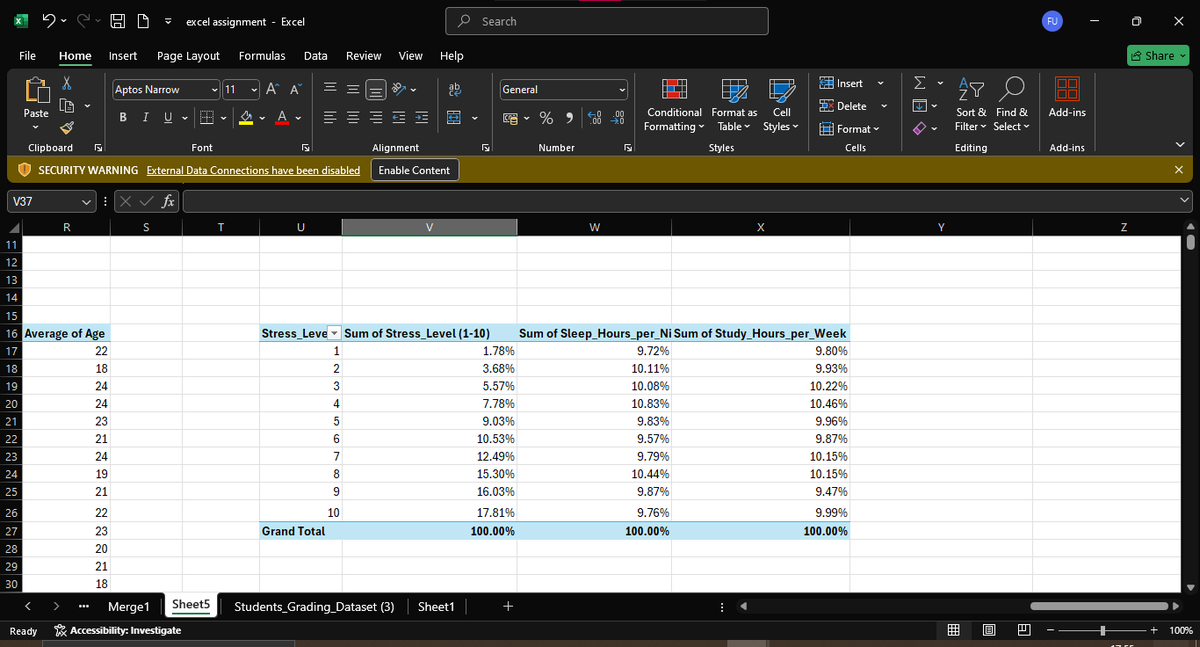
9️⃣ How Do Stress Levels Relate to Sleep & Study Hours?
Insights:
Most students have high stress levels (8-10).
Stress Level 10 is the most common (17.81%).
Students with Stress Level 4 sleep the most.
Higher stress doesn’t always reduce sleep significantly (~9.76%–9.87%).
English
📊Data Analysis Using Pivot Tables
Pivot Tables help summarize, organize, and analyze large datasets efficiently. This tool arranges it in rows and columns making it easier to identify patterns and trends. I would be using a Students grading dataset I already cleaned

English
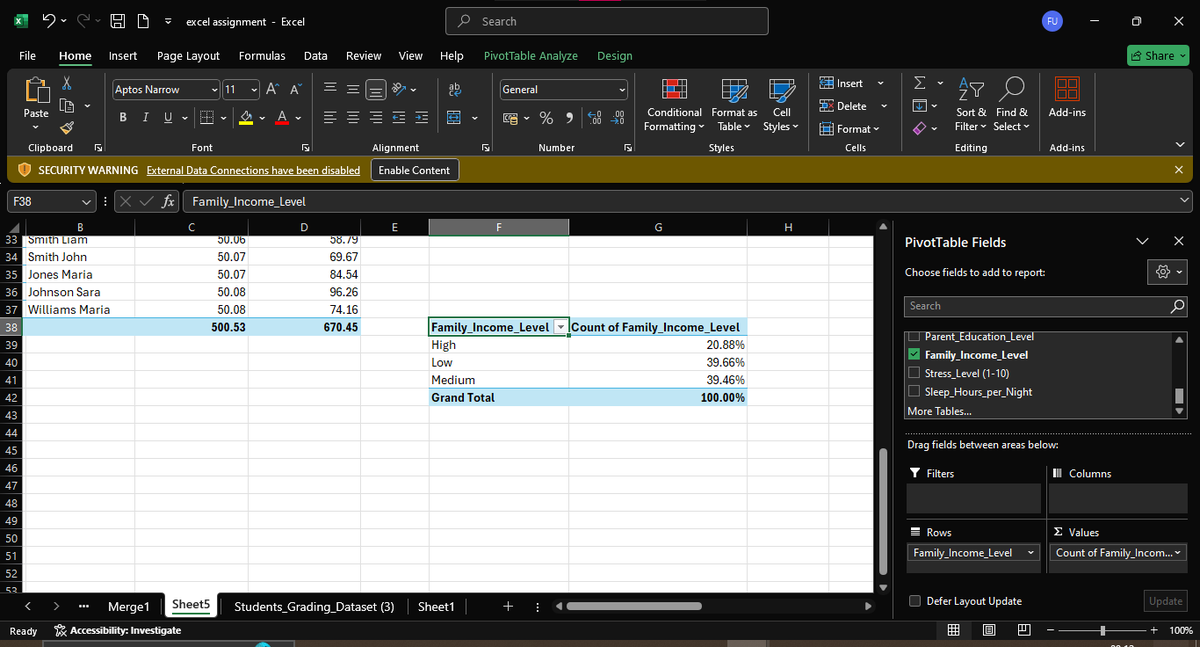
6⃣ Students' Family Income Levels
Insights: 39.66% of students come from low-income backgrounds
Only 20.88% come from high-income families.
Low & Medium-income students together make up 80% of the dataset. The majority of students may rely on scholarships or financial aid.
English
Data Analysis Using Pivot Tables
Pivot Tables help summarize, organize, and analyze large datasets efficiently. This tool quickly arranges it in rows and columns making it easier to identify patterns and trends.
English