Herman Trading

17K posts

Herman Trading banner
Herman Trading

Herman Trading

@RHerman

Global Stock & Futures Trading Insights | Analysis, Strategies & Edge Tools | FREE/PREMIUM Indicators | https://t.co/pruz2NQ6Tu | #NQ #Gold

Global Trading Insights Katılım Aralık 2017
247 Takip Edilen10.3K Takipçiler
Sabitlenmiş Tweet
Herman Trading
Herman Trading@RHerman·
CPI DIDN’T GIVE ME A DIRECTION. THE DATA DID. Intelligent Balance showed 58% LONGS - not a guarantee, but a measurable edge. My CPI research (posted on X) shows the average initial manipulation is approximately 11.8 points. So I didn’t chase the first candle. I allowed for the statistical sweep, waited for confirmation, and executed the LONG. No prediction. No emotion. No gambling on the headline. Probability gave me the direction. Statistics gave me the breathing room. Confirmation gave me the entry. That is how I trade high-impact news: Direction first. Manipulation second. Execution third. Would you take a CPI trade with only 58% probability if the statistical manipulation model also supported the setup?
Herman Trading tweet media
English
2
0
9
1.4K
Herman Trading
Herman Trading@RHerman·
@Mizmania73 Amazing. Nice work riding the runner. Funded account vibes – that’s what it’s all about.
English
0
0
0
20
Miz mania
Miz mania@Mizmania73·
@RHerman Took the My map trade in deep discount... Left the runner to cpi. Stops were in a comfortable place. One of your apex codes was used. Now funded.
English
1
0
1
29
Herman Trading
Herman Trading@RHerman·
CPI DIDN’T GIVE ME A DIRECTION. THE DATA DID. Intelligent Balance showed 58% LONGS - not a guarantee, but a measurable edge. My CPI research (posted on X) shows the average initial manipulation is approximately 11.8 points. So I didn’t chase the first candle. I allowed for the statistical sweep, waited for confirmation, and executed the LONG. No prediction. No emotion. No gambling on the headline. Probability gave me the direction. Statistics gave me the breathing room. Confirmation gave me the entry. That is how I trade high-impact news: Direction first. Manipulation second. Execution third. Would you take a CPI trade with only 58% probability if the statistical manipulation model also supported the setup?
Herman Trading tweet media
English
2
0
9
1.4K
Herman Trading
Herman Trading@RHerman·
@CurrencyMerch Been there where I skipped a setup to stay flat and it saved the week from turning into a revenge session.
English
0
0
0
75
The Currency Merchant
The Currency Merchant@CurrencyMerch·
Protecting capital is part of building wealth. Every decision doesn’t need to maximize upside. Some decisions are there to keep your process sustainable.
English
3
3
17
1.8K
Herman Trading
Herman Trading@RHerman·
@tradertheory Trade ALWAYS and OLNY towards the MORE probable % side. Trade entry mechanically with basic ICT concept like iFVG/CISD. That's all
English
0
0
0
164
Trader Theory
Trader Theory@tradertheory·
Describe your A+ trade setup in one sentence. No images allowed.
English
92
4
116
24.5K
Herman Trading
Herman Trading@RHerman·
@DenizTheTrader True for most, yet the edge in futures often comes from those extra hours others skip. The real game is knowing when the extra screen time actually adds edge versus just feeding the dopamine.
English
0
0
1
73
Deniz The Trader
Deniz The Trader@DenizTheTrader·
Take time to relax, have fun, and enjoy life. All the money in the world means nothing! if you don’t take the time to live...
English
31
6
84
2.6K
Herman Trading
Herman Trading@RHerman·
@tradermike1234 The peace only lasts until you scale up size. Once the dollar risk per scalp gets big enough the same quick trades start feeling heavy even if they are closed fast.
English
0
0
2
135
Trader Mike
Trader Mike@tradermike1234·
Nobody ever tells you this.. but scalping is the MOST peaceful trading style💯 iykyk ;)
English
22
2
144
8.6K
Herman Trading
Herman Trading@RHerman·
@I_Am_The_ICT At this point their sim accounts have more resurrections than a bad horror movie villain.
English
0
0
3
610
The Inner Circle Trader
The Inner Circle Trader@I_Am_The_ICT·
You tell some kids lost their sim accounts today and deflecting responsibility lmao
English
61
20
801
74.9K
Herman Trading
Herman Trading@RHerman·
@tradermike1234 That small base hit hitting exactly where it should feels so clean when the market's choppy like today.
English
0
0
3
94
Trader Mike
Trader Mike@tradermike1234·
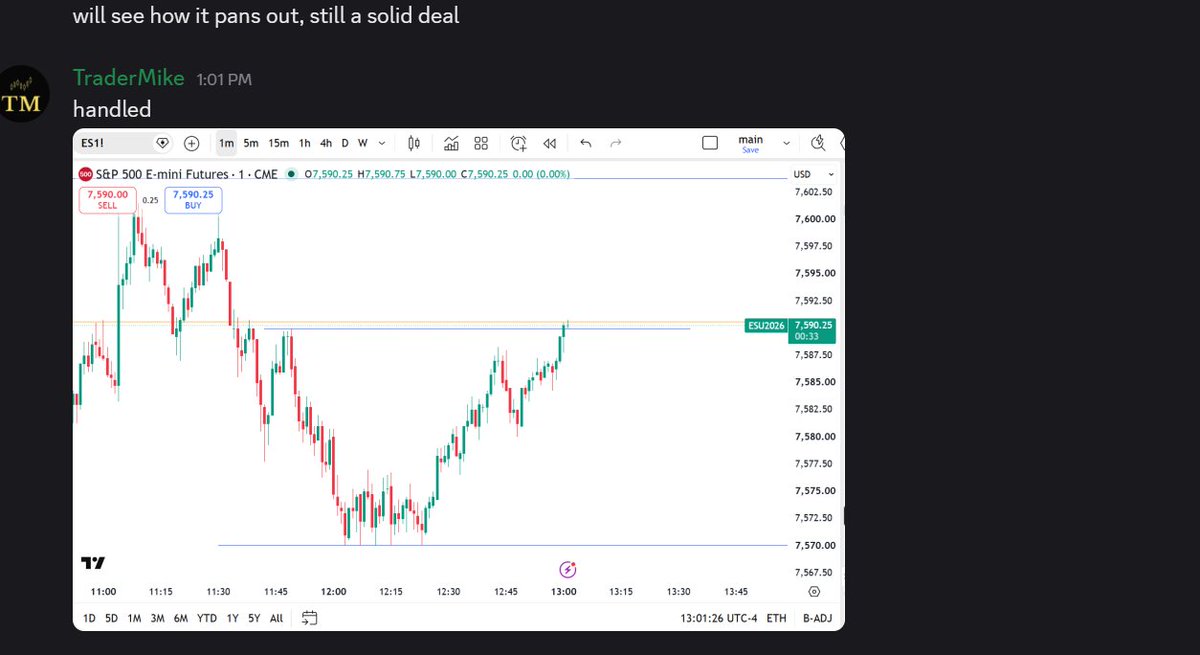
ES longs...HANDLED 🟩🤝 You see that? A small simple base hit like that consistently is enough to earn your freedom forever Less is more in this game. That doesn't just apply to patience ;) (plugged in 1% club💎 as always)👇 #TheStrat
Trader Mike tweet mediaTrader Mike tweet media
English
11
1
59
4.6K
Herman Trading
Herman Trading@RHerman·
@paxtrader777 Doing nothing in this market feels like being the only sober guy at a casino watching everyone else chase the slots 😅
English
1
0
12
530
PaxTrader777🇺🇸
PaxTrader777🇺🇸@paxtrader777·
The most difficult thing for most traders(at least for me) is to do nothing. To do nothing for a few days is hard. To do nothing for a week or 2 is harder. The ES is and has been telling me to not spend money in it. NQ has been the better of the indices. CL has been a good trade. Gold has been decent and bonds are ok.
English
46
9
271
15.6K
Herman Trading
Herman Trading@RHerman·
@AstiAlexandria You're welcome, Asti! Glad it resonated.If you're trading NQ, try marking that previous-week midpoint on your chart before Monday's open-it's been a reliable filter in the study.
English
0
0
0
23
Herman Trading
Herman Trading@RHerman·
Most NQ traders start the week looking for a bias. But one simple level predicted the first weekly target in more than 8 /10 cases. The Previous Week Midpoint. In my NQ study covering 2015–2025, when the new week opened inside the previous weekly range: → If price opened above the Previous Week Midpoint, Previous Week High was more likely to be taken first → If price opened below the midpoint, Previous Week Low was more likely to be taken first Accuracy: 81% No complicated model. No need to predict the entire weekly candle. Just one question before the week begins: Is NQ opening above or below last week’s midpoint? The midpoint is not a prediction. It is a probability filter for the week ahead. Source: Own NQ study Market: NQ futures Data range: J2015 - 2025 Condition: New week opens inside the Previous Week Range Do you mark the Previous Week Midpoint before Monday’s session begins? #NQ #FuturesTrading
Herman Trading tweet media
English
32
5
17
1.4K
Herman Trading
Herman Trading@RHerman·
@tradermike1234 What was the smallest daily habit that actually stuck for you once you got pissed and committed Mike?
English
0
0
3
135
Trader Mike
Trader Mike@tradermike1234·
Here is the dark truth about trading.. ☹️👇 It can beat you down without mercy for YEARS. Constant pain. Being misunderstood by friends and family. L after L after L. Blown account one after another. Pain that feels it never ends Then you look in the mirror. You get pissed. You decide it's time to get serious start being disciplined. You take self-accountability and in ONE YEAR...you can be financially free living your dream. It all starts with YOU. So fuckin start.
English
16
11
258
7.1K
Herman Trading
Herman Trading@RHerman·
@fx4_living Tomorrow the charts will still be there patiently waiting to screw us again, like an ex who knows we'll come crawling back 😅
English
1
0
3
129
F X 4 L I V I N G
F X 4 L I V I N G@fx4_living·
It’s honestly a good day to chill outside, not being screwed up by charts, tomorrow still gonna be there, let the >>gamblers<< do their business. 🤝🗣️
English
5
0
21
1.8K
Herman Trading
Herman Trading@RHerman·
@Wordsofrizdom Well said Riz. The real edge comes from treating every setup like a probability test rather than a must-win. I’ve seen that separate the guys who last versus the ones who blow up chasing perfection.
English
0
0
0
86
Riz Iqbal
Riz Iqbal@Wordsofrizdom·
Traders who burn out: • Chase profits every single day • Measure success by daily P&L • Let one red day define the week Traders who last: • Chase process every single day • Measure success by consistency • Let one red day teach them something
English
14
32
248
8.3K
Herman Trading
Herman Trading@RHerman·
@savant___ Thanks. Glad the stats were useful! Expect more gems like this one in the future.
English
0
0
0
24
cenk
cenk@savant___·
@RHerman A valuable idea worth considering. Thank you.
English
1
0
1
16
Herman Trading
Herman Trading@RHerman·
96% of CPI releases make a false move before revealing the real direction. I analysed 25 recent CPI events on NQ. Here are 10 statistics every CPI trader should understand: 1. The false move is almost guaranteed An overwhelming 96% of CPI events produced a manipulation sweep before committing to the true directional move. 2. Early entries need breathing room The average initial manipulation was 11.8 NQ points. Entering immediately with a tight stop means placing your risk directly inside the statistically expected sweep. 3. The 20-point danger zone Nearly one in three CPI releases moved at least 20 points against the initial release price. That means tight stops were statistically vulnerable approximately 32% of the time. 4. The largest recorded false sweep The worst manipulation reached 43 points in October 2024. That was approximately 3.6× larger than the dataset average. 5. High volatility can produce cleaner trends Counterintuitively, the most volatile releases sometimes delivered the cleanest directional moves. February 2025 produced a massive 261-point range after the initial manipulation. 6. Low volatility can be more dangerous CPI events with an opening range below 50 points frequently produced heavy, directionless chop. Less movement does not always mean less risk. 7. Small ranges can hide large manipulation On four separate CPI releases, the manipulation sweep consumed more than 50% of the entire opening range. What looked like a small reaction was mostly stop-hunting. 8. CPI volatility compressed by approximately 70% Average NQ movement fell from around 198.8 points per event in early 2025 to only 58.8 points in early 2026. The same CPI strategy cannot be traded with the same expectations forever. 9. Fat-tail risk is real Most sweeps were relatively small. But 4 of the 25 events produced extreme manipulation exceeding 20 points. Those rare events are the ones capable of destroying accounts. 10. Trading the first seconds is not an edge When a false move occurs 96% of the time, guessing the direction immediately after the release is not analysis. It is gambling. The objective is not to predict the first candle. The objective is to survive the manipulation, identify the real delivery, and trade only after confirmation. Would you still trade the initial CPI spike knowing these statistics?
Herman Trading tweet mediaHerman Trading tweet mediaHerman Trading tweet mediaHerman Trading tweet media
English
22
2
10
1.7K
Herman Trading
Herman Trading@RHerman·
@DekmarTrades Few interesting facts about CPI
Herman Trading@RHerman

96% of CPI releases make a false move before revealing the real direction. I analysed 25 recent CPI events on NQ. Here are 10 statistics every CPI trader should understand: 1. The false move is almost guaranteed An overwhelming 96% of CPI events produced a manipulation sweep before committing to the true directional move. 2. Early entries need breathing room The average initial manipulation was 11.8 NQ points. Entering immediately with a tight stop means placing your risk directly inside the statistically expected sweep. 3. The 20-point danger zone Nearly one in three CPI releases moved at least 20 points against the initial release price. That means tight stops were statistically vulnerable approximately 32% of the time. 4. The largest recorded false sweep The worst manipulation reached 43 points in October 2024. That was approximately 3.6× larger than the dataset average. 5. High volatility can produce cleaner trends Counterintuitively, the most volatile releases sometimes delivered the cleanest directional moves. February 2025 produced a massive 261-point range after the initial manipulation. 6. Low volatility can be more dangerous CPI events with an opening range below 50 points frequently produced heavy, directionless chop. Less movement does not always mean less risk. 7. Small ranges can hide large manipulation On four separate CPI releases, the manipulation sweep consumed more than 50% of the entire opening range. What looked like a small reaction was mostly stop-hunting. 8. CPI volatility compressed by approximately 70% Average NQ movement fell from around 198.8 points per event in early 2025 to only 58.8 points in early 2026. The same CPI strategy cannot be traded with the same expectations forever. 9. Fat-tail risk is real Most sweeps were relatively small. But 4 of the 25 events produced extreme manipulation exceeding 20 points. Those rare events are the ones capable of destroying accounts. 10. Trading the first seconds is not an edge When a false move occurs 96% of the time, guessing the direction immediately after the release is not analysis. It is gambling. The objective is not to predict the first candle. The objective is to survive the manipulation, identify the real delivery, and trade only after confirmation. Would you still trade the initial CPI spike knowing these statistics?

English
0
0
1
175
Sean Dekmar
Sean Dekmar@DekmarTrades·
CPI DATA IS RELEASED! AWESOME!
Sean Dekmar tweet media
English
2
2
7
5.1K
Herman Trading
Herman Trading@RHerman·
@The_ICT_mentor Thanks buddy. Much appreciated. I am a data freak, love my studies and statistics. More than happy when sharing them with the community.
English
0
0
1
50