Rambus Chartology

5.3K posts

Rambus Chartology banner
Rambus Chartology

Rambus Chartology

@RambusChart

Rambus Chartology - Since 2011 - THE Realtime Market Analyst & Chartist. Come Prosper With Us! Check us out on Substack or our website !

United States Katılım Aralık 2017
144 Takip Edilen1.7K Takipçiler
Rambus Chartology
Rambus Chartology@RambusChart·
The bear trap has sprung , just like I’ve been warning 🚨🚨 PM COMPLEX DOUBLE TOP IS PLAYING OUT AS EXPECTED: Last Friday, the H&S top on the right side of the larger double top reversal pattern completed when the breakout below the neckline took place. The left side of the double top took place when the smaller double top reversed the previous rally that had been in place since January 2025. Putting these two small reversal patterns together created the larger double top reversal pattern. What is so bearish for the intermediate term for the PM complex is the one-year parabolic rise that never ends well. 
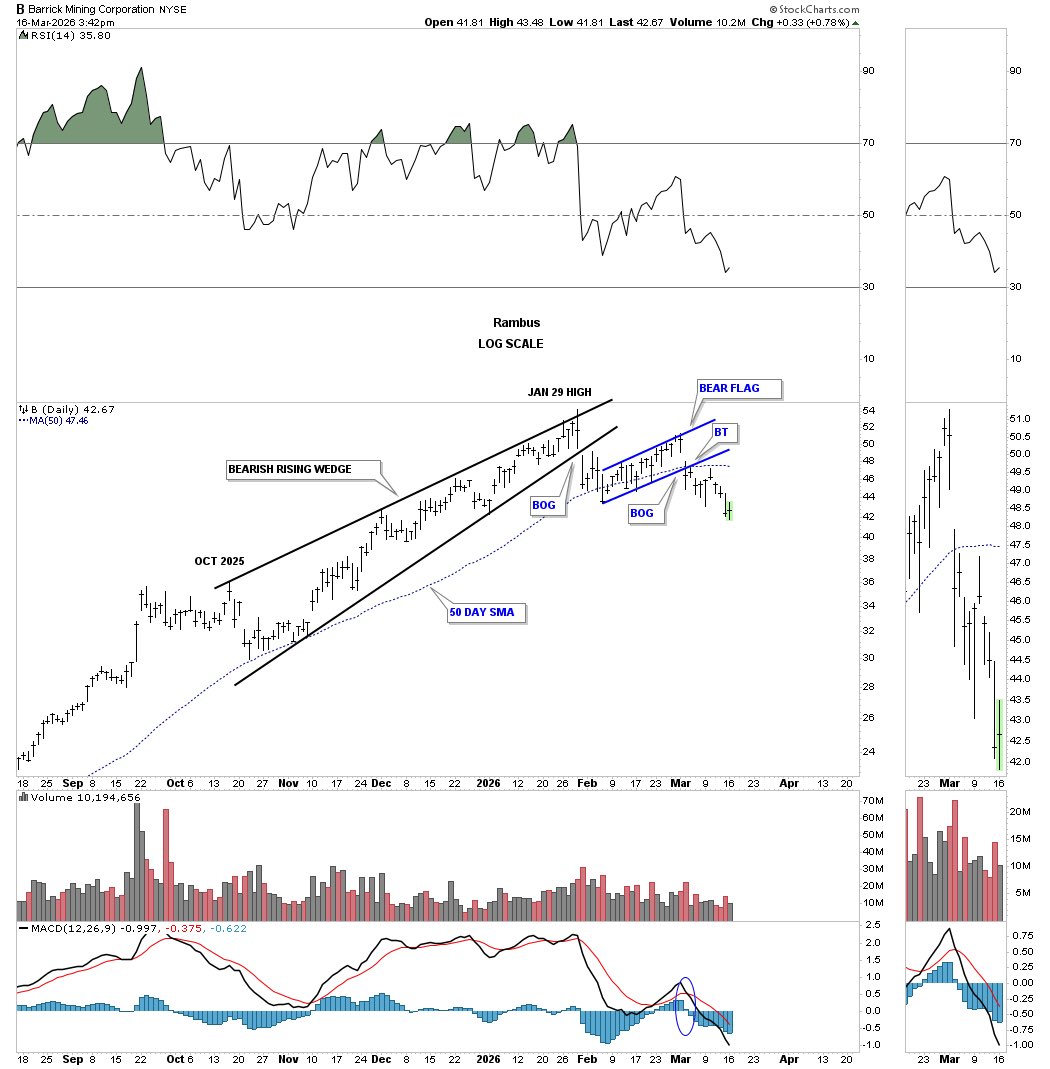
Yesterday, the price action gapped below the double top trend line, with some serious follow-through to the downside today. In my Wednesday Report last night, I showed many charts strongly suggesting the topping pattern was complete. I also talked about the game of psychological warfare, which is present in all markets. When everyone is extremely bullish, it’s hard to go against the herd, but that’s the nature of the game we choose to play. The bear trap has been sprung, which is going to trap a lot of PM stock investors, but Chartology gave us ample warning of what was to come. All the best…Rambus $HUI
Rambus Chartology tweet media
English
7
0
14
1.6K
Rambus Chartology
Rambus Chartology@RambusChart·
The Wednesday Report has been published 🛎️ In the Weekend Report, we looked at the first bit of confirmation that the intermediate-term top was in for the PM complex. Last Friday, the price action broke below the neckline of a H&S top, which was one of two reversal patterns. Today, we got the second confirmation signal that the intermediate-term top is in, with the breakout below the double top trend line, which now confirms the double top reversal pattern is complete. Today’s new lower low also confirms the new downtrend that has been in place since the micro double top at the all-time high. Before we look at tonight’s chart, I’d like to reaffirm something I’ve been saying for many years: “we are playing a game of psychological warfare more than anything else.” The PM complex pretty much topped out on January 29th of this year, which was a Friday. On the following Monday, February 2nd, I closed out all 20 of our PM stock trades as well as closing out all the trades in the Kamikaze Portfolio. To read this full article, follow the links below in the comment section and become a member. There is currently a 14-day free trial offer for Rambus on Substack. #PreciousMetals
Rambus Chartology tweet media
English
1
0
2
373
Rambus Chartology
Rambus Chartology@RambusChart·
I have made my latest weekend report public on Substack . While you're over there, check out the Spring Special that's currently running, and sign up for my 14-day trial offer. PM Complex: The Intermediate Term Top Is In 👀 Tonight, I would like to go over some charts to show how the PM complex may have completed an intermediate top that maybe the start of a large consolidation pattern I’ve been mentioning is possible. After a strong bull market rally, we need to see a reversal pattern form to reverse the trend from up to down. Last Friday, we seen the very first sign that a top of some importance completed. $HUI $SILVER $GOLD
Rambus Chartology tweet media
English
1
0
1
393
Rambus Chartology
Rambus Chartology@RambusChart·
Spring Forward with Rambus 🌱📈 This is my everyday hard work, brought to you from my desk in the Ozark Mountains. No fancy bells and whistles, just honest, in-depth technical analysis. I’ve been charting for over 35 years now, and I remain humbled by your support. I strive to keep you on the right side of the markets.✍️ Unlock market insights and analysis with our 14-day free trial, available only on Substack. Please note that this is a special that is only available on Substack and you must join through the Get 14 day free trial button . #StockMarketInvesting #TradingCommunity #TechnicalAnalysis Link in comment 👇
Rambus Chartology tweet media
English
1
1
2
452
Rambus Chartology
Rambus Chartology@RambusChart·
@patrickbrik If you do a ratio chart comparing B to gold you will see B has underperformed gold by 23% since the end of January of this year just over six weeks ago. One day doesn’t make a trend. All the best…Rambus
English
0
0
0
87
#iSeeKChRts
#iSeeKChRts@patrickbrik·
@RambusChart Barrick out performed good today. Combo chart of barrick versus gold doesn’t suggest an unhealthy stock. Guess it’s all just perspective
English
1
0
0
115
Rambus Chartology
Rambus Chartology@RambusChart·
$B Update 🚨 Just a quick update on Barrick Mining we’ve been following since the breakout gap below the bottom trend line on the 5-point black bearish rising wedge. After the initial move lower, B formed the blue bearish rising flag, which also broke out below the bottom blue trend line with a breakout gap and has been making a series of lower highs and lower lows. So far, from the January 29th high, which is where most of the precious metals stock indexes put in their initial high, B has declined 23%. From a Chartology perspective, this is not a healthy looking chart for B. All the best…Rambus
Rambus Chartology tweet media
English
4
1
13
1.7K
Rambus Chartology
Rambus Chartology@RambusChart·
@imapedestrian From the January 2025 low B gained 270% to the most recent high at the end of January of this year. Not too bad for a one year run. After a rally of that magnitude a pause to refresh to consolidate those gains would be heathy for the longer term. All the best…Rambus
English
0
0
0
103
Rambus Chartology
Rambus Chartology@RambusChart·
It’s sad in one respect but we just lived through one of the greatest bull market rallies in the history of the PM complex which is a once in a lifetime event. I don’t believe the secular bull market is over yet but a consolidation pattern of some magnitude is going to start forming that could take many months to a year or longer to complete. Taking some chips off the table after such a magnificent rally would seem like the prudent thing to do whether I’m proven right or wrong. All the best…Rambus
English
1
0
3
205
Rambus Chartology
Rambus Chartology@RambusChart·
I may get some negative responses from this post but I think you should read this 👇👇👇 HUI NEW PATTERN COMPLETING TODAY🚨🚨 In the Wednesday Report, I showed members of Rambus Chartology a new chart pattern that was developing but wasn’t quite complete. Today the new pattern is complete, which is not what most precious metals investors want to see because it’s a H&S top reversal pattern. What makes this particular H&S top so bearish is that it has formed at the all-time high after one of the greatest bull market rallies in history. After a backtest to the neckline, we should see the next leg lower. There is also a larger pattern that is forming, which some of you with charting skills may see. Always remember, we are playing a game of psychological warfare more than anything else. The PM complex just completed one of the most powerful bull market rallies since the 1980 top, while most analysts you read and see on YouTube keep calling for higher prices to the moon. The precious metals complex reached the moon on January 29th, a month and a half ago, and the PM complex is now much lower, failing to breakout into new all-time high territory. What is also telling us an important top is now in place is how the precious metals complex has reacted to the war in Iran by moving lower and not higher, which is very telling. Tops are made with euphoria and bottoms with investors in despair. All the best…Rambus $HUI
Rambus Chartology tweet media
English
6
4
14
2.1K
Gigi
Gigi@Geebers0806·
@eifers1 @RambusChart He saved me a lot of $$ Rambus , I can’t log into the discussion forum. Can you assistant email me
English
1
0
0
31
Rambus Chartology
Rambus Chartology@RambusChart·
@Ronnyponny2 You’re welcome. This is exactly why I do this . I’m glad to hear you’re learning some things.
English
0
0
1
21
Ullsokk
Ullsokk@Ronnyponny2·
@RambusChart Thank you for this post and the answers to the questions from people. Learning a lot from you! Being cautious at the moment.
English
1
0
1
39
Rambus Chartology
Rambus Chartology@RambusChart·
Barrick Mining: The PM Stock to Watch🚨👀 Barrick Mining is one of the largest big-cap precious metals stocks on the planet, and how it moves will usually have a direct impact on Precious Metals Stock Indexes. 🌎 $B topped on January 29th of this year along with many other PM stocks. It formed a bearish rising wedge with a breakout gap to the downside, signaling the pattern was complete. After the initial decline, the price action has formed the blue rising flag, which also experienced a breakout gap last week. Barrick Mining has been in backtest mode to the underside of the blue flag, where the 50-day SMA is also helping with resistance. A move to a new lower low will open the door for a larger decline. This is one PM stock to keep a close eye on. 👀👀 All the best…Rambus #BarrickGold #PreciousMetalsComplex #StockMarketToday
Rambus Chartology tweet media
English
6
1
15
1.5K
Gigi
Gigi@Geebers0806·
@RambusChart Hey Rambus I subscribed to your site but can’t log into The discussion forum n
English
1
0
0
60
Rambus Chartology
Rambus Chartology@RambusChart·
🚨🚨🚨🚨There is a new pattern that is beginning to show itself on the short-term combo charts for the PM complex, which I first became aware of late last week, which has to do with reverse symmetry. The pattern is not complete yet, but it’s beginning to mature with this week’s price action. The implication of this pattern could be very important for the intermediate term. PM Complex : A New Pattern is Emerging Read all about this in my latest article that has been published at Rambus Chartology. $HUI
Rambus Chartology tweet media
English
2
1
4
659
Rambus Chartology
Rambus Chartology@RambusChart·
A breakout gap doesn’t necessarily get filled right away. Note the gap made back in November, which is still open. I would be more concerned with that gap getting filled than the recent breakout gap, as that one could now get filled if the bearish rising wedge plays out. The minimum price objective for a bearish rising wedge is generally down to where the wedge began to form. All the best…Rambus
English
0
0
2
71
Rambus Chartology
Rambus Chartology@RambusChart·
An inflection point is just that an area on a chart where the price action can breakout in either direction. The PM stock indexes have been trading sideways since the January 29th high with no conformation yet of which way the current trading range is going to resolve. This is where patience comes in. All the best…Rambus
English
0
0
0
75
Gigi
Gigi@Geebers0806·
@RambusChart It’s funny , your inflection article thst you recently posted is open ended and does not give a clear direction - just an fyi
English
1
0
0
77
Rambus Chartology
Rambus Chartology@RambusChart·
Correct. As the price action rises, the swings between the lower and upper trends become narrower. In order to qualify as a bearish rising wedge, there needs to be a minimum of four reversal points. The rising wedge can also be a bearish rising wedge if the price action breaks out below the bottom trend line. Note the breakout gap below the bottom trend line, which was your clue the rising wedge was going to be a bearish rising wedge. Normally, after a breakout, you look for a backtest to the underside of the bottom trend line for more confirmation. The blue bear flag also shows a breakout gap, BOG, strongly suggesting the pattern is complete. Note on the 2nd day of the breakout, there was a quick backtest before the price action moved a bit lower before the blue bearish rising flag began to form. The 50-day simple moving average has nothing to do with the pattern, but can be another indication of resistance once it’s backtested from below along with the top rail of the blue flag. I hope this helps. All the best…Rambus
English
0
0
1
86
Lawrence H. Lefcort
Lawrence H. Lefcort@themindfulowl·
@RambusChart Thank you! Can you explain why it's a bearish rising wedge? Is it because it is narrowing as it rises? And why is it a bear flag? Is it because the price action is dipping below the SMA? Thank you for the clarifications!
English
1
0
0
95