🇦🇷📈 ATLÉTICO TUCUMÁN volvió a GANAR en condición de VISITANTE luego de 464 DÍAS:
❌ 0-2 vs. Central Córdoba.
❌ 1-3 vs. Rosario Central.
🟰 1-1 vs. Talleres.
❌ 0-1 vs. River Plate.
❌ 1-2 vs. Platense.
❌ 0-1 vs. San Lorenzo.
❌ 0-1 vs. Godoy Cruz.
❌ 0-1 vs. Deportivo Riestra.
🟰 2-2 vs. Sarmiento.
❌ 0-1 vs. Gimnasia La Plata.
❌ 0-2 vs. Newell’s.
❌ 1-3 vs. Vélez Sarsfield.
❌ 0-2 vs. Instituto.
❌ 0-3 vs. Independiente.
❌ 1-3 vs. Lanús.
❌ 1-2 vs. Independiente Rivadavia.
❌ 1-2 vs. Sarmiento.
❌ 1-2 vs. Instituto.
❌ 1-3 vs. Belgrano.
❌ 1-2 vs. Barracas Central.
❌ 1-2 vs. Rosario Central.
❌ 0-1 vs. Argentinos Juniors.
✅ 1-0 vs. River Plate.
🌐 Todos los registros estadísticos EN VIVO están en dataref.net
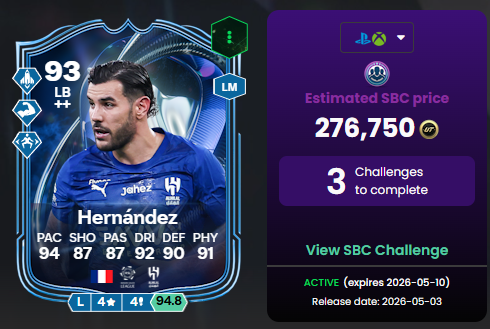
🚨THEO SBC o THEO EVO?🚨
💸El SBC cuesta 280k
💰La mejor evo de Theo cuesta en total 50k
⚓️La diferencia principal es que la evo tiene Intercept Plus en lugar de Jockey+
⭐️Además la evolución termina con 5 pierna mala
"Pero sin dinámica NO tiene Aura"
➡️Ahí la opción sería evolucionar su Thunder, pero esa carta cuesta 600k
🧬Cadena de evos para Theo:
1. Tie interceptor
2. Rapid Gains
3. Lightining Wingback
✅CONCLUSIÓN
- Si quieres lo más meta y no te importa la dinámica, haz la evo
- Si quieres una carta con dinámica y no quieres pagar tanto por un buen theo, NO el mejor, HAZ el SBC
$MA | Mastercard Q1 Earnings Highlights
🔹 Revenue: $8.4B (Est. $8.26B) 🟢; UP +16% YoY
🔹 Adj. EPS: $4.60 (Est. $4.39) 🟢; UP +23% YoY
🔹 Gross Dollar Volume: $2.7T; UP +7% YoY local currency
🔹 Purchase Volume: UP +9% YoY local currency
🔹 Cross-Border Volume: UP +13% YoY local currency
🔹 Switched Transactions: UP +9% YoY
Other Metrics:
🔹 Payment Network Revenue: UP +12% YoY; UP +8% currency-neutral
🔹 Value-Added Services & Solutions Revenue: UP +22% YoY; UP +18% currency-neutral
🔹 Payment Network Rebates & Incentives: UP +23% YoY; UP +19% currency-neutral
🔹 Mastercard & Maestro-Branded Cards: 3.7B
Financials:
🔹 Adjusted Operating Expenses: $3.3B; UP +11% YoY
🔹 Adjusted Operating Margin: 60.8%; UP +1.5 pts YoY
🔹 Adjusted Net Income: $4.1B; UP +20% YoY
🔹 Adjusted Effective Tax Rate: 19.2%
Capital Return:
🔹 Buybacks: Repurchased 7.8M shares for $4.0B in Q1
🔹 Dividend: Paid $777M in Q1
🔹 QTD Buybacks: Repurchased 3.3M shares for $1.7B through April 27
🔹 Authorization Remaining: $11.7B
Commentary:
🔸 “Mastercard is diversified, future-ready, and delivering.”
🔸 “In Q1, net revenue increased 16%, and value-added services and solutions grew 22% year over year — or 12% and 18% respectively on a currency-neutral basis.”
🔸 “We’re well positioned to capture the next wave of digital payments growth and continue to support secure commerce around the world.”
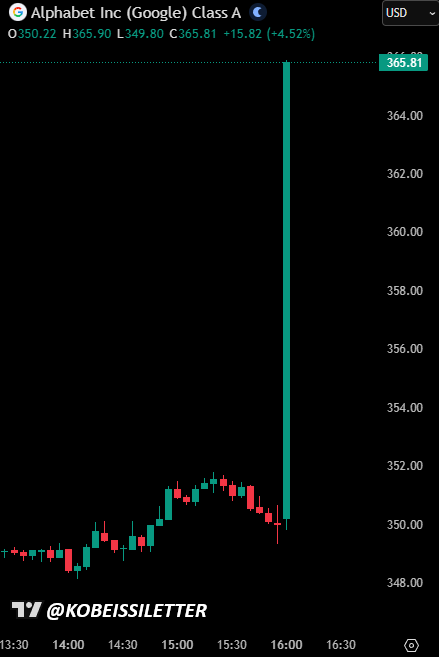
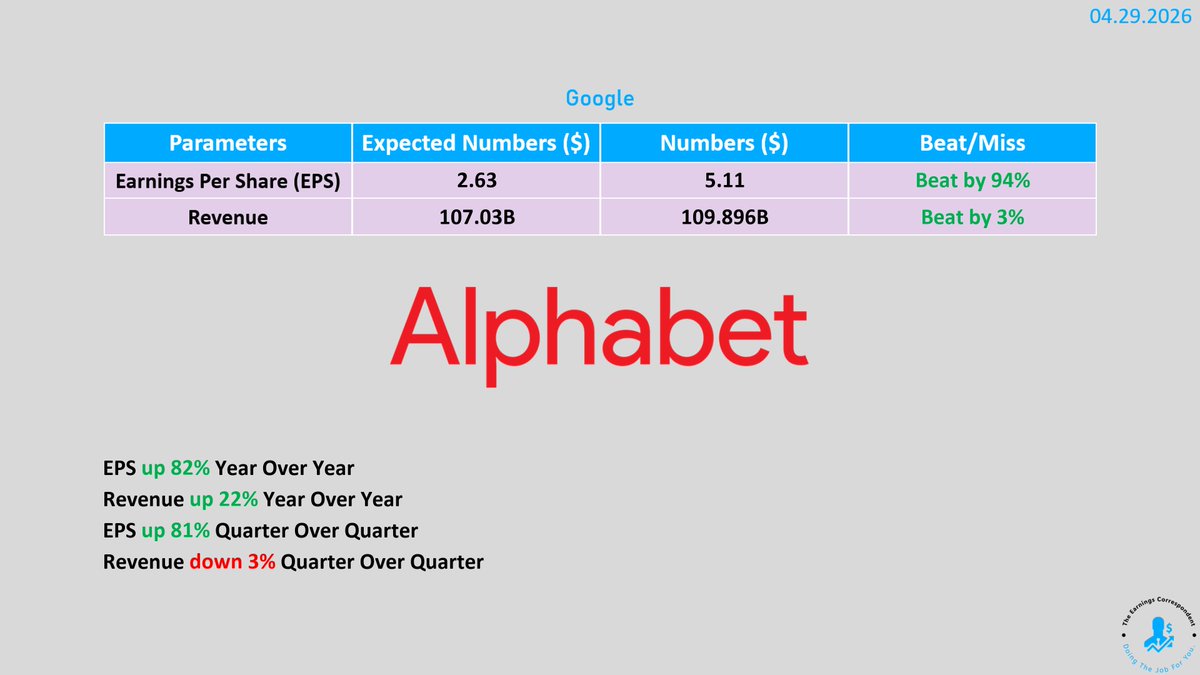
$GOOGL Q1 2026 earnings:
• Revenue $109.9B vs Est. $106.8B
• EPS $5.11 vs. Est. $2.67
Key metrics:
• Google Cloud Sales $20B vs Est. $18B
• Google Cloud Backlog: $460B (+63% YoY)
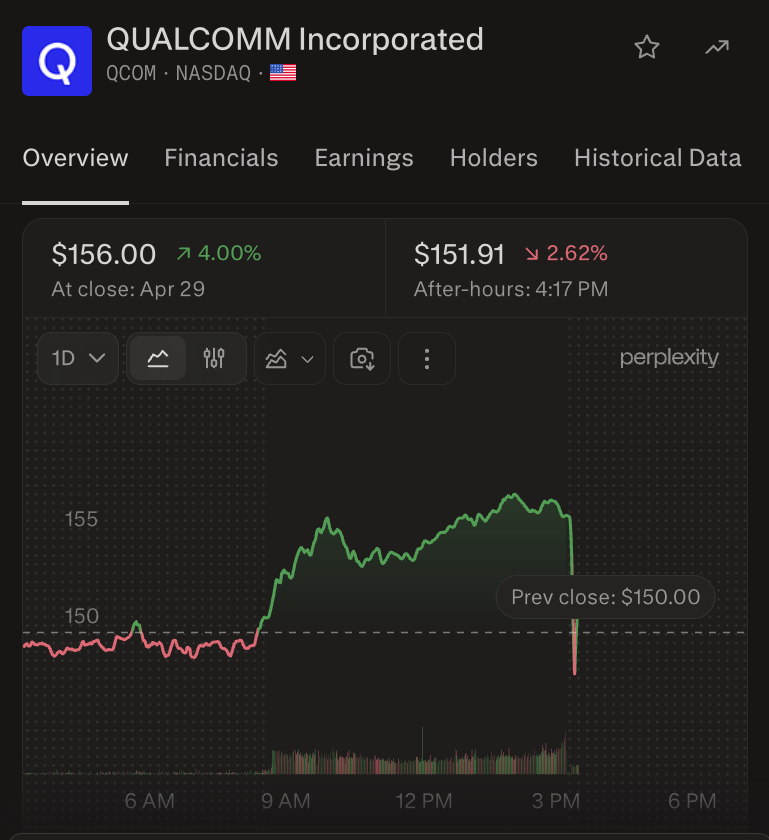
$QCOM Q2 FY26 EARNINGS HIGHLIGHTS
🔹 Revenue: $10.60B (Est. $10.56B) 🟢
🔹 Adj. EPS: $2.65 (Est. $2.55) 🟢
🔹 QCT Automotive: $1.33B; +38% y/y
🔹 QCT Automotive + IoT: +20% y/y
🔹 New Buyback Authorization: $20B
Q3 Guide:
🔹 Revenue: $9.2B-$10.0B (Est. $10.26B) 🔴
🔹 Adj. EPS: $2.10-$2.30 (Est. $2.43) 🔴
🔹 QCT Revenue: $7.9B-$8.5B
🔹 QTL Revenue: $1.15B-$1.35B
Segment Performance:
🔹 QCT Revenue: $9.08B; -4% y/y
🔹 Handsets Revenue: $6.02B; -13% y/y
🔹 Automotive Revenue: $1.33B; +38% y/y
🔹 IoT Revenue: $1.73B; +9% y/y
🔹 QTL Revenue: $1.38B; +5% y/y
Capital Return:
🔹 Q2 Capital Return: $3.7B
🔹 Buybacks: $2.8B through 19M shares
🔹 Dividends: $945M, or $0.89/share
🔹 1H FY26 Buybacks: $5.4B
🔹 New Authorization: $20B
Commentary:
🔸 “We are pleased to deliver results in line with our guidance, reflecting solid execution as we navigate a challenging memory environment.”
🔸 “We are in a period of profound industry transformation — the rise of AI agents is reshaping our roadmap across every platform we develop.”
🔸 “We are equally excited by our entry into the data center, where a leading hyperscaler custom silicon engagement is on track for initial shipments later this calendar year.”