Engr. Phillip PhD 👣@Rbtm_301
The "Red Folder" Gauntlet 🏛️📊
Been a minute since I dropped an update on X, but the macro landscape right now demands attention. If you are trading the technicals without understanding the fundamentals this month, you are providing exit liquidity for the institutions.
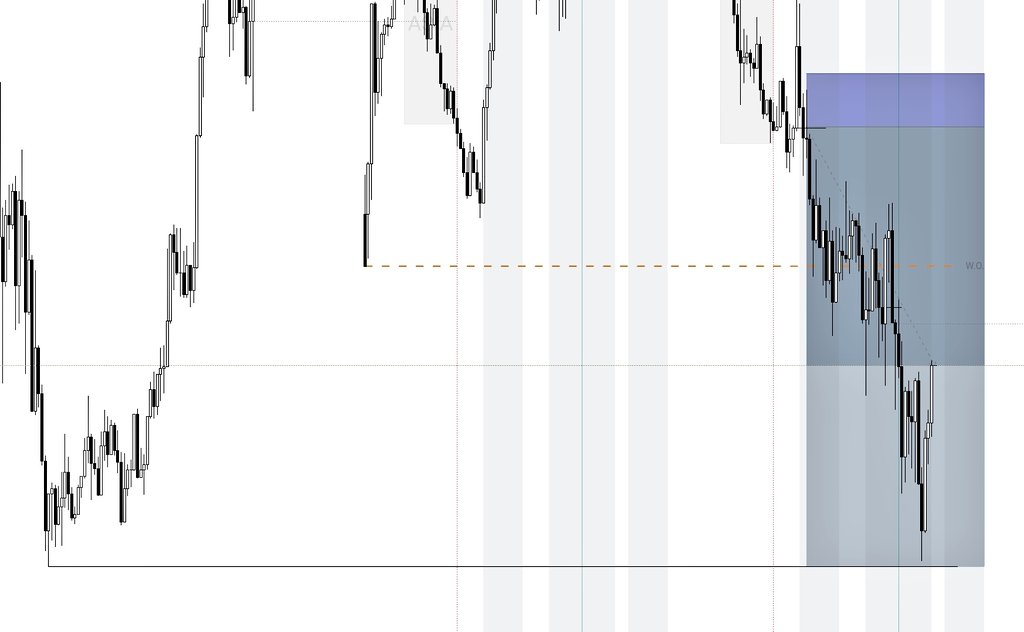
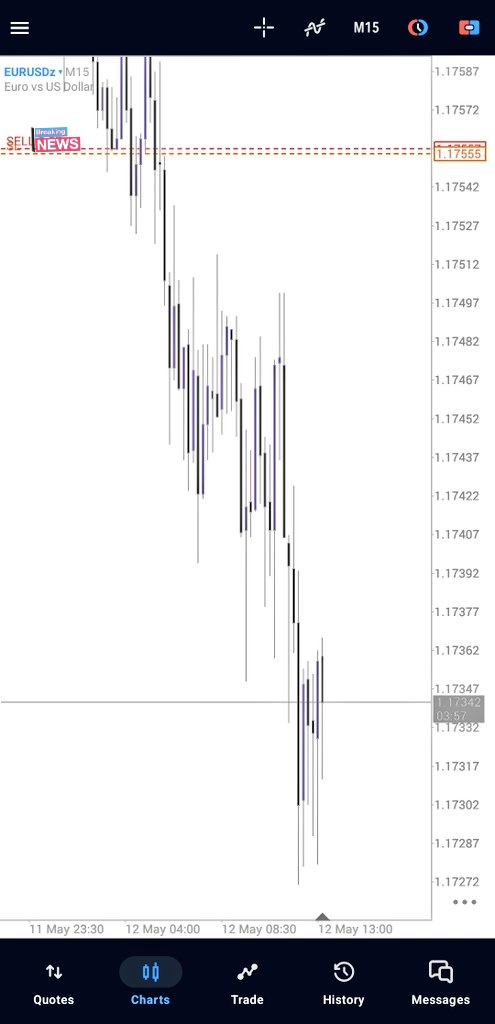
We just closed out a highly deceptive week, and we are walking straight into a "Red Folder" minefield. Here is the raw fundamental breakdown of what the "Smart Money" just did, and what we are positioning for next week.
Looking Back (May 4 - May 8): The NFP Trap & The Ceasefire Relief
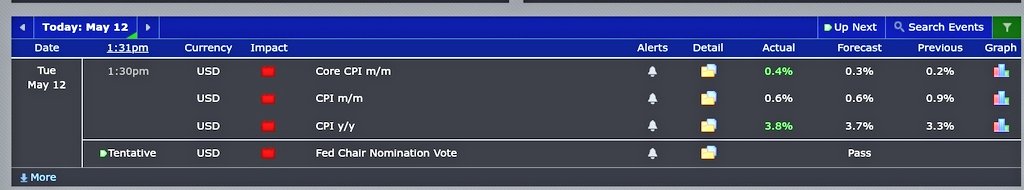
1. The NFP Shock: Friday’s US Jobs data (NFP) came in surprisingly hot (115k actual vs 60k expected). The US labor market is flat-out refusing to crack under 4.3% unemployment.
2. The $USD Divergence: Traditional logic says a hot NFP means a strong Dollar. But the $DXY actually bled down toward the 97.90 level. Why? Geopolitics. The US/Iran ceasefire framework in the Strait of Hormuz is holding. The "Safe-Haven" panic is over, and risk is officially back on.
The Asset Matrix: What to Watch Next Week (May 11 - 15)
Next week is the ultimate fundamental test. **Tuesday is US CPI (Inflation), Wednesday is US PPI, and Thursday is US Retail Sales.** Here is how the board is set up heading into Monday’s open:
🟡 1. GOLD ($XAUUSD)
The Current State: Caught in a massive tug-of-war. The weak Dollar gave Gold a pulse last week, but the strong NFP kept US Treasury yields elevated, capping any real rallies.
Next Week's Catalyst: Tuesday’s US CPI is the ultimate trigger. If inflation prints hot (above the 3.7% YoY forecast), bond yields will spike, and Gold will be flushed down to seek lower liquidity. If CPI cools, expect a violent squeeze upward. Do not front-run this data.
💻 2. NAS100
The Current State: The absolute winner of the ceasefire. With the "War Premium" in oil fading, Tech profit margins can breathe. The Nasdaq just surged to historic highs, completely ignoring the Fed's interest rate warnings.
Next Week's Catalyst: The trend is aggressively bullish, fueled by a strong earnings season. Do not step in front of this train trying to call the top. Look for 15-minute structural pullbacks to buy the dip, but watch Thursday's US Retail Sales closely—if the US consumer shows sudden weakness, Tech will pull back.
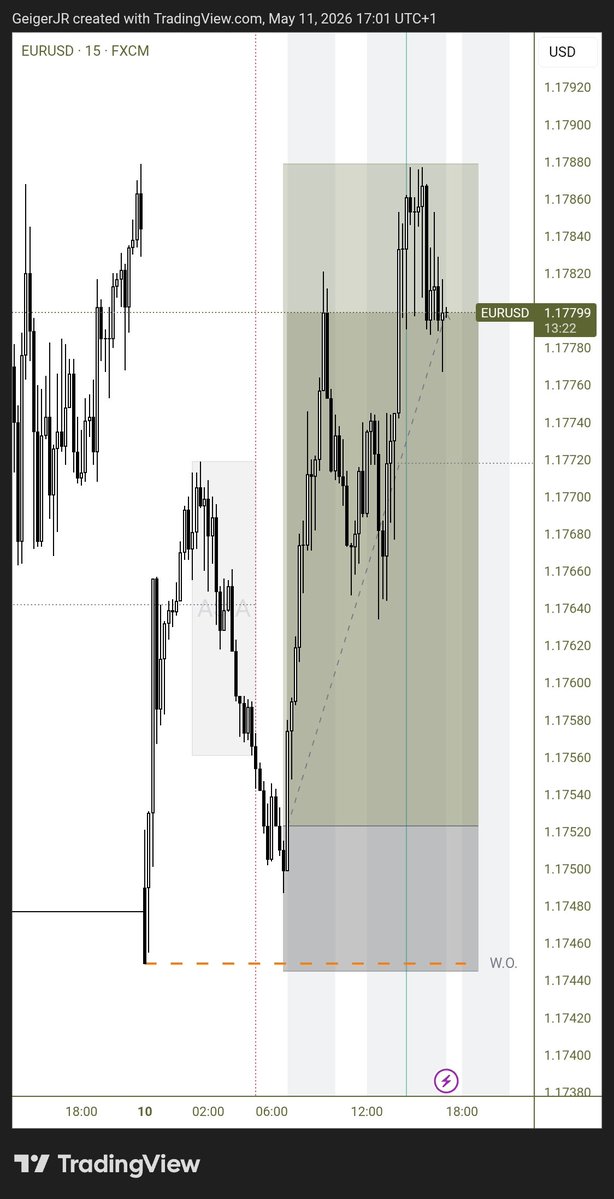
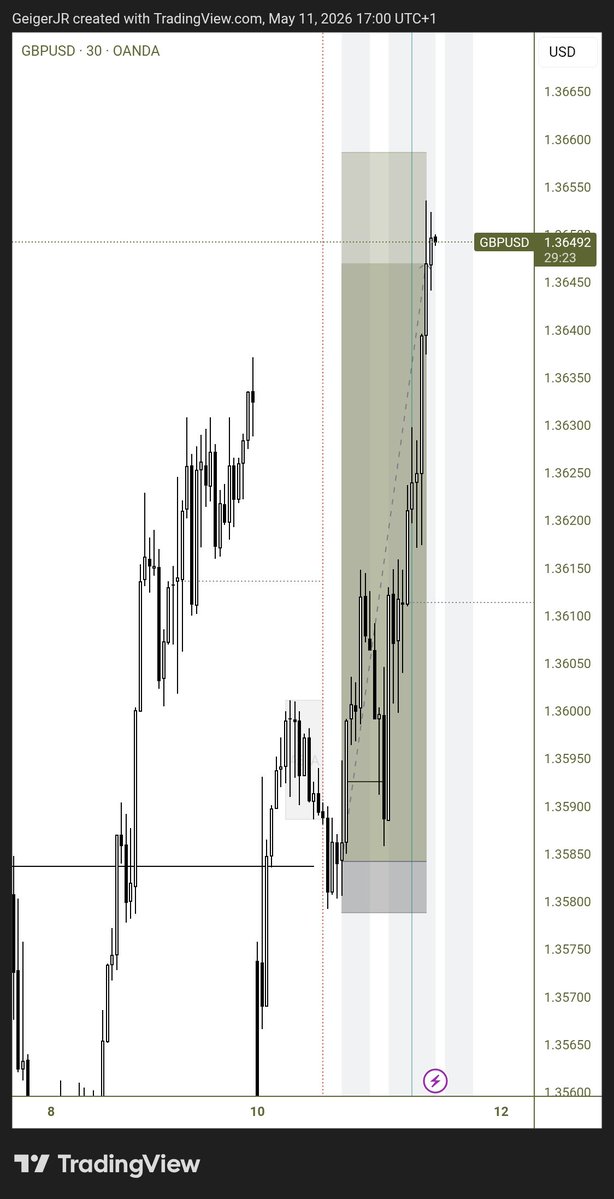
🇪🇺 3. EU (Fiber) & 🇬🇧 GU (Cable)
The Current State: The broad weakness in the US Dollar allowed the Fiber to push aggressively toward the 1.1800 resistance, while Cable caught a massive relief bid of its own.
Next Week's Catalyst: Both pairs are currently sitting at premium distribution levels. Tuesday’s US CPI will dictate the flow. If US inflation comes in hot, the Dollar will violently wake up, creating a massive short opportunity on EU and GU. If US inflation misses, that 1.1800 level on the Fiber breaks, and we hunt new multi-month highs.
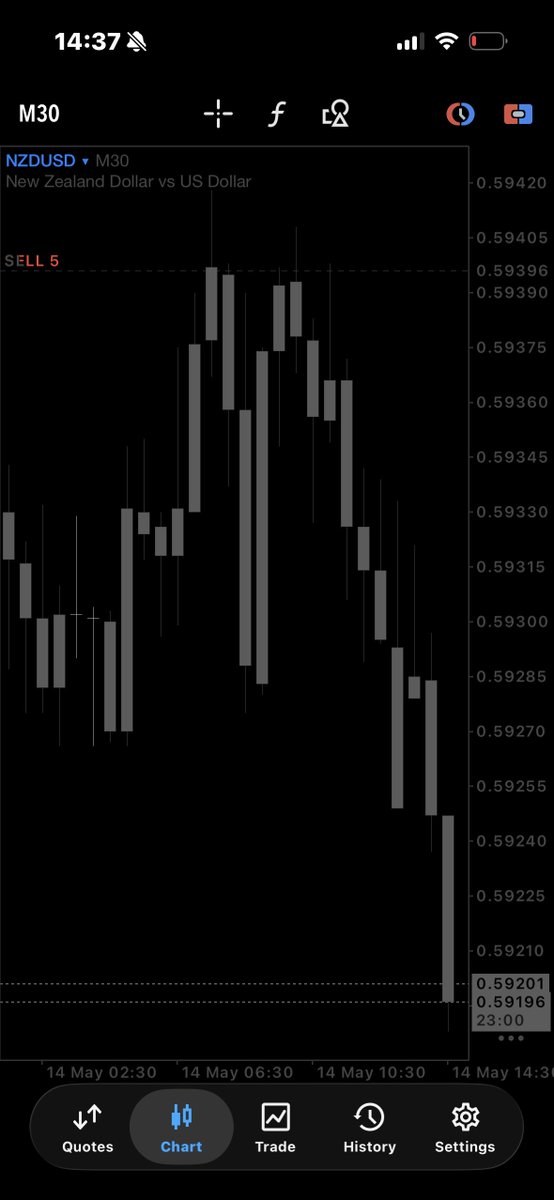
🍁 4. USDCAD (The Loonie)
The Current State: A dangerous fundamental divergence. Oil prices ($WTI) trimmed their gains last week because the Hormuz ceasefire is holding. Normally, falling oil destroys the CAD, but the US Dollar was so weak that USDCAD still pushed lower.
Next Week's Catalyst: This pair is a coiled spring. If Oil continues to drop next week AND Tuesday's US CPI comes in hot (strengthening the USD), USDCAD will violently reverse to the upside. Keep this pair on your primary watchlist.
The Bottom Line:
We have officially transitioned out of the geopolitical panic phase and are back to trading raw economic data. Tuesday’s CPI print will dictate the institutional flow for the entire month of May.
Protect your capital on Monday, wait for the data drops on Tuesday, and trade the institutional footprint. See you at the NY open. 🎯
#Forex #Macro #XAUUSD #NAS100 #EURUSD #GBPUSD #USDCAD #SmartMoney #DayTrading