

Reuben Fischer-Baum
626 posts

Reuben Fischer-Baum
@ReubenFB
Senior Data Editor @YahooNews. Previously @PostGraphics, @FiveThirtyEight, Deadspin (RIP.) 2021-22 Nieman fellow. I teach data visualization at RISD and Brown.
Providence, RI Katılım Şubat 2010
1K Takip Edilen3.7K Takipçiler

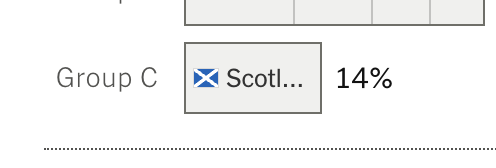
Scotland's chances of qualifying keep dropping — so much so that we don't even have space for their full name on our handy third-place qualification odds by group chart anymore.
#superuser=true" target="_blank" rel="nofollow noopener">nytimes.com/athletic/inter…
English
Plus plenty of well-polished implementations of more “standard” visualizations, like bubble scatters, small multiple time trends, and stacked areas.
dhan1004.github.io/flight-on-time/
lilangeluh.github.io/nba-narrative/
anna-murphy.github.io/DATA1500/
ciarameyer.github.io/data1500/

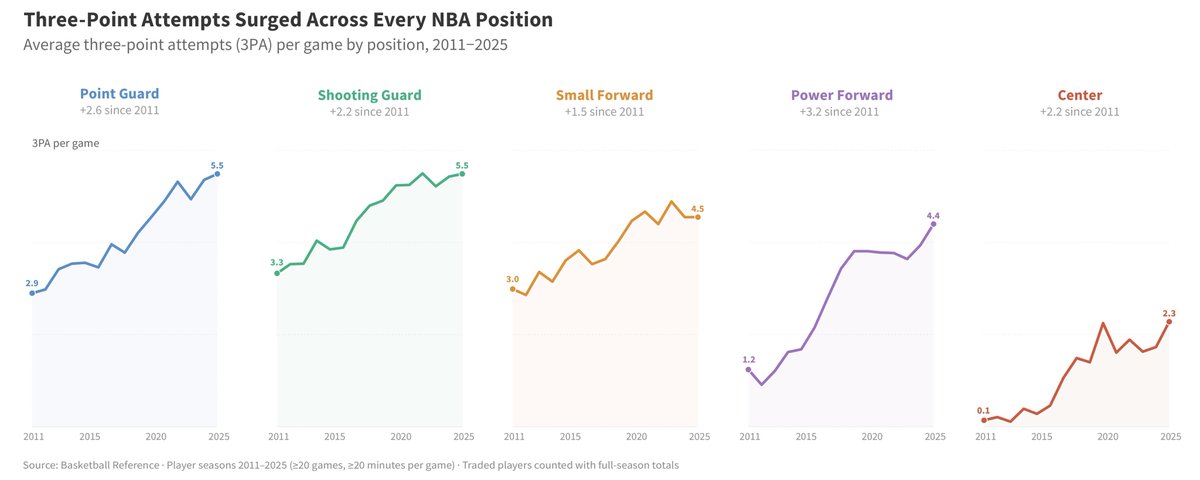

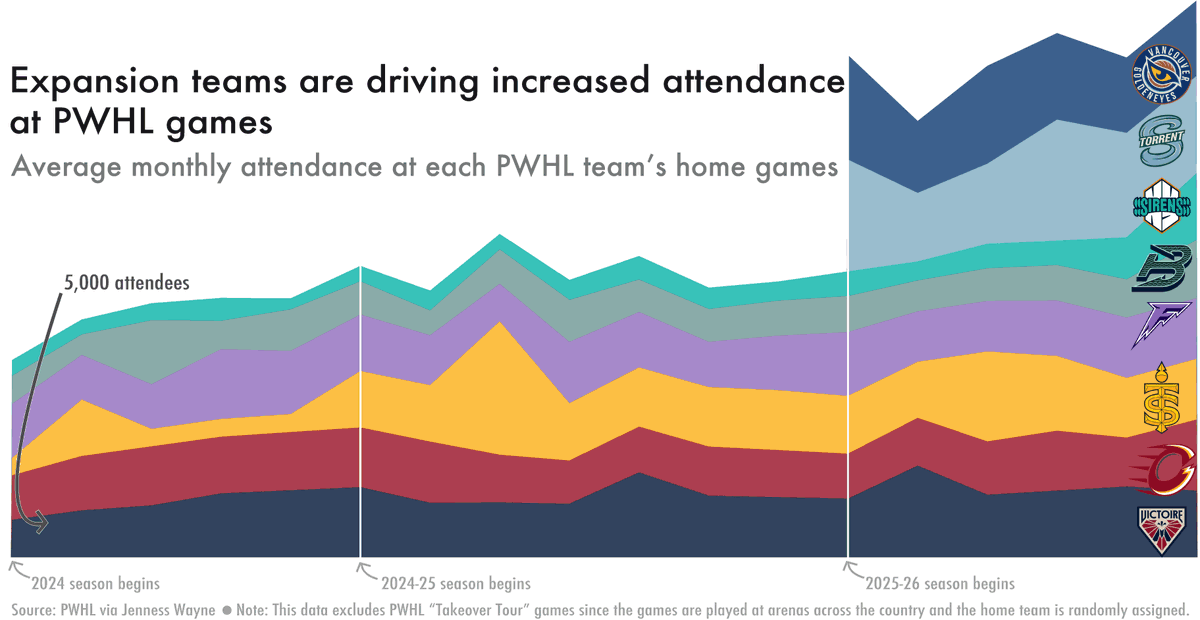
English
This creativity extended to mapping as well, including a bivariate choropleth(!) and a Spilhaus projection (!!).
awang1245.github.io/birder-watchin…
skylarwalters.github.io/whaling-in-ri/


English
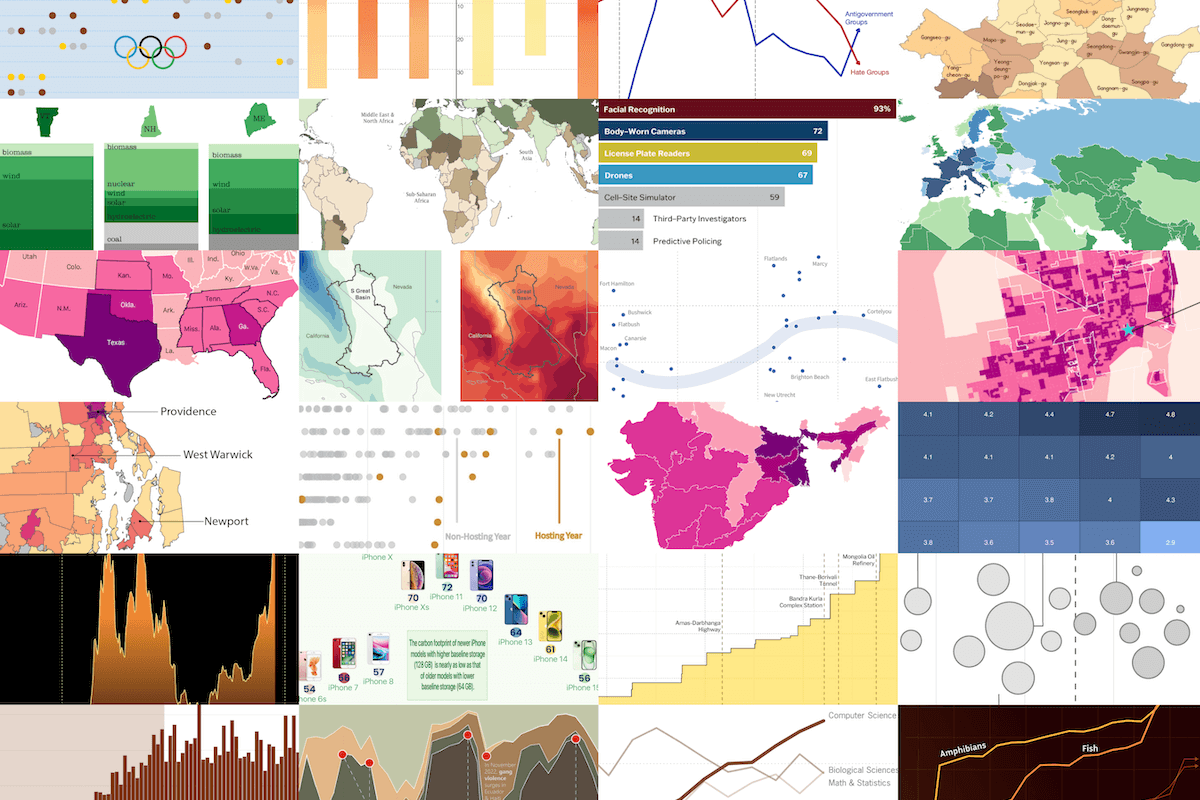
Just wrapped up another year teaching data viz to undergraduates and grad students at Brown! Threading a few favorites, but all 25 final narratives are worth a look. data1500.github.io/spring-2026/

English
Reuben Fischer-Baum retweetledi

Reuben Fischer-Baum retweetledi

If you're a reporter who has been laid off, know @PressClubDC is here for you.
We are offering a free, 3 month membership to those laid off this year.
The Club offers workspaces, private booths for phone calls and meetings, a gym, a library and a supportive community.
Link >
English
Reuben Fischer-Baum retweetledi

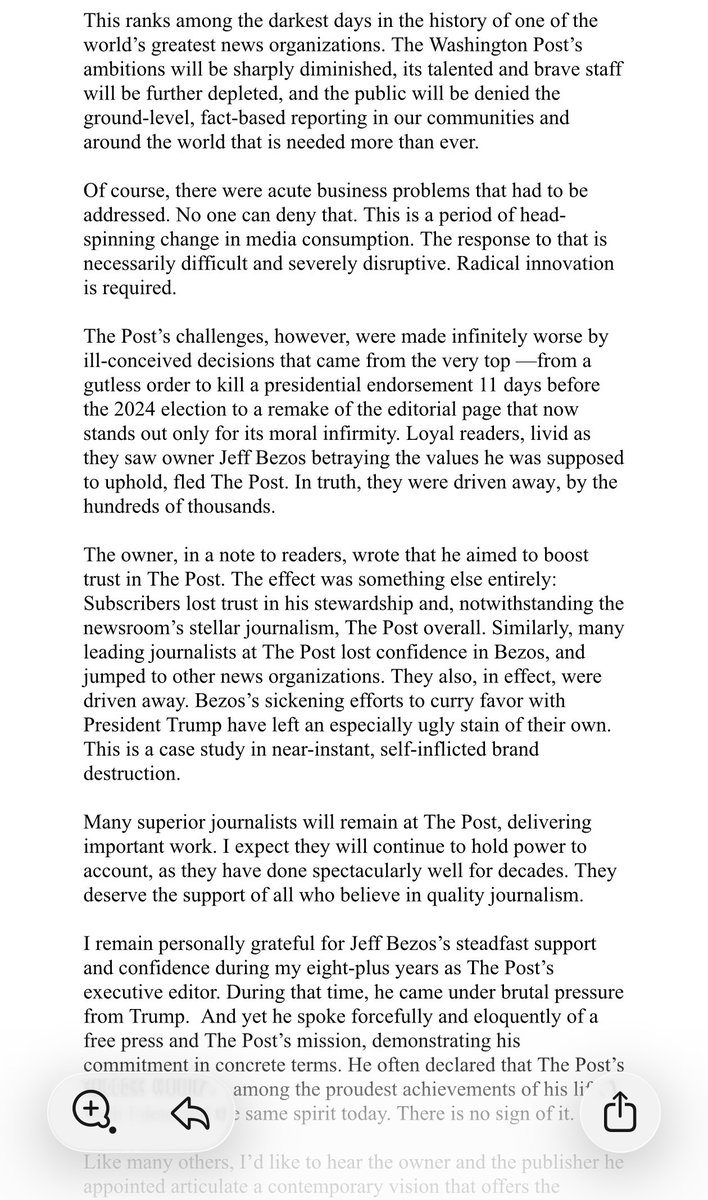
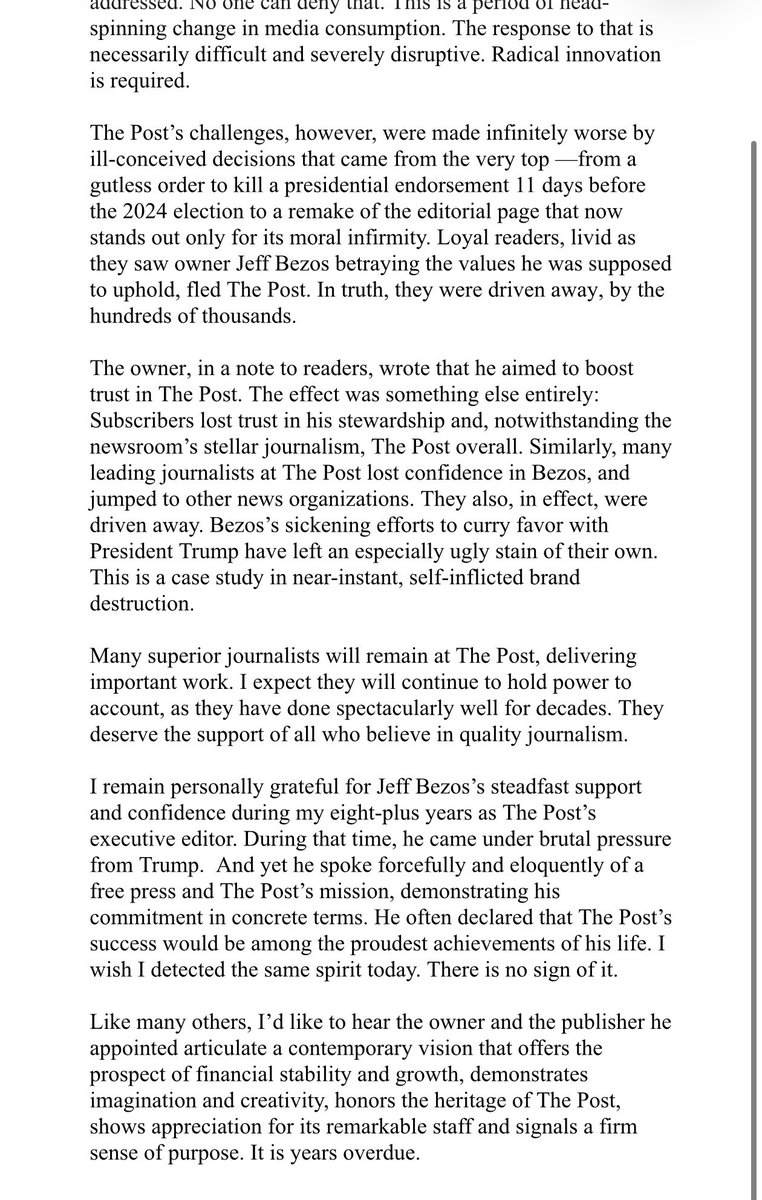
A staggering statement from former Washington Post editor Marty Baron: "This ranks among the darkest days in the history of one of the world's greatest news organizations."
English

After nearly eight years at The Washington Post, I’m on to something new. This week I started as the Senior Data Editor on the recently formed Data Services team at Yahoo News. Excited to help build something from the ground up!
English
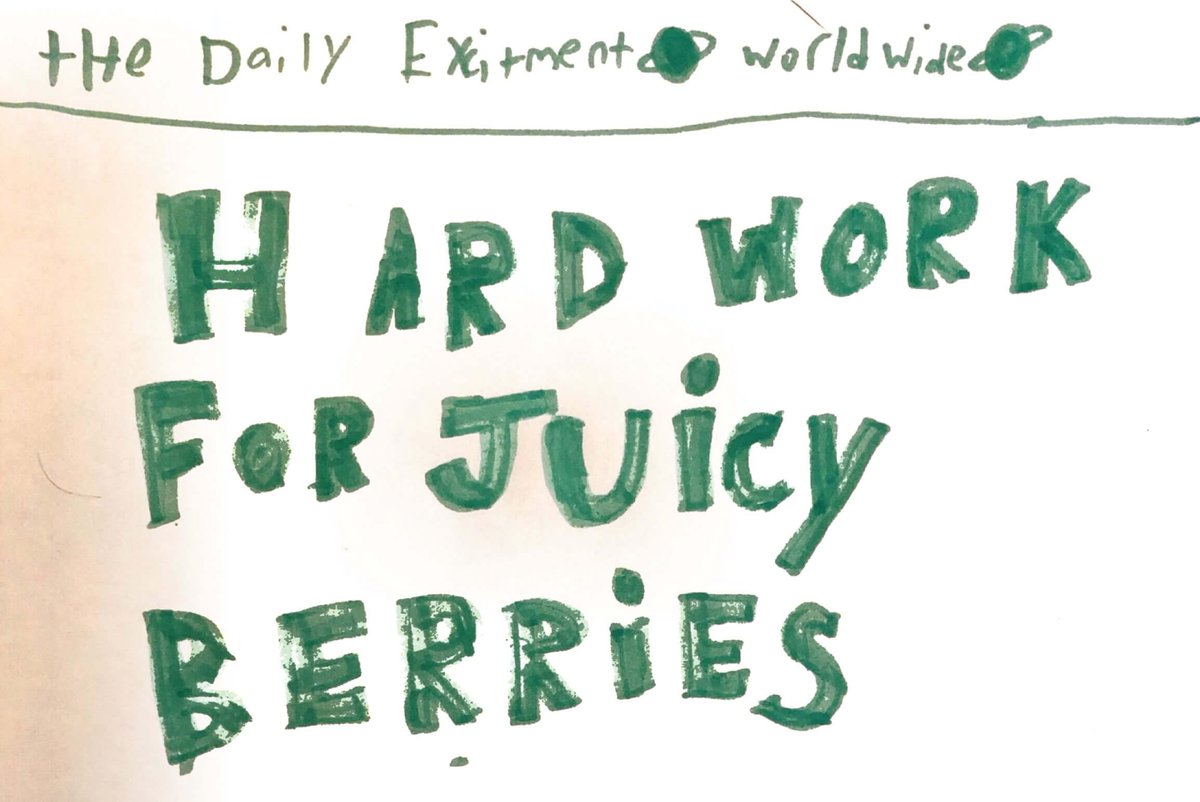
Unbelievably thankful for all the wonderful people I worked with on the graphics team. The Post gave me a lot of rope to produce lighthearted work, like a showcase of newspapers created by kids during Covid. Here's a headline from one of them that’s become a bit of a mantra.
English
Just wrapped up my second year teaching “Data Narratives” at RISD! Here’s the great set of final data visualization/storytelling projects that the students put together, all produced via R → Illustrator data-narratives.com
English
Since I moved to Providence, I’ve been teaching data visualization at RISD and Brown. Here’s a nice write-up of my class last semester at @Brown_DSI!
dsi.brown.edu/news/2024-08-2…
English
Finally, with @kt_prry and Luis Melgar (and many others outside of graphics), we designed and released The Post’s first ever polling modeling page! washingtonpost.com/elections/inte…
English
Then, again with @sadbumblebee, a much lighter story on trends in baby names, and why there are so many Carsons/Masons/Graysons/Jacksons nowadays washingtonpost.com/business/inter…
English
Journalism is tough but one benefit it does offer is variety. Here are three very different projects I got to edit over the past few weeks.
First, I worked with @sadbumblebee on the data presentation for an investigation into police abusing children washingtonpost.com/investigations…
English
Reuben Fischer-Baum retweetledi

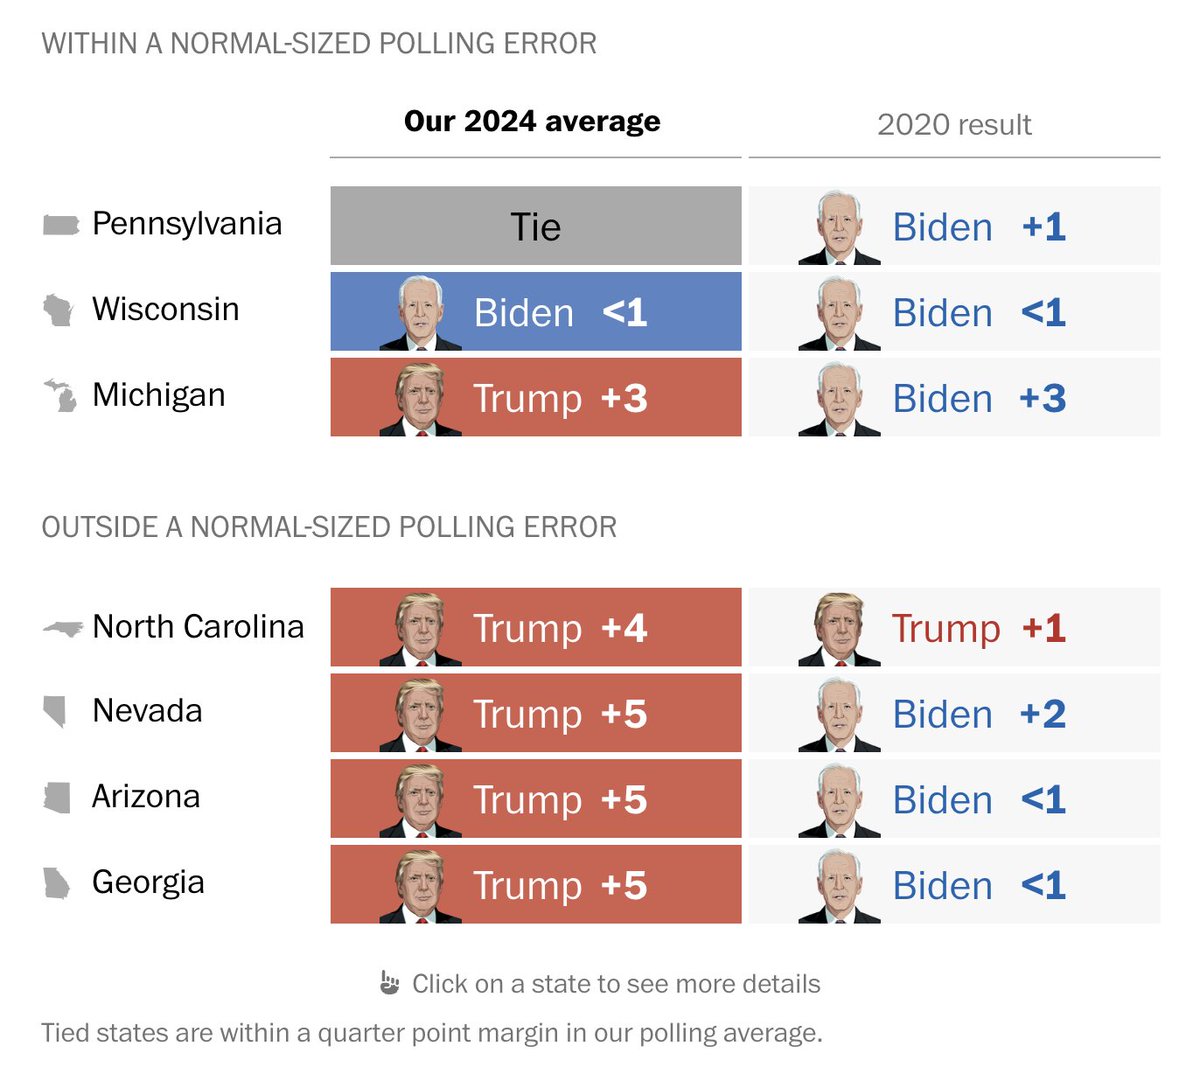
Our polling average topline takeaway: Trump is leading in 5 of the 7 battleground states that are most likely to determine the outcome of the election, but PA, WI and MI are within a typically-sized polling error.
w/ @dianesaysword, @kt_prry & Luis Melgar
washingtonpost.com/elections/inte…
English
@abtran @risd_gd @Brown_DSI ggplot -> Illustrator mostly! Although there were some Python students and the class was technically code agnostic
English

Got back into teaching data design this year with classes at @risd_gd and @Brown_DSI. Check out the great final projects that my Brown undergrads put together!
data1500.github.io/spring-2024/
English