
Robin Molenkamp
151 posts

Robin Molenkamp
@RobinMstocks
Long/short macro trader in U.S. stocks, sharing my thoughs on whatever I think is interesting to share.
Katılım Eylül 2025
79 Takip Edilen21 Takipçiler
@SophiaM_202 You can’t predict markets like that, it all depends on what happens next.
I’ve outlined some potential negative catalysts in a recent article:
@themetrader/note/p-196526182?r=18qh3s&utm_source=notes-share-action&utm_medium=web" target="_blank" rel="nofollow noopener">substack.com/@themetrader/n…
English


Can someone smarter than me explain why the markets are *still* near record highs?
English

Basic Materials Roundup: Market Talk on.wsj.com/4cYiLQ7
English

Kevin Warsh has promised to fix the inflation data on his watch at the Fed. He should go further, says Aaron Brown, and avoid the temptation to let the political process pick the numbers (via @opinion) bloomberg.com/opinion/articl…
English
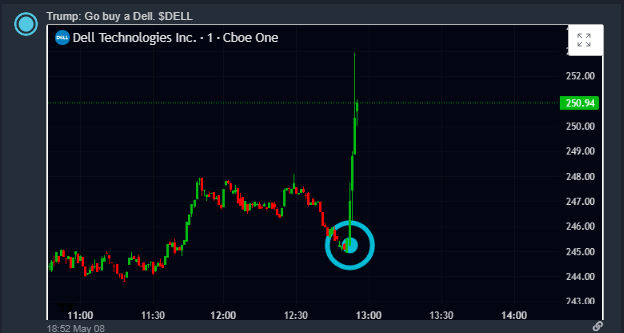
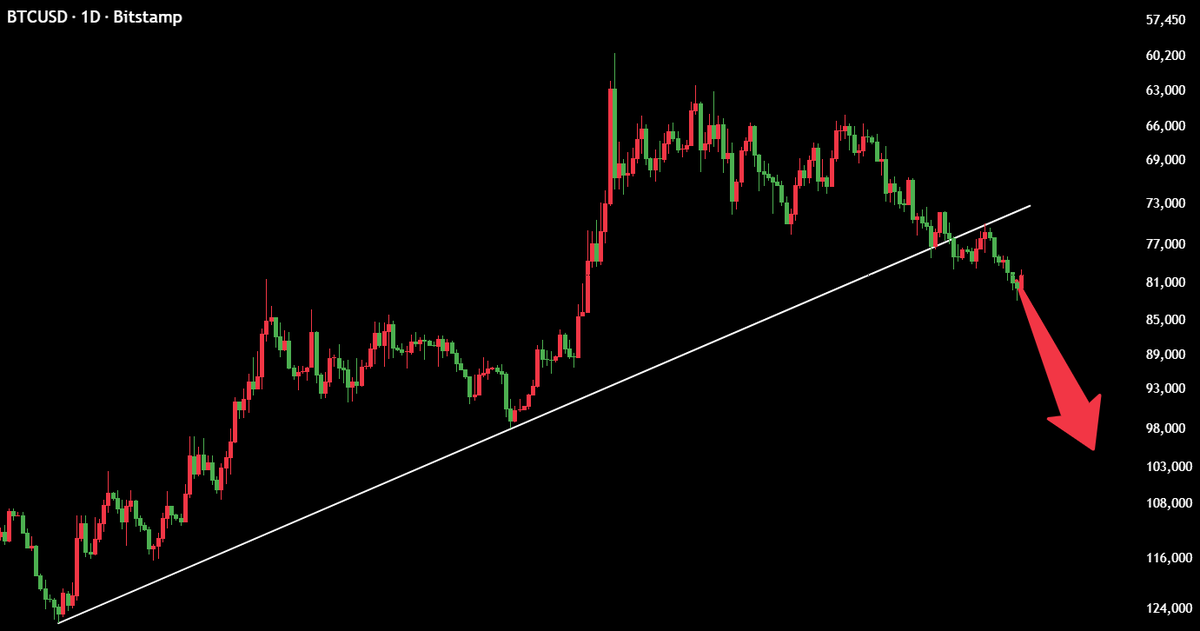
@MaxCrypto BTC reversal play using $MARA explained here:
open.substack.com/pub/themetrade…
English


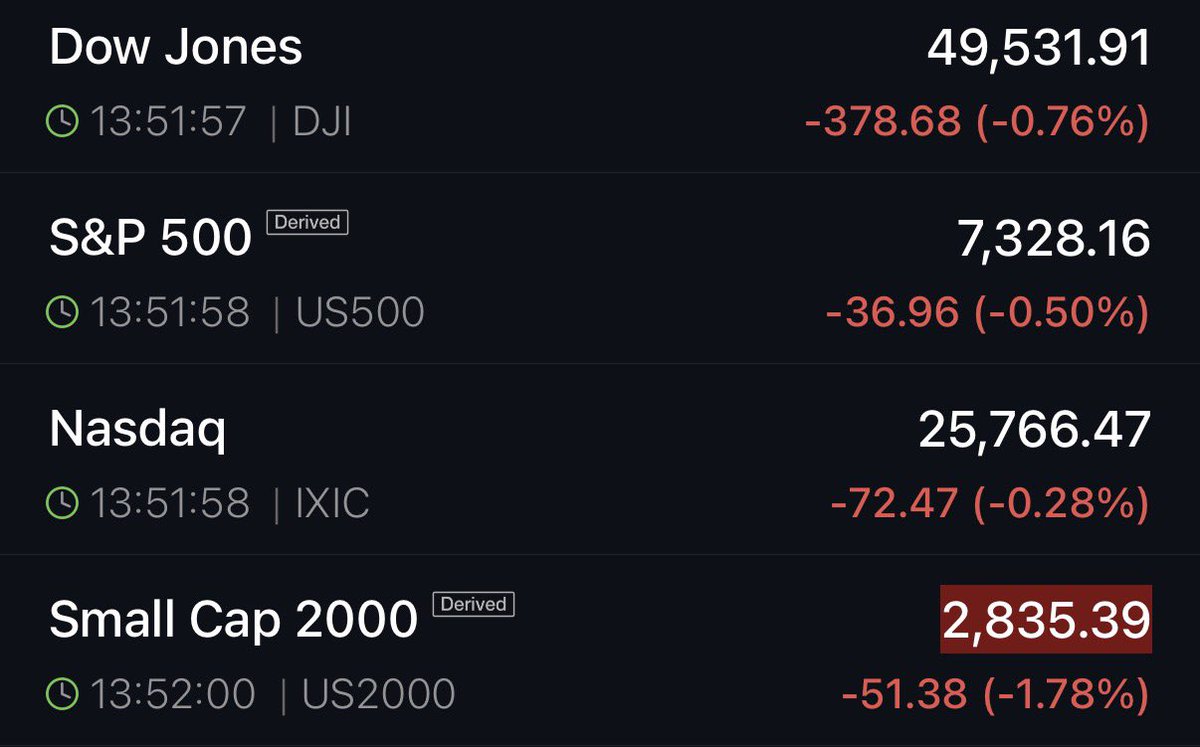
BREAKING: US equity markets fall on reports that President Trump is preparing to restart “Project Freedom” in the Strait of Hormuz.
English

@Barchart It can still go higher. The real shortages are yet to come, and it’s wise to position for an inflationary environment.
English


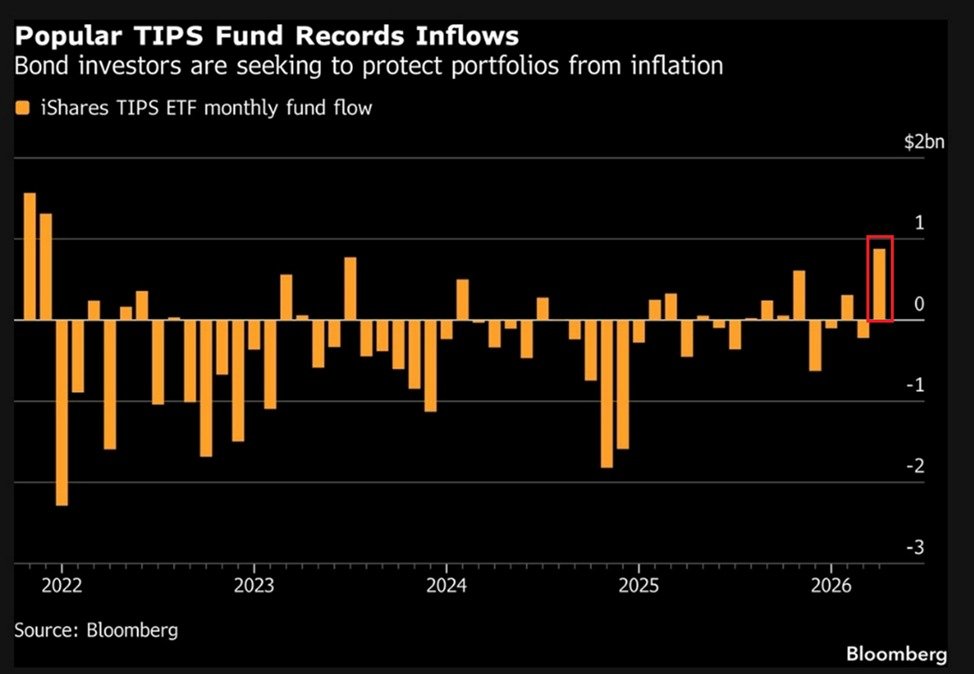
Investors are bracing for inflation:
The US Treasury Inflation-Protected Securities (TIPS) ETF, $TIP, attracted +$900 million of inflows in April, the largest monthly intake since December 2021.
This marks only the 2nd monthly inflow over the last 5 months.
Furthermore, global inflation-linked bonds are up +2% year-to-date, outperforming all 24 major fixed-income indexes tracked by Bloomberg.
Previously, in March, Euro inflation-linked bond funds attracted +$588 million in inflows, the most since March 2022, posting a strong reversal after almost a year of withdrawals.
This comes as investors believe the Iran War will leave a lasting inflationary impact on the global economy, regardless of where energy prices go from here.
Global inflation fears are surging.
English

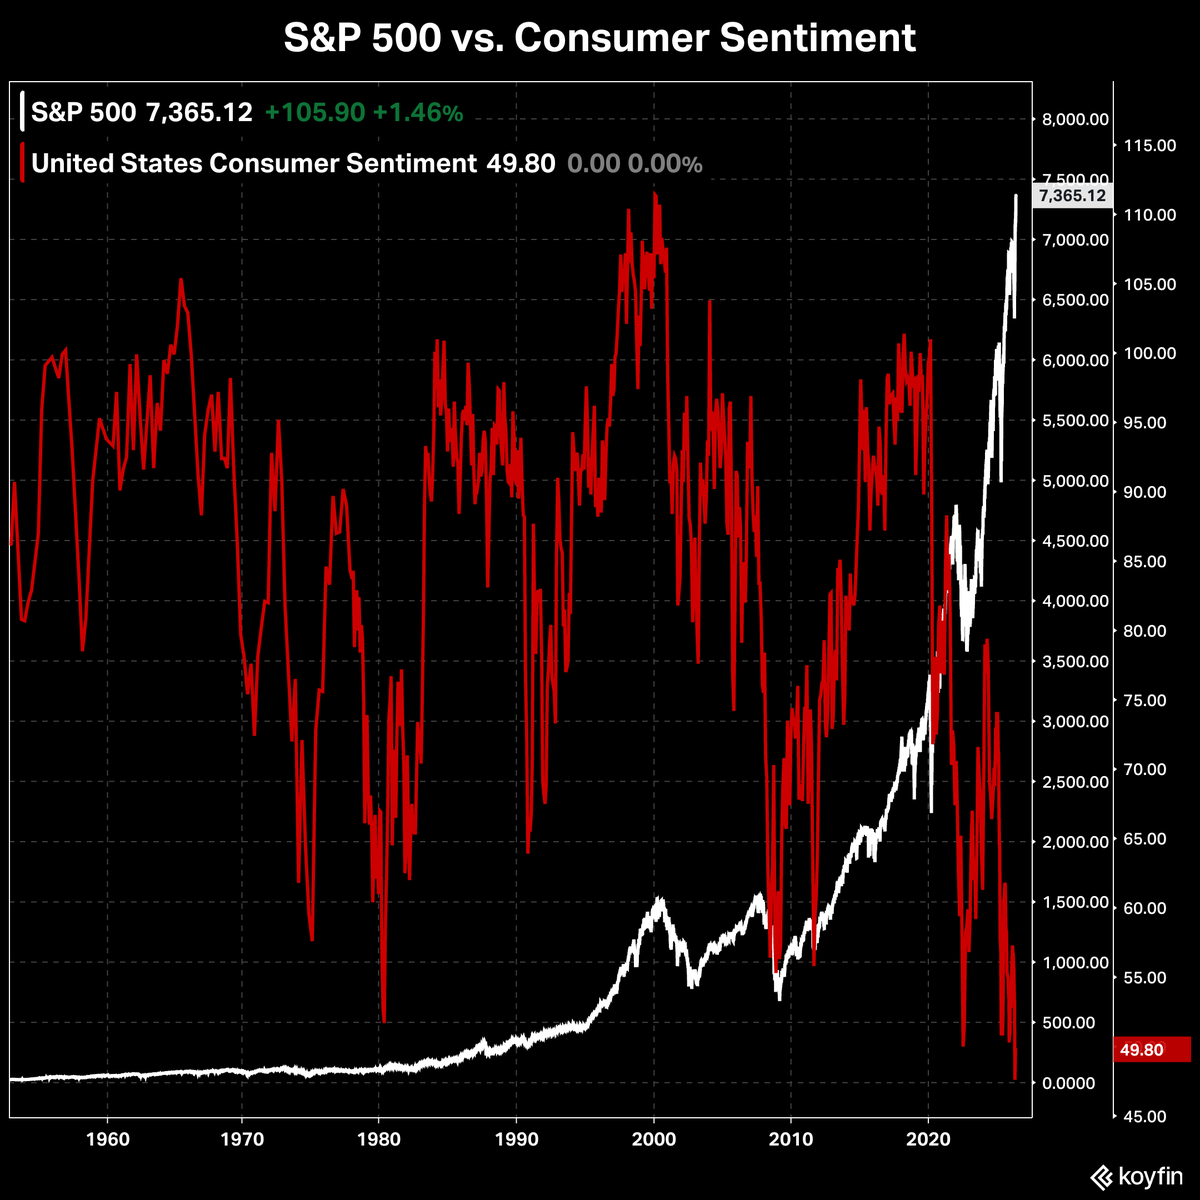
@GlobalMktObserv This is true and is due to Tech getting bigger and bigger in the index as Tech itself is growing fast and bigger.
It might reverse, it might not.
English

‼️The US stock market has almost never been this expensive in 150 years of data:
The P/E10 ratio is currently at 37.9, the 2nd highest reading in history, surpassed only by the March 2000 Dot-Com peak of 44.2.
This measures stock prices against the average of 10 years of inflation-adjusted earnings to smooth out short-term business cycle distortions
This figure is +114% above its long-run arithmetic mean, placing into a zone only visited once before in history - during the Dot-Com bubble.
Every previous time valuations have reached this extreme, the mean reversion followed over the next 10 years.
Expect lower than average future returns.

English

@midascabal That is true to some degree. Markets move in boom-and-bust cycles.
But betting on a market crash is extremely difficult. It’s better to know how to manage risk when the crash comes than to spend all your time trying to predict it.
English
