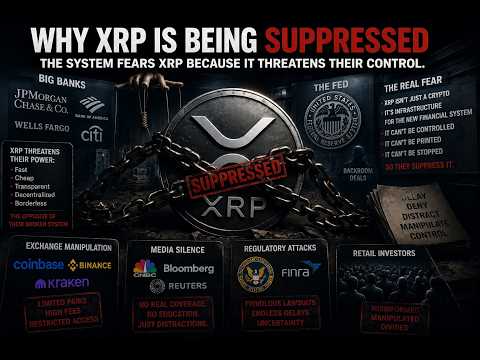
Robs Charts

7.6K posts

Robs Charts banner
Robs Charts

Robs Charts

@RobsCharts101

This channel is for individuals who genuinely want to learn how to read stock and crypto charts in a focused, respectful environment.

Cleveland, TX Katılım Ocak 2022
204 Takip Edilen298 Takipçiler
Robs Charts
Robs Charts@RobsCharts101·
Come Tuesday morning, when the market reopens after Memorial Day weekend, we’ll find out if I’m right or wrong about what I’m seeing this weekend. A pro-crypto Fed Chair gets sworn in… and crypto crashes the SAME weekend? Make that make sense. XRP held above $2 for almost a full year WITH: • a pending SEC court case • no ETFs • nonstop fear and uncertainty Now? • more adoption • more awareness • institutions entering crypto • pro-crypto leadership coming in Yet XRP sits around $1.32–$1.34? So retail investors are asking the question nobody wants to answer: If the fundamentals got stronger… why did the price get weaker? At some point, people stop calling it “normal market movement” and start calling it what it looks like: CONTROL.
Robs Charts tweet media
English
0
1
1
29
Robs Charts
Robs Charts@RobsCharts101·
The XRP Question Nobody Wants to Answer.
Robs Charts tweet media
English
0
1
1
15
Robs Charts
Robs Charts@RobsCharts101·
Even ChatGPT knows what time it is.
Robs Charts tweet media
English
0
1
1
10
Robs Charts
Robs Charts@RobsCharts101·
Memorial Day weekend 2025: Bitcoin stayed strong, crypto held up, but XRP lagged. That tells me money was moving, but not evenly. BTC had strength — XRP needed volume and a breakout confirmation.
Robs Charts tweet media
English
0
1
2
42
Robs Charts
Robs Charts@RobsCharts101·
XRP is acting heavy while stocks are at highs. Whether that’s suppression or rotation, the chart says the same thing: buyers are not being rewarded yet. Until XRP breaks out of this range with volume, we don’t guess — we read the chart. Why else would Jerome Powell stay on the board?
Robs Charts tweet media
English
0
1
1
27
Robs Charts
Robs Charts@RobsCharts101·
U.S. officials say there has been “slight progress” in talks with Iran. Pakistan is actively trying to broker a breakthrough between the U.S. and Iran. A UAE adviser said the odds of a U.S.-Iran deal are about “50-50.” Trump recently said he was willing to wait a few days for the “right answer” on a peace deal.
Robs Charts tweet media
English
0
1
1
73
Robs Charts
Robs Charts@RobsCharts101·
This Weekend...
Robs Charts tweet media
English
0
1
1
9
Robs Charts
Robs Charts@RobsCharts101·
⚠️ Crypto mood: cautious. Bitcoin is holding near $77K–$78K, but the recovery is slowing, and traders are waiting for stronger confirmation. Bitcoin: hovering under resistance; not breaking down hard, but not fully risk-on yet. Ethereum: near $2,100–$2,140, still soft with ETF/outflow pressure mentioned recently. XRP / SOL: altcoins still choppy; XRP recently holding near the $1.37–$1.40 zone, SOL around the mid-$80s. Macro pressure: Iran headlines, oil, and the 10-year yield are still driving risk appetite. Policy watch: tokenized stocks/crypto regulation headlines remain active after reports of a U.S. framework plan.
Robs Charts tweet media
English
0
1
1
21
Robs Charts
Robs Charts@RobsCharts101·
🚨 AI/chips: Nvidia, AMD, Intel, ASML, GlobalFoundries showing attention. Quantum names: IBM, GlobalFoundries, D-Wave, moving after reported U.S. Commerce grants.Oil: crude is up on Strait of Hormuz concerns, which can pressure inflation/yields. Estee Lauder: up big premarket after merger talk headlines ended. IMAX: moving on reports it may explore a sale.
Robs Charts tweet media
English
0
1
1
52
Robs Charts
Robs Charts@RobsCharts101·
Today's calls...
Robs Charts tweet media
English
0
1
1
7
Robs Charts
Robs Charts@RobsCharts101·
BOOM 💥 Reports are circulating that a major Iranian underground missile facility may have been hit. If confirmed, this marks a serious escalation in the region. We’re watching this closely — rumors move fast, but confirmation matters. Stay alert.
Robs Charts tweet media
English
0
1
1
23
Robs Charts
Robs Charts@RobsCharts101·
Jane Street is a huge trading firm. India’s market regulator, SEBI, accused them of pushing the Bank Nifty index up, then profiting when it dropped back down. Easy way to explain it: Jane Street allegedly bought a lot of bank stocks/futures, which helped push the index higher. While that was happening, they also had big options positions that made money if the index later fell. Then when the price moved back down, those options paid them big money. Think of it like this: They allegedly shook the market one way, got retail traders to chase it, then made money when the trap reversed. SEBI banned Jane Street from Indian markets and froze about $567 million in alleged unlawful gains. Jane Street denies wrongdoing and says it was legal arbitrage trading. For your audience: “Jane Street didn’t just guess the move. Regulators say they had enough size to influence the move, trap traders, and profit from the reversal.”
Robs Charts tweet media
English
0
1
1
108
Robs Charts
Robs Charts@RobsCharts101·
The final draft of the US-Iran agreement has been reached with the mediation of Pakistan, which is expected to be announced within the next few hours, per Iranian State media.
Robs Charts tweet media
English
0
1
1
54