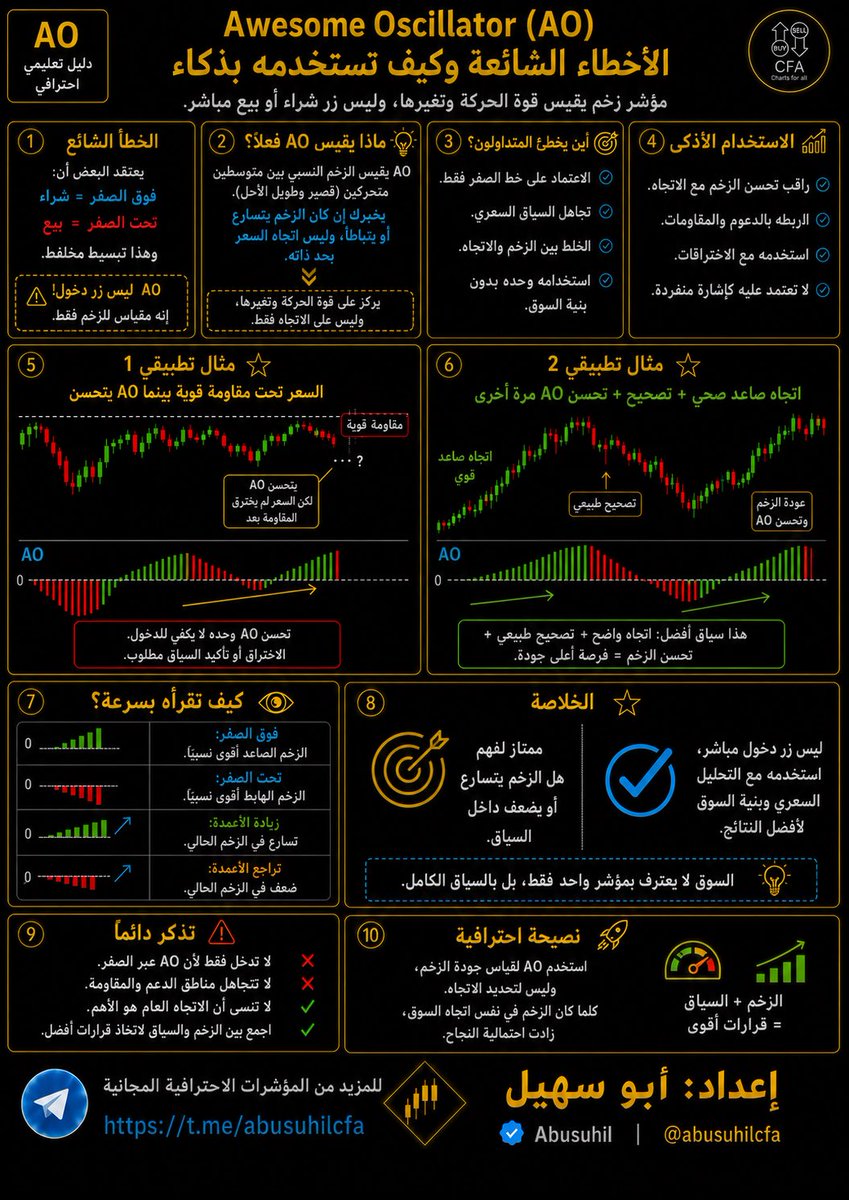
خطأ شائع جدًا في Awesome Oscillator:
بعض المتداولين يعتقدون أن:
- فوق الصفر = شراء مباشر
- تحت الصفر = بيع مباشر
وهذا تبسيط مخل.
الحقيقة أن AO يخبرك عن الزخم النسبي،
لكنه لا يكفي وحده ليقول لك:
“هذه أفضل نقطة دخول”
أين يخطئ كثير من المتداولين؟
• يعتمدون على اختراق خط الصفر فقط
• يهملون السياق السعري
• لا يفرقون بين الزخم والاتجاه
• يتجاهلون أن الزخم قد يتحسن داخل تصحيح فقط، وليس بالضرورة بداية موجة جديدة
• يستخدمونه وحده بدون دعم من بنية السوق أو السعر
الاستخدام الأذكى لـ AO:
• راقب هل الزخم يتحسن مع الاتجاه أم ضده
• انتبه لتغير لون الأعمدة وتسلسلها، لكن لا تبنِ القرار عليها وحدها
• اربطه مع مستويات مهمة على الشارت
• في السوق الاتجاهي استخدمه لفهم هل الحركة ما زالت مدعومة
• وفي السوق الضعيف انتبه لأنه قد يعطيك تحسنًا لحظيًا لا يكفي وحده
مثال مهم:
قد ترى AO يتحسن ويصعد فوق الصفر،
لكن السعر ما زال تحت مقاومة قوية أو داخل بنية ضعيفة.
هنا من الخطأ أن تعتبر المؤشر وحده كافيًا.
وفي المقابل،
قد يكون السعر في سياق صاعد جيد،
ويبدأ AO في التحسن من جديد بعد تصحيح،
وهنا تصبح قراءته أكثر فائدة.
إذا سألتني عن أفضل استخدام له، فسأقول:
أفضله لفهم هل الزخم يتسارع أو يضعف داخل السياق
وليس كزر دخول مباشر.
سؤال اليوم:
هل المشكلة في AO نفسه…
أم في خلط كثير من المتداولين بين “الزخم” و
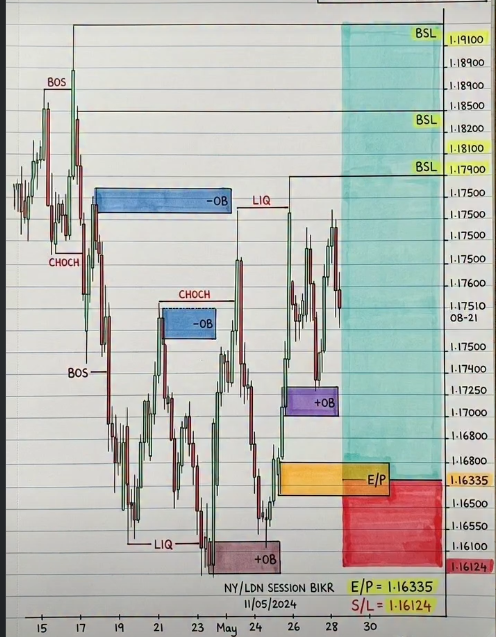
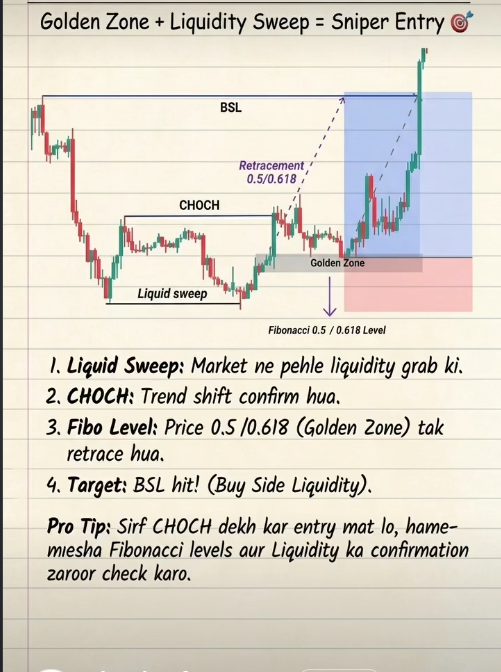
🚨USE MULTIPLE TIME FRAME ANALYSIS – TRADE WITH CONFIDENCE
✅ Daily / 4H – Set the overall direction (Bullish or Bearish)
✅ 1 Hour – Identify key liquidity zones (High / Low Liquidity)
✅ 15 Min – Spot BOS & CHOCH for trend confirmation
✅ 5 Min – Fine-tune your TP, Entry, and SL levels
🚨Stack your timeframes from high to low. Align bias, then execute!
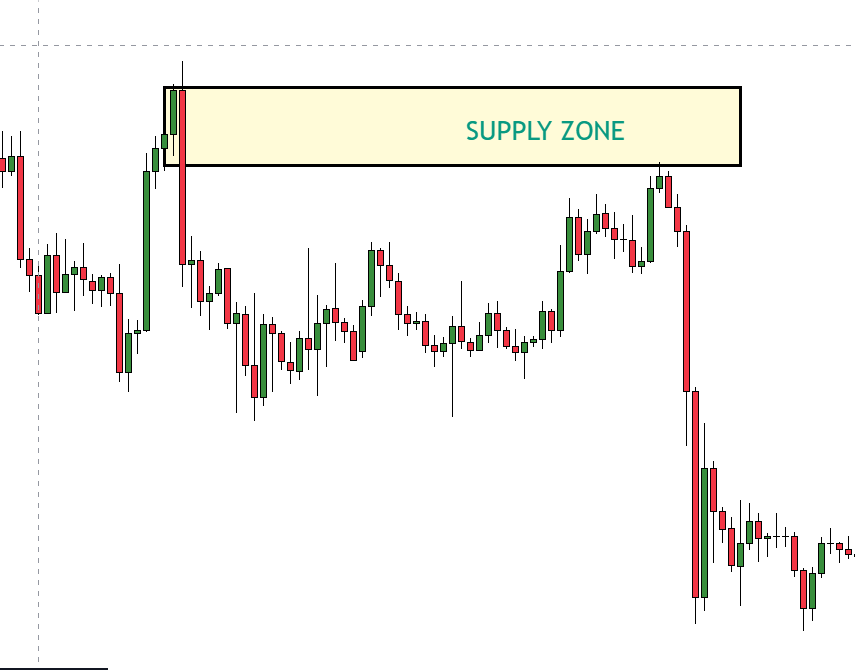
🚨Master Supply Zones: A Step‑by‑Step Guide to Spotting Downtrend Sell Setups.
✍️Catching Downtrend Selling Opportunities Using Supply Zones
✍️I sometimes spot high-probability downtrend sell setups by using a clear supply zone.
✍️ Here’s the simple process I follow:
✅️Identify the supply zone, a recent
area where price rallied into a cluster
of highs and then dropped sharply.
Mark the zone’s top and bottom.
✅️Wait for a retest, let price return
into the zone; I don’t chase the initial
move.
✅️Look for confirmation, bearish
rejection candles, rising selling
volume, or failure to break above
the zone.
✅️Enter with a plan, short on
confirmed rejection or a break
below the retest low. Place a stop
just above the zone.
✅️Manage risk, size the trade so the
stop loss equals a small, predefined
percentage of your account. Set
targets at nearby demand/support
levels or use a trailing stop.
✅️Be patient and selective, not every
touch of the zone is tradable; wait for
clean structure and confirmation.
✍️Not financial advice. This is a
technique I use to find potential
short trades; always test on a demo
and use proper risk management.
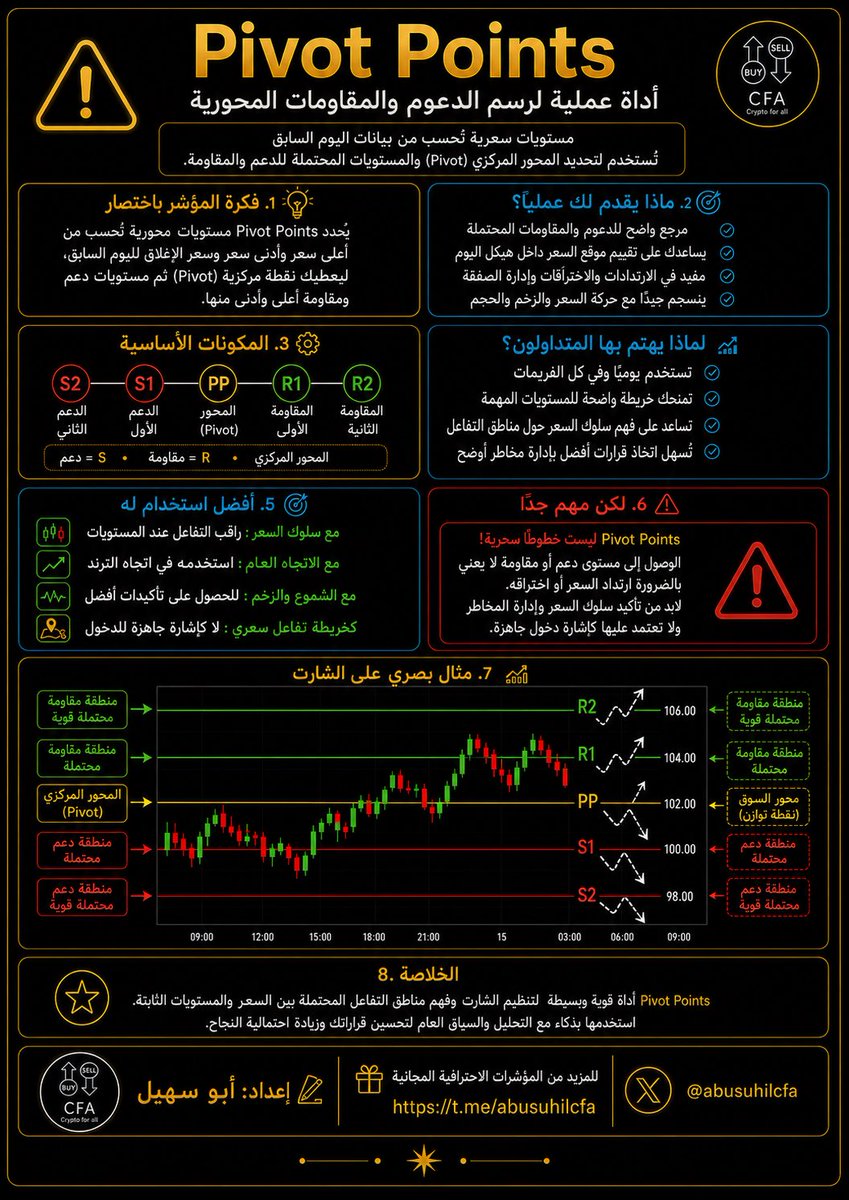
من الأدوات العامة المشهورة جدًا عند المتداولين، خصوصًا في المتابعة اليومية والسكالبينج:
Pivot Points
فكرة الأداة باختصار:
هي مستويات سعرية محسوبة رياضيًا، تُستخدم لتقدير:
- أين قد يظهر الدعم
- وأين قد تظهر المقاومة
- وأين تقع النقطة المحورية التي يبنى عليها كثير من المتداولين قراءتهم لليوم أو للفترة
بمعنى أبسط:
Pivot Points تحاول أن تعطيك خريطة سعرية جاهزة تقول لك:
هذه منطقة مركزية
وهذه مناطق أعلى قد تعمل كمقاومات
وهذه مناطق أسفل قد تعمل كدعوم
لماذا يهتم بها كثير من المتداولين؟
لأنها:
• واضحة وسريعة الفهم
• سهلة الدمج مع حركة السعر
• مفيدة في اليومي والسكالبينج والمتابعة intraday
• تعطي مرجعًا منظمًا بدل الرسم العشوائي
• تساعدك على تقييم: هل السعر فوق المركز أم تحته؟ وهل يقترب من مستوى مهم؟
ما الذي تقدمه لك عمليًا؟
• مرجعًا واضحًا للدعوم والمقاومات المحتملة
• تصورًا جيدًا لمناطق التفاعل السعري
• أداة مفيدة لقياس مكان السعر داخل هيكل اليوم
• إمكانية استخدامها مع الارتدادات أو الاختراقات أو إدارة الصفقة
• فائدة كبيرة عندما تتزامن مع مناطق أخرى قوية على الشارت
لكن مهم جدًا:
Pivot Points ليست خطوطًا سحرية،
وليست كل ملامسة لها تعني دخولًا مباشرًا.
القيمة الحقيقية تظهر عندما تستخدمها مع:
• سلوك السعر
• الاتجاه العام
• الزخم
• الحجم
• أو مناطق دعم/مقاومة أخرى
أين أرى فائدتها الأكبر؟
في أنها تساعدك على تنظيم الشارت ذهنيًا:
بدل أن ترى السوق كحركة عشوائية،
تبدأ ترى:
- مركز الحركة
- مناطق رد الفعل المحتملة
- أين قد يهدأ السعر
- وأين قد يشتد الصراع
الخلاصة:
إذا كنت تريد أداة بسيطة ومرتبة تساعدك على قراءة مستويات اليوم أو الجلسة بشكل أوضح، فـ Pivot Points من أكثر الأدوات العملية التي تستحق المتابعة.
🚨COPPER IS BREAKING OUT
This metal is a forgotten bottleneck of AI.
NAMES THAT CAN RUN:
Copper Giants:
$FCX $SCCO $TECK
Copper Growth:
$HBM $ERO $LUNMF
Next-Gen Copper:
$IVPAF $NGEX $FILO
High Beta Copper:
$TGB $TRQ $CSCCF
Copper ETF:
$COPX
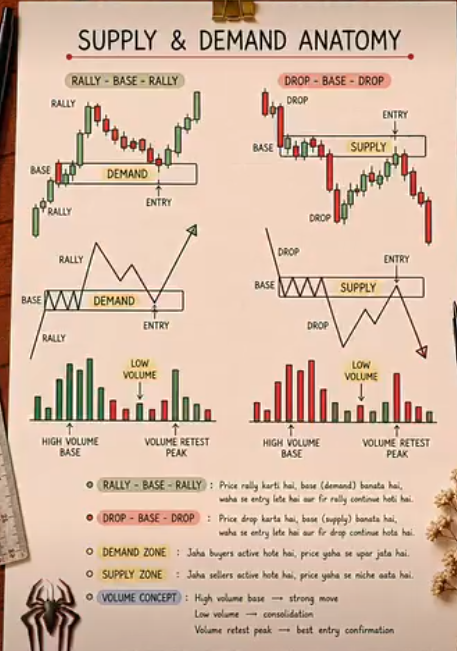
SUPPLY & DEMAND ANATOMY – RALLY → BASE → RALLY
☑️RALLY – BASE – RALLY (Demand)
Price rallies → forms a BASE (demand zone) → enters → rallies again.
Entry at base after high volume rally + low volume retest.
☑️DROP – BASE – DROP (Supply)
Price drops → forms a BASE (supply zone) → enters → drops again.
Entry at base after high volume drop + low volume retest.
Volume Concept (Key Confirmation)
High volume base = strong move (institutional interest).
Low volume inside base = consolidation / exhaustion.
Low volume peak retest = best entry signal.
✔️Demand Zone – Buyers active → price moves up.
✔️Supply Zone – Sellers active → price moves down.
✍️Wait for base after a strong move.
Enter when volume drops. Ride the next rally or drop.
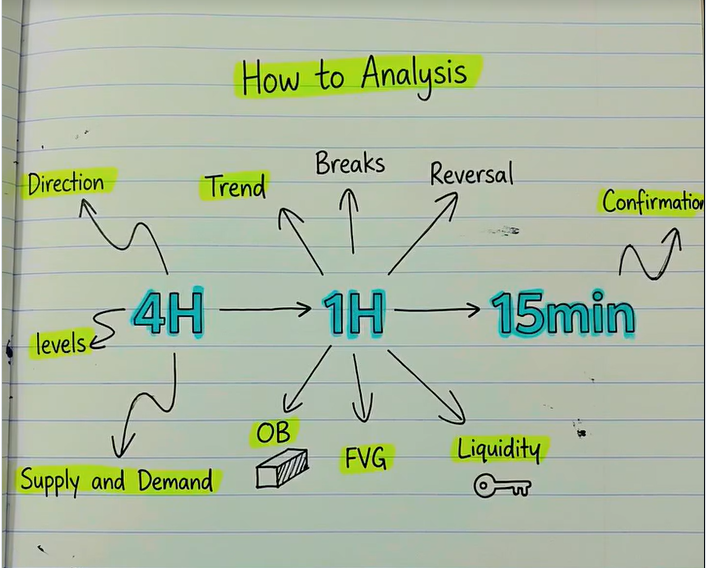
اسم المؤشرات الفنية الي استخدمها لمعرفة الاتجاة و افضل منطقة للدخول و الوقف ..
مع التوضيح على الصورة كيف طريقة الدخول كمثال فقط.
والافضل لازم تربطها مع التحليل الفني .
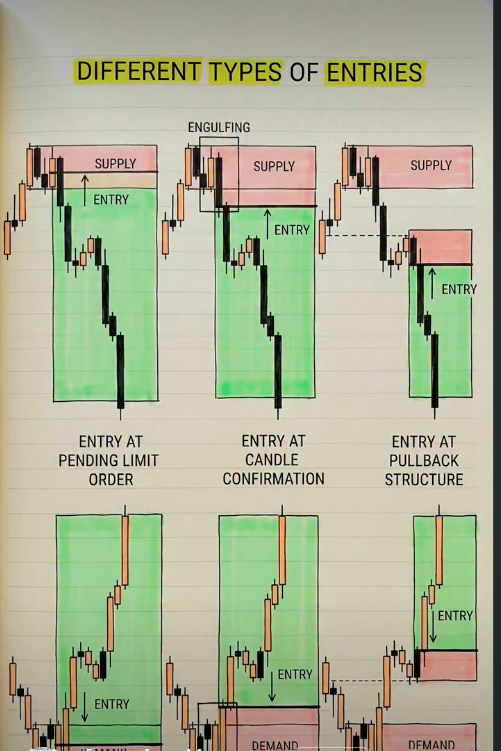
🚨3 POWERFUL ENTRY TYPES IN SUPPLY ZONES
✓ PENDING LIMIT ORDER – Set it and wait for the fill.
✓ CANDLE CONFIRMATION – Enter after a bearish close.
✓ PULLBACK STRUCTURE – Let price retest, then strike.
Master these → Smarter trades, less stress.
EMA CROSSOVER SECRETS THEY NEVER TELL YOU
When EMA 16 cuts below EMA 48
and price stays under the fast EMA,
you’re not looking at noise, you’re
looking at momentum shifting
before most traders react.
✔ Price below EMA16 = sellers in
control.
✔ EMA16 < EMA48 = trend
confirmation.
✔ Laguerre under 0.2 = exhaustion +
continuation signal.
This is how you stop guessing and
start timing entries with precision.