Sabitlenmiş Tweet
Himani
10.9K posts


Himani
@STOCKBAGGER1
Electronics Engineer Positional trader VCP Pattern Swing trading chart Reading 📈 Tweet For educational purpose not recommendation. SEBI UNREGISTERED
Katılım Mayıs 2021
24 Takip Edilen19.7K Takipçiler

Rs 590 Cr Fraud At #IDFCFirstBank Conference Call Takeaways
- Final impact will depend on recoveries, insurance etc
- Signatures were forged on cheques to withdraw money for fraud
- Have appointed KPMG for a forensic audit
#idfcfirstbank
#Rbi #fraud
#privatisation

English
@nsitharamanoffc Kindly ask all psb MD’s to ask their respective subordinates to implement it rigorously
English

I've been speaking consistently on mis-selling. Banks should concentrate on their core business. They should make their money on what they've lent. CASA (Current Account Savings Account) money should be their priority.
I am glad that the RBI is coming up with guidance on why mis-selling is not going to be entertained. The message should go to the banks that you cannot afford to mis-sell.
- Smt @nsitharaman in New Delhi
English
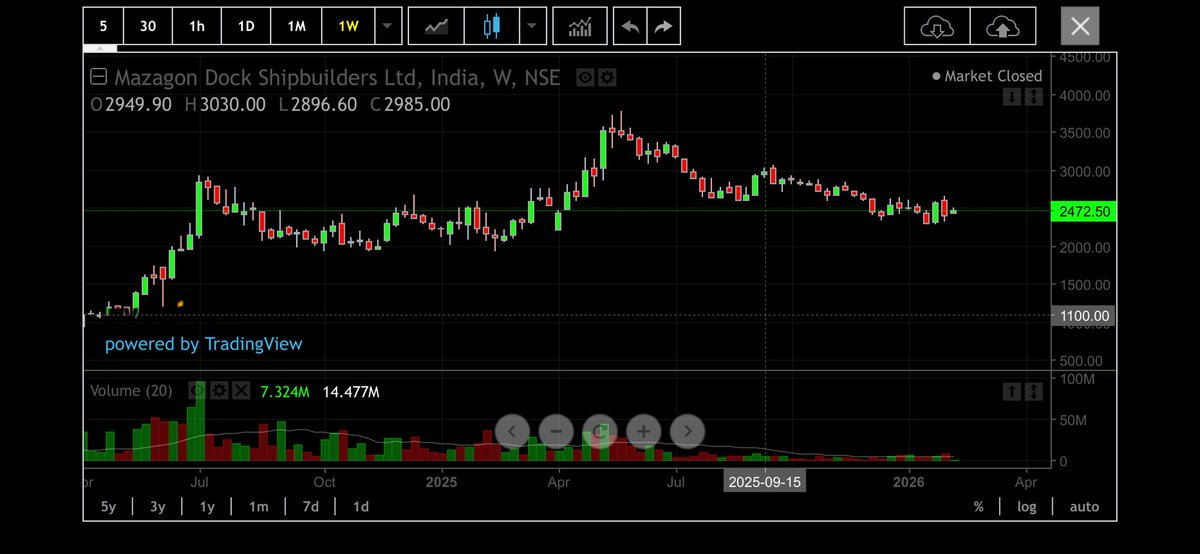
Positional Trade timeframe 90-120 Days
MAZDOCK stands at ₹2,975.
which is the current analyst mean and fair value estimate. That’s about 20% above today’s price of ₹ 2472.50
💎Target Zone: Cautious Optimism, But Clouds Linger
Analyst Consensus:
•Median & mean target: ₹2,975.
•High estimate: ₹3,489.
💎No buy sell recommendation.
English
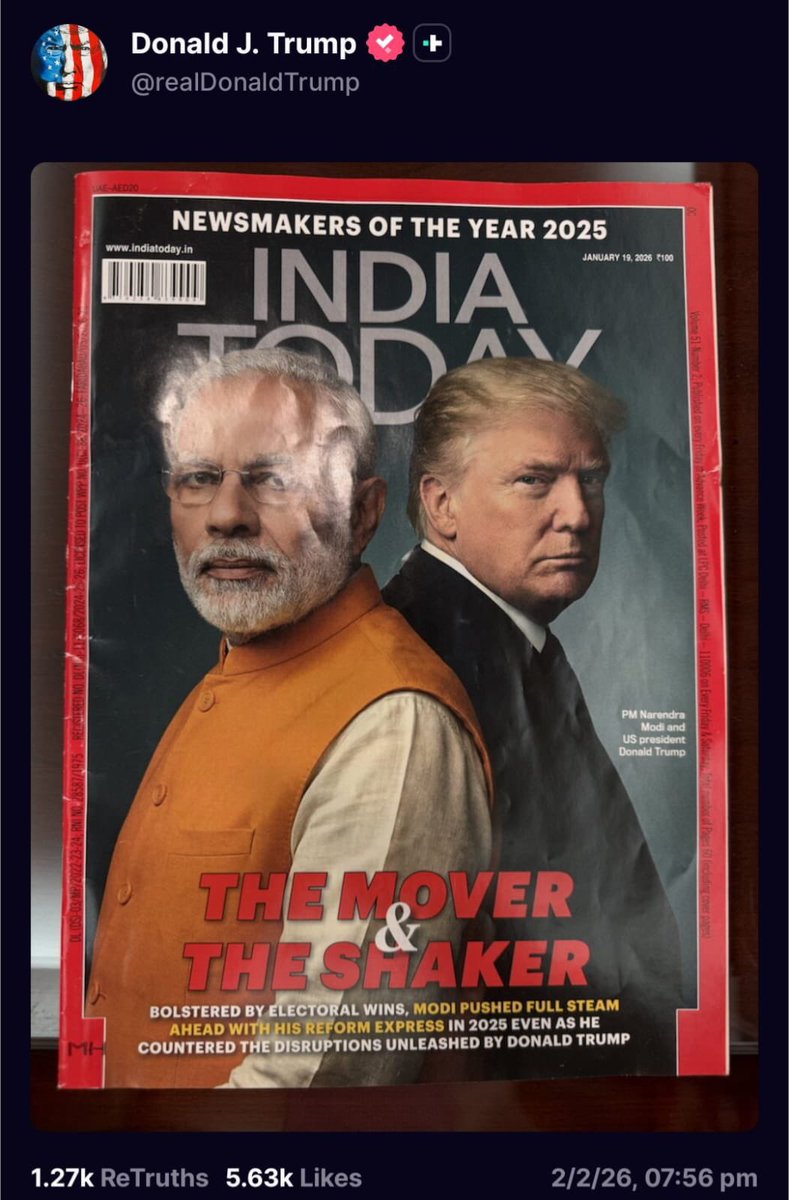
🇮🇳 ‘No partner is more essential than #India,’ says new #US envoy
Thanks for your attention @realDonaldTrump @narendramodi
English
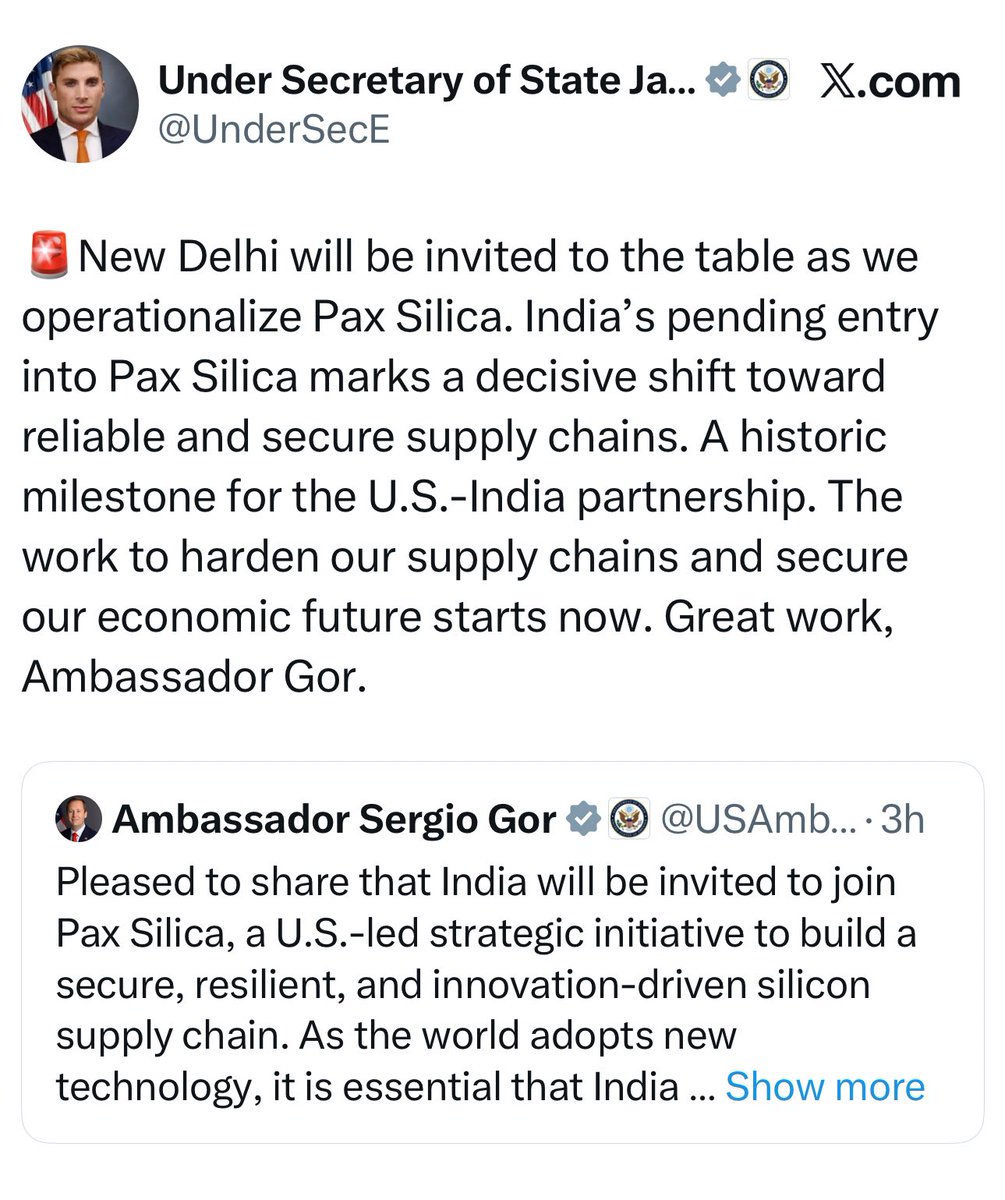
🚨New Delhi will be invited to the table as we operationalize Pax Silica. India’s pending entry into Pax Silica marks a decisive shift toward reliable and secure supply chains. A historic milestone for the U.S.-India partnership. The work to harden our supply chains and secure our economic future starts now. Great work, Ambassador Gor.
English
A bullish flag 🚩 is a continuation chart pattern seen in uptrends.
🔍 What it looks like
1.Flagpole:
A sharp, fast price rise (strong volume)
2.Flag:
A short period of sideways/downward consolidation that slopes slightly downward, usually between two parallel lines
3.Breakout:
Price breaks above the upper trendline with volume → uptrend continues
📈 What it signals
•Bulls paused to catch their breath
•Selling pressure is weak
•After consolidation, trend often resumes
English

Himani retweetledi
Every time it reaches that ceiling, it hits its head, gets hurt, and comes back down.
That invisible ceiling is RESISTANCE.
⸻
🎭 Who creates resistance?
People holding the stock at that level say:
“Last time price came here, it fell.
Let me SELL now before it drops again!”
So when price reaches that zone:
•Many sellers appear
•Supply increases
•Stock struggles to move higher
English