🇺🇸 Happy Fourth of July from Signa!
For 24 hours only — get 20% off your first month or first year on any plan.
Use code JULY4 at checkout.
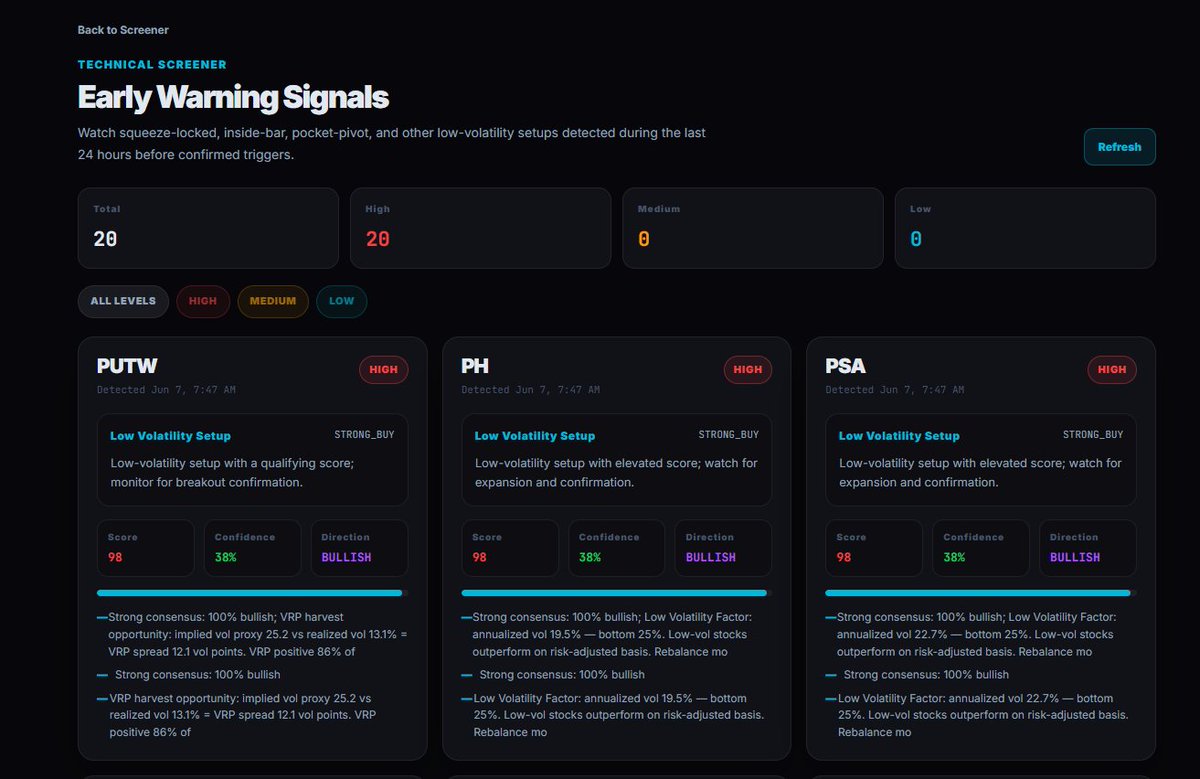
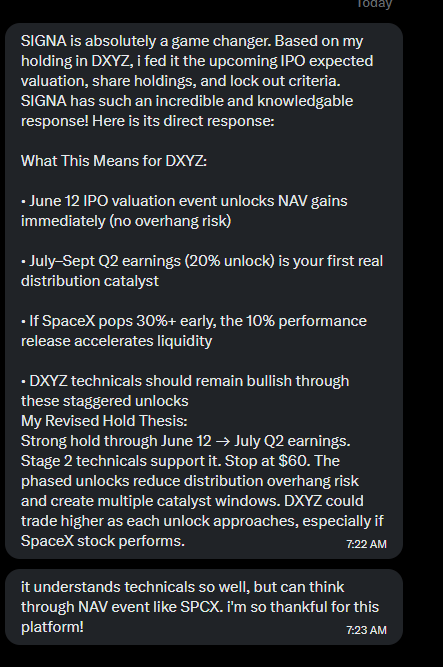
Live trading signals. AI chart analysis. In-app alerts. Built for serious traders. 📈
→ getsigna.ai
#July4th

English