Andrei Sota

3.3K posts

Andrei Sota banner
Andrei Sota

Andrei Sota

@Signal_Sigma

Invest Smarter with Signal Sigma: Professional-grade strategies, automated insights, and risk tools. Try free at https://t.co/Ng2smTsc6F No card required.
Bucharest, Romania Katılım Ocak 2013
262 Takip Edilen5.4K Takipçiler
Sabitlenmiş Tweet
Andrei Sota
Andrei Sota@Signal_Sigma·
API Functionality is live! Claim your API KEY and access the full documentation here: signal-sigma.com/api-docs More to come soon :)
English
1
1
2
1.4K
Andrei Sota
Andrei Sota@Signal_Sigma·
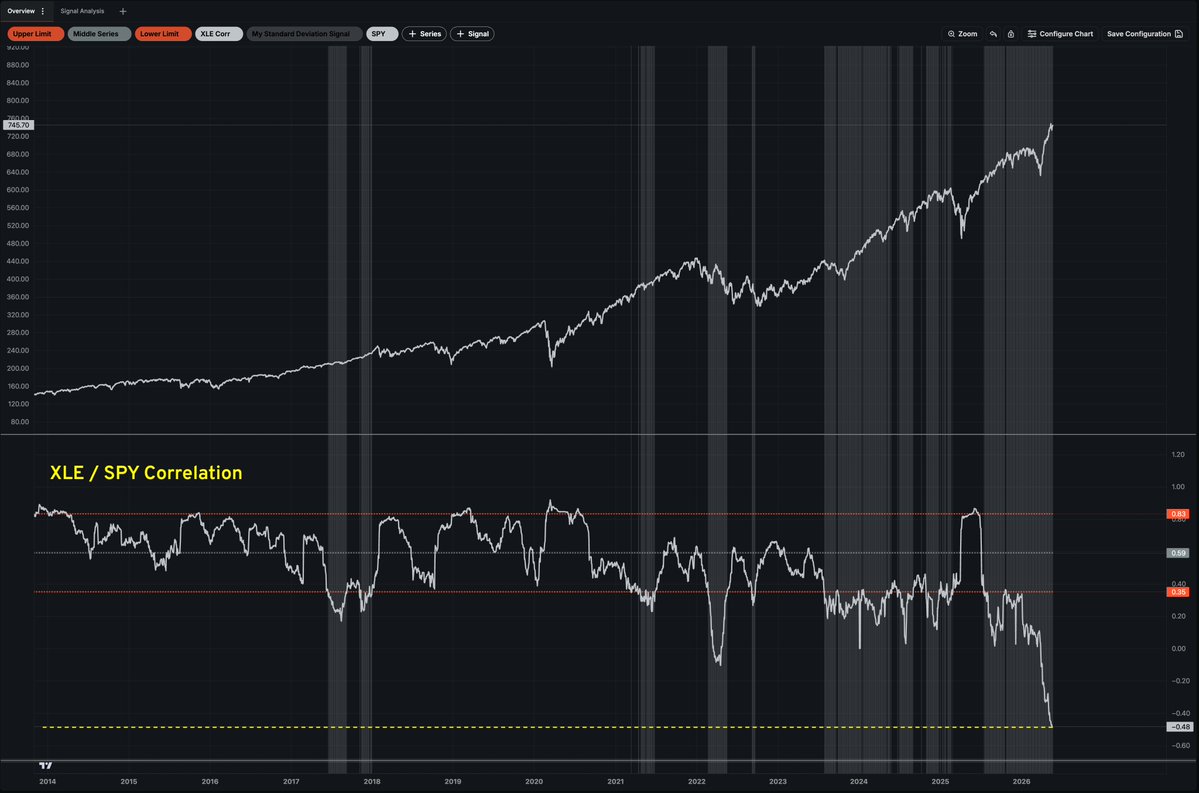
While true, I would argue that "demand destruction" really occurs when $XLE is highly correlated with $SPY and $SPY is in a downtrend. Otherwise, the market seems to be doing well in low correlation regimes. That being said, the recent reading IS striking.
Andrei Sota tweet media
Lance Roberts@LanceRoberts

The three-month correlation between energy and the S&P 500 has reached its most negative level on record. Typically, the demand destruction from high oil prices eventually catches up with earnings and expectations. The question is whether this time is different?

English
0
0
0
328
Andrei Sota
Andrei Sota@Signal_Sigma·
@astro_idx If this model provides consistent negative returns in live trading (out of sample data), I will publish it as part of the oficial models. Until then, it's in the experimental stage.
English
0
0
0
23
Andrei Sota
Andrei Sota@Signal_Sigma·
I've been working on this model that provides a suitable portfolio for taking short positions, as it tends to underperform consistently in the backtest. It rotates positions weekly, based on mean-reversion. As you can see, being short this portfolio would pay off longer term. However, it's going to bite you in short squeeze periods like mid-March to present, where it gained +35%.
Andrei Sota tweet media
English
1
0
0
43
Andrei Sota
Andrei Sota@Signal_Sigma·
Current Uninterrupted Rally for major factors versus maximum rallies in the past 5 years. Emerging Markets $EEM have nearly run their course. But Mega Caps, Momentum, Growth - the areas of the market most analysts are jittery about - are only about halfway through.
Andrei Sota tweet media
English
1
0
1
219
Andrei Sota
Andrei Sota@Signal_Sigma·
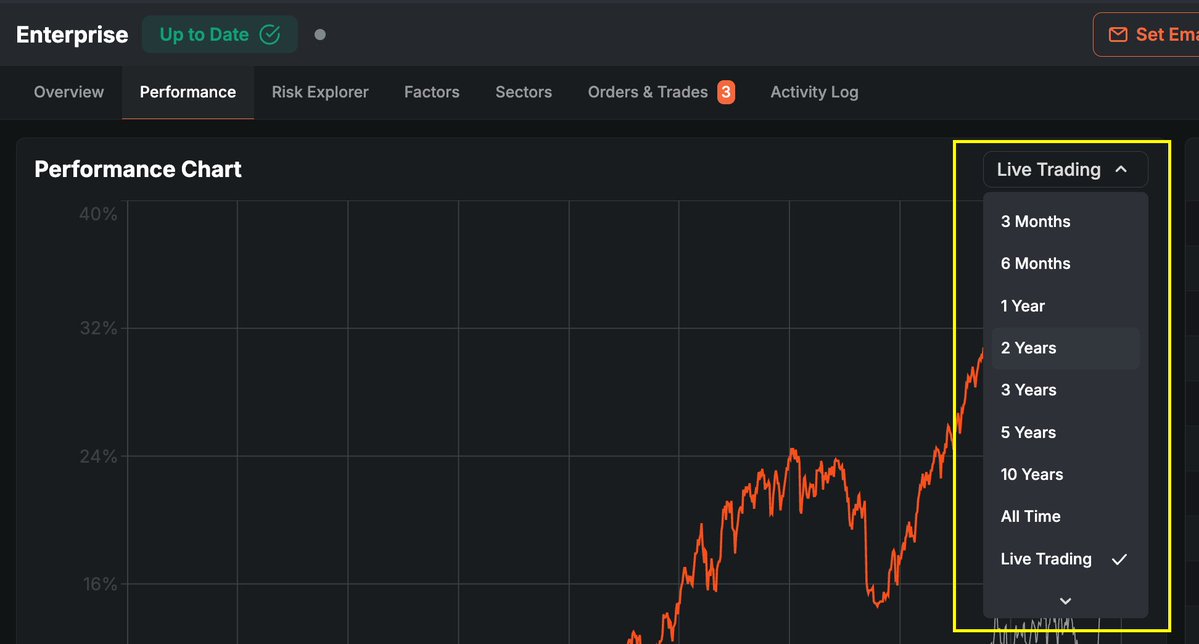
Starting major improvements and optimizations to app responsiveness and query speed today. First fix - time frame selector in the Performance tab of Strategies.
Andrei Sota tweet media
English
0
0
3
391
Andrei Sota
Andrei Sota@Signal_Sigma·
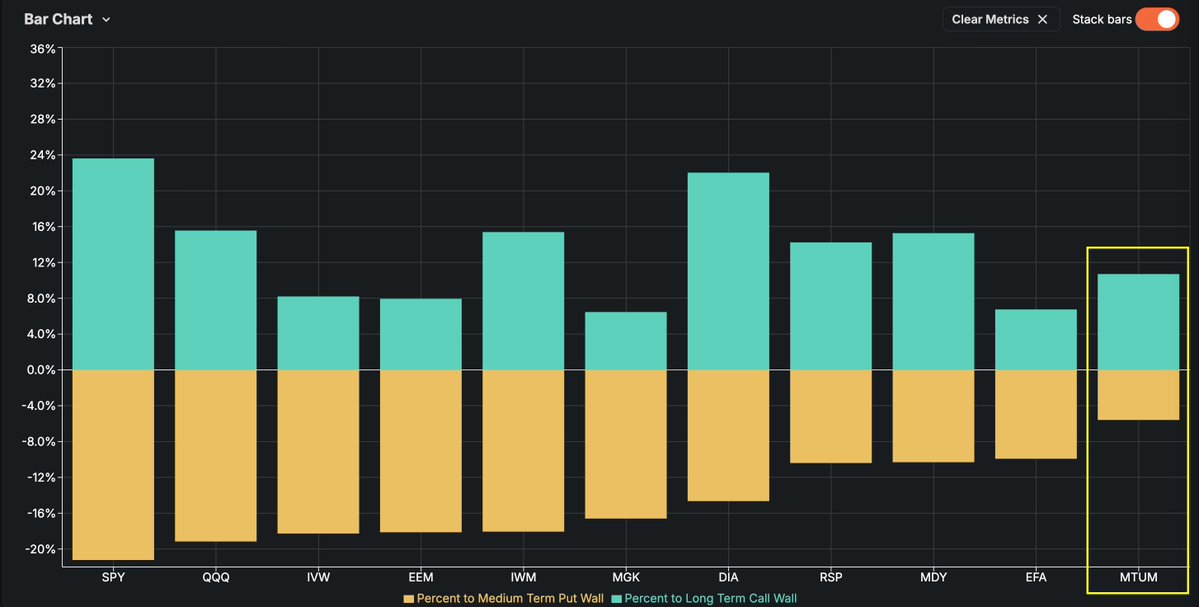
... the options market is showing that $MTUM has the best risk / reward setup out of all major factor ETFs.
Andrei Sota tweet media
English
0
0
3
171
Andrei Sota
Andrei Sota@Signal_Sigma·
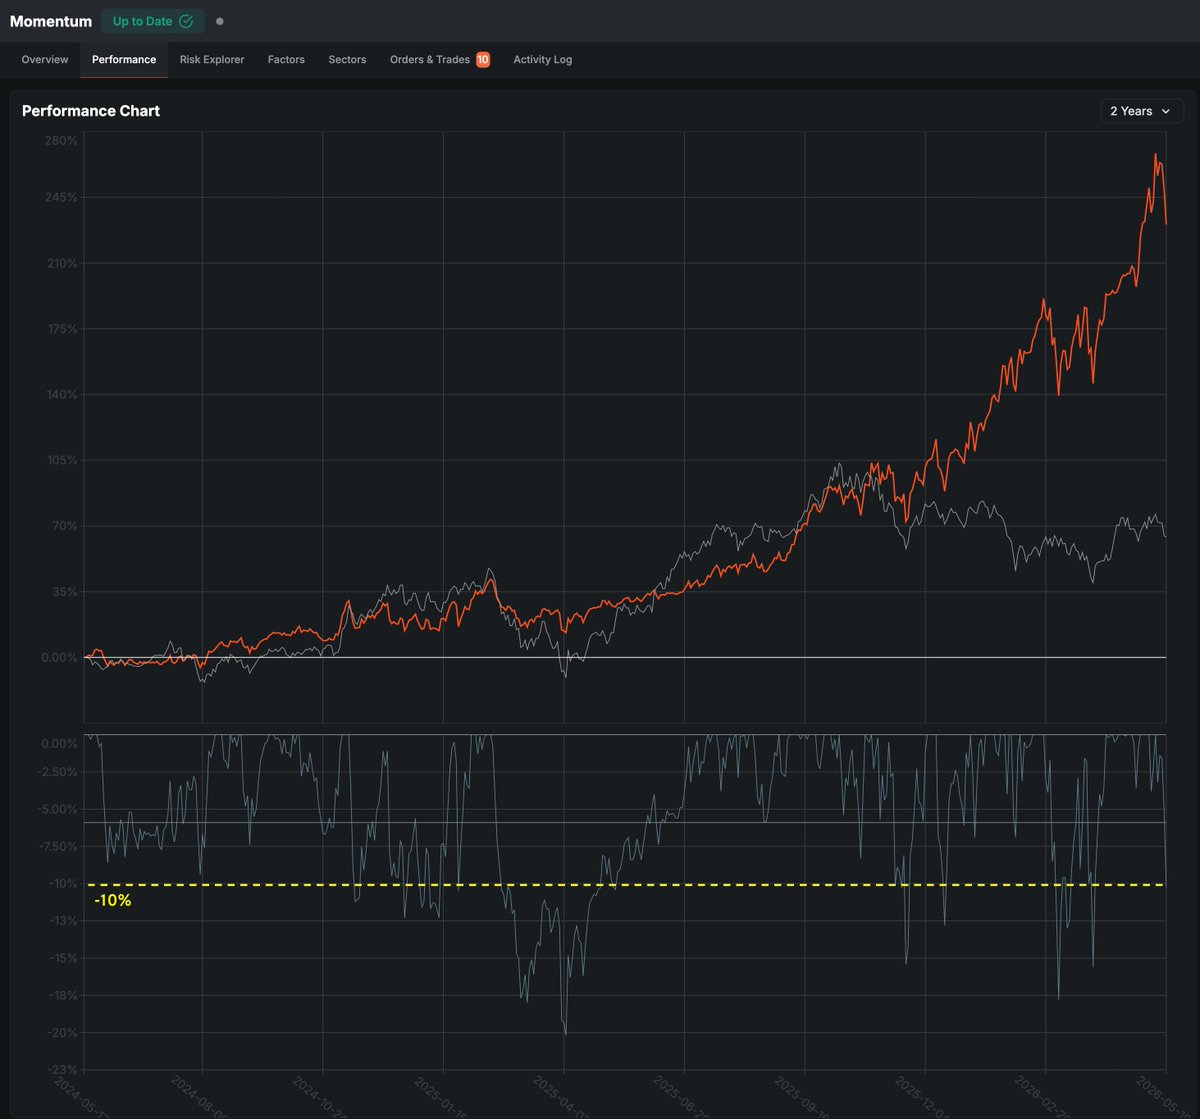
Drawdown in Momentum Factor stocks is already well past the average loss of the past 2 years in just 3 trading sessions. Profit taking was inevitable. Probably some more pain to come, but surprisingly .../
Andrei Sota tweet media
English
1
0
5
326
Andrei Sota
Andrei Sota@Signal_Sigma·
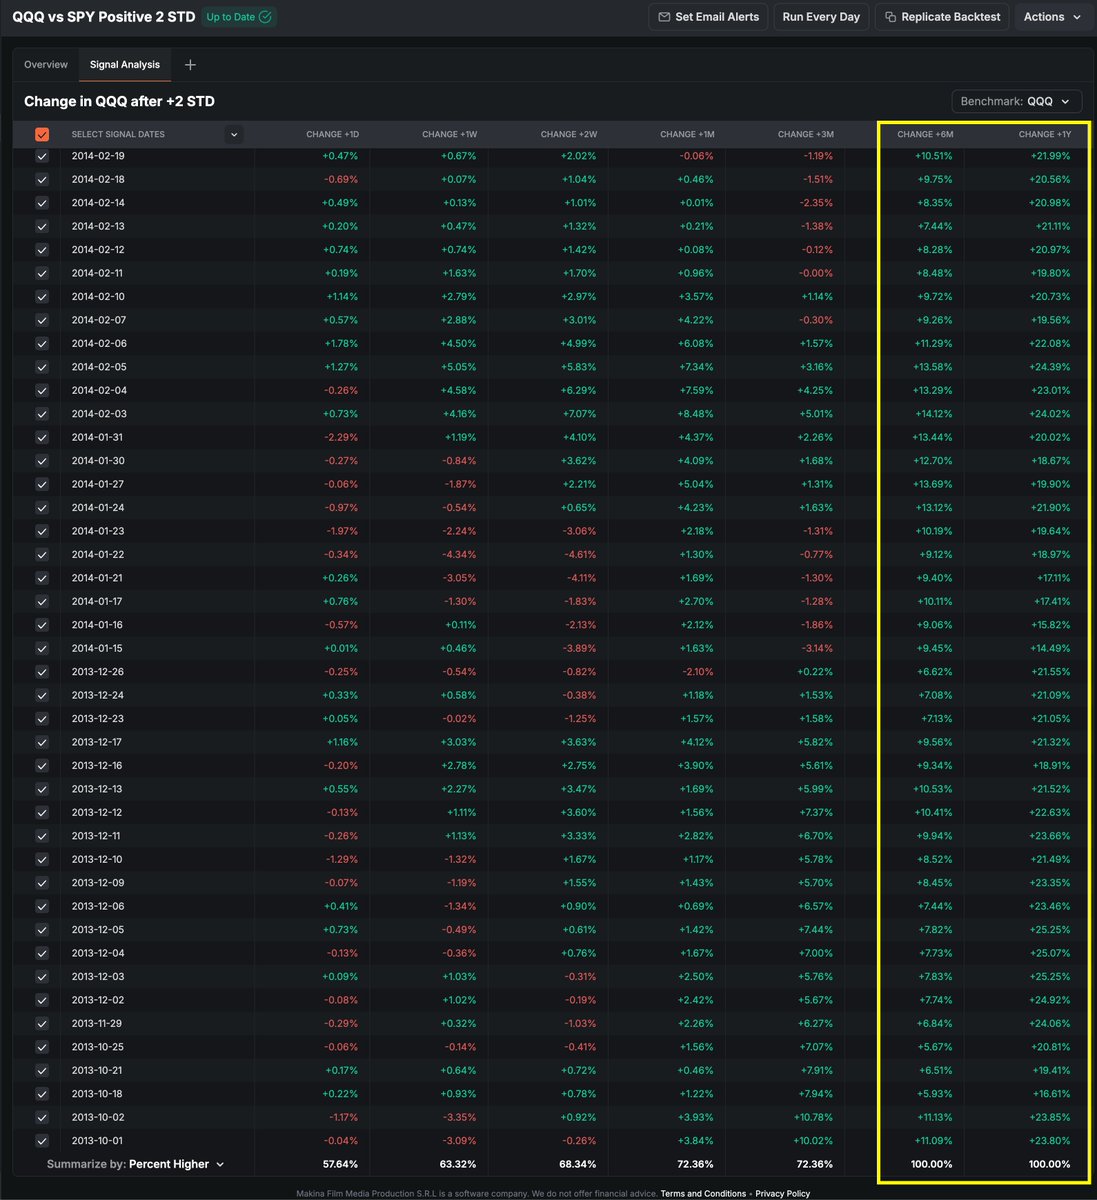
Whenever such a deviation has been recorded, the outcome for $QQQ has been 100% positive both after 6 and 12 Months intervals.
Andrei Sota tweet media
English
0
0
2
153
Andrei Sota
Andrei Sota@Signal_Sigma·
Same story for $QQQ outperformance versus $SPY (measured as Z-Score deviation on the subgraph). Rarely has this been recorded at more than +2 Standard Deviations in the last 16 years. Yet the outcome for either $QQQ or $SPY is not as bearish as one would be inclined to believe.
Andrei Sota tweet media
Andrei Sota@Signal_Sigma

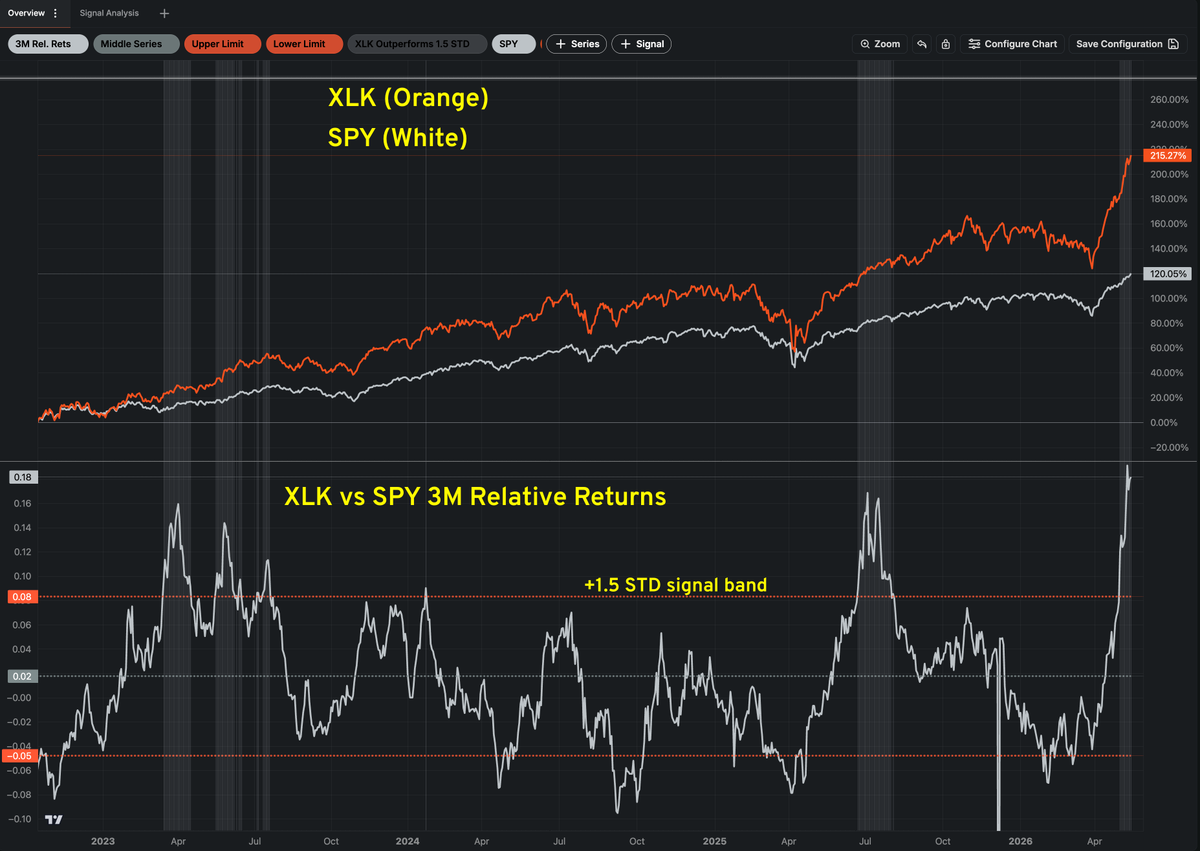
Tech $XLK has outperformed $SPY by 18% on a 3-Month rolling window. That's the highest value recorded this decade and way above anything deemed "normal". This setup appears to have a single logical outcome: disaster for the long Tech trade in one messy and violent unwind. Our reptilian brain sees this and says something along the lines of "line goes up - now line must go down". But is that what history really tells us? /...

English
1
0
2
696
Andrei Sota
Andrei Sota@Signal_Sigma·
In other words, our study reveals that profit taking and a more cautious tape tend to provoke rotations and consolidation out of Tech itself (while the general market outperforms), but the longer term outcome is bullish both for Tech and the broader market.
English
0
0
0
123
Andrei Sota
Andrei Sota@Signal_Sigma·
So what happens to $XLK when the same signal is active? We get weaker return patterns up to the 1-month mark (sub 70% win rates), but median returns start meaningfully diverging after 3-months and more. 3-Month win rates sit at 83%, with ALL 6-Months signals resolved to the upside with +12% median returns.
Andrei Sota tweet media
English
1
0
0
182
Andrei Sota
Andrei Sota@Signal_Sigma·
Tech $XLK has outperformed $SPY by 18% on a 3-Month rolling window. That's the highest value recorded this decade and way above anything deemed "normal". This setup appears to have a single logical outcome: disaster for the long Tech trade in one messy and violent unwind. Our reptilian brain sees this and says something along the lines of "line goes up - now line must go down". But is that what history really tells us? /...
Andrei Sota tweet media
English
2
0
6
1.1K
Andrei Sota
Andrei Sota@Signal_Sigma·
@BergMilton And zooming in on the present situation. In my opinion, that 2% doesn't seem so small anymore. In any case, cool experiment! Though not necessarily predictive.
Andrei Sota tweet media
English
0
0
1
132
Milton W Berg CFA
Milton W Berg CFA@BergMilton·
@Signal_Sigma 2% Does not seem very extreme. Now we must compare the current data to that at the market peaks in 1972, 1987, 200, 2008 and 2020.
English
3
0
19
1.8K
Andrei Sota
Andrei Sota@Signal_Sigma·
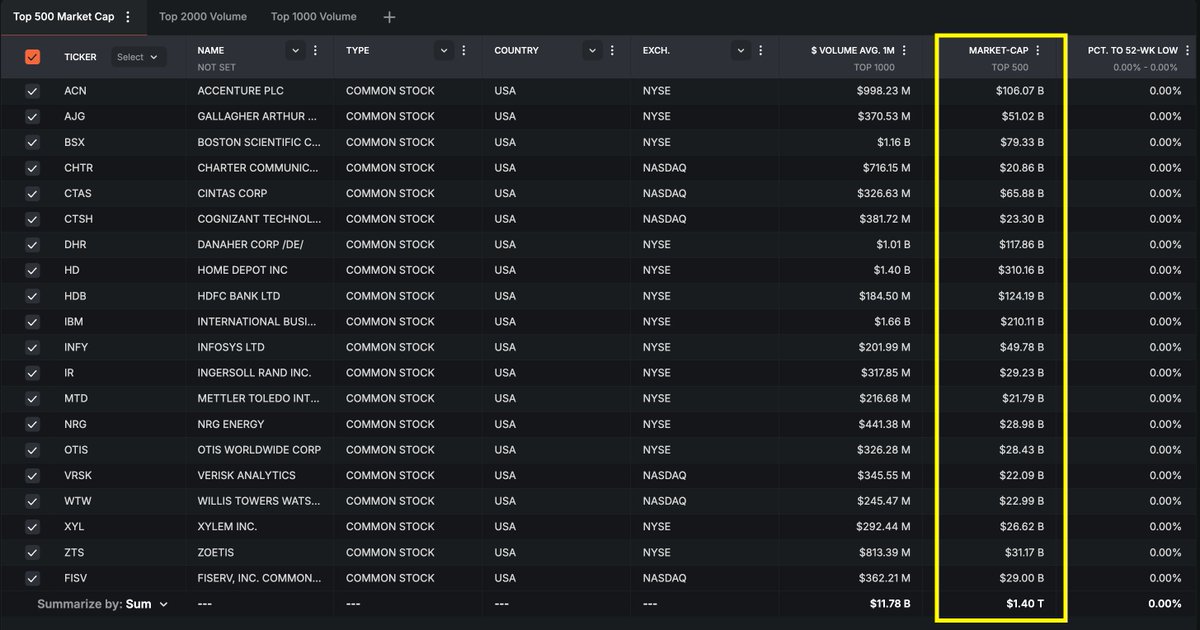
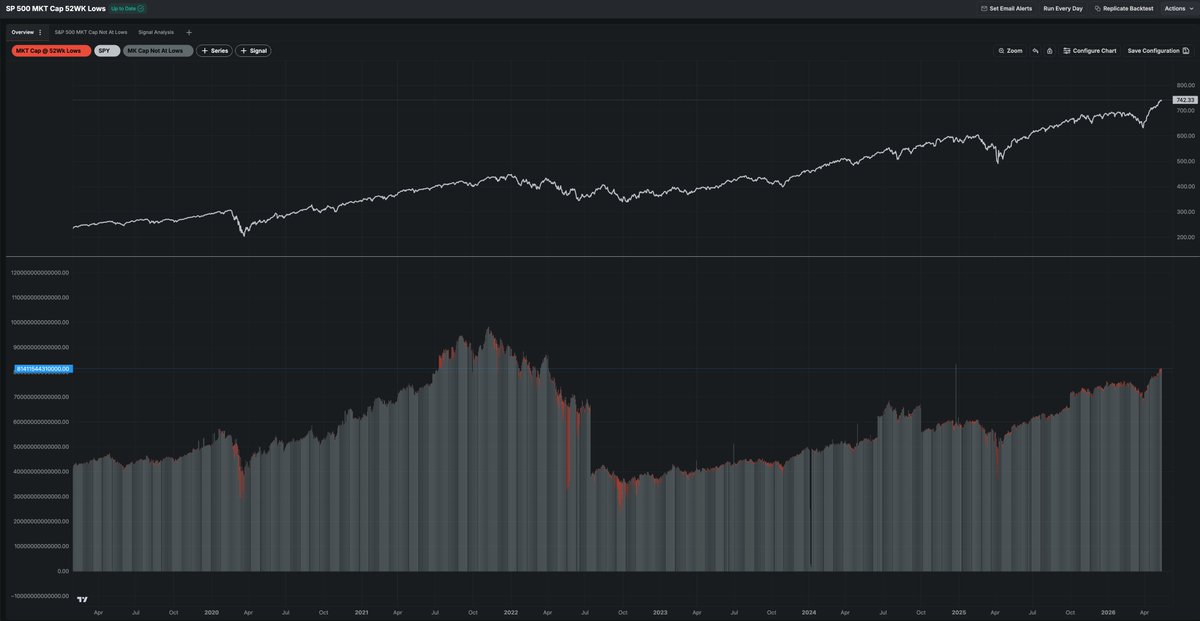
Great question @BergMilton I'll answer that for you. as of yesterday, these 20 S&P 500 stocks were at 52-wk lows, totalling $1.4T in combined market cap. Out of around $68T in total. So that's 2% of the index (in terms of market cap) at 52-week lows.
Andrei Sota tweet media
Milton W Berg CFA@BergMilton

Jason. It would be helpful if you display this in terms of market cap rather than in nominal terms. What percentage of the Sp500 market cap are at new lows compared to historical data.

English
1
1
17
3.9K
Andrei Sota
Andrei Sota@Signal_Sigma·
@BergMilton Zooming in on 2020. There was virtually no such signal back then, as most stocks were *not* at 52-wk lows prior to the crash.
Andrei Sota tweet media
English
0
0
1
131
Andrei Sota
Andrei Sota@Signal_Sigma·
@BergMilton Well, I can help with the data from 2016, though you really have to squint to see it. On the lower histogram you can see the part of the market cap actually hitting the 52-week low (in orange).
Andrei Sota tweet media
English
1
0
1
193
Andrei Sota
Andrei Sota@Signal_Sigma·
Agree. Sentiment is just not where we typically see it in euphoria phases. The market loves to climb a wall of worry and there's plenty of stuff to be concerned about.
Andrei Sota tweet media
ISABELNET@ISABELNET_SA

🇺🇸 S&P 500 This is still a bull market to love, even as the bears are making more noise. May peaks are rare and June has never marked the top for the S&P 500. With new highs within reach, the rally may have further to run 👉 isabelnet.com/?s=S%26P+500 h/t @RyanDetrick $spx #spx

English
1
0
6
714
Jason Goepfert
Jason Goepfert@jasongoepfert·
@BergMilton Hmm, interesting point. I've never seen it expressed that way before. I don't think I have the data to recreate it but will check.
English
2
0
7
863
Andrei Sota
Andrei Sota@Signal_Sigma·
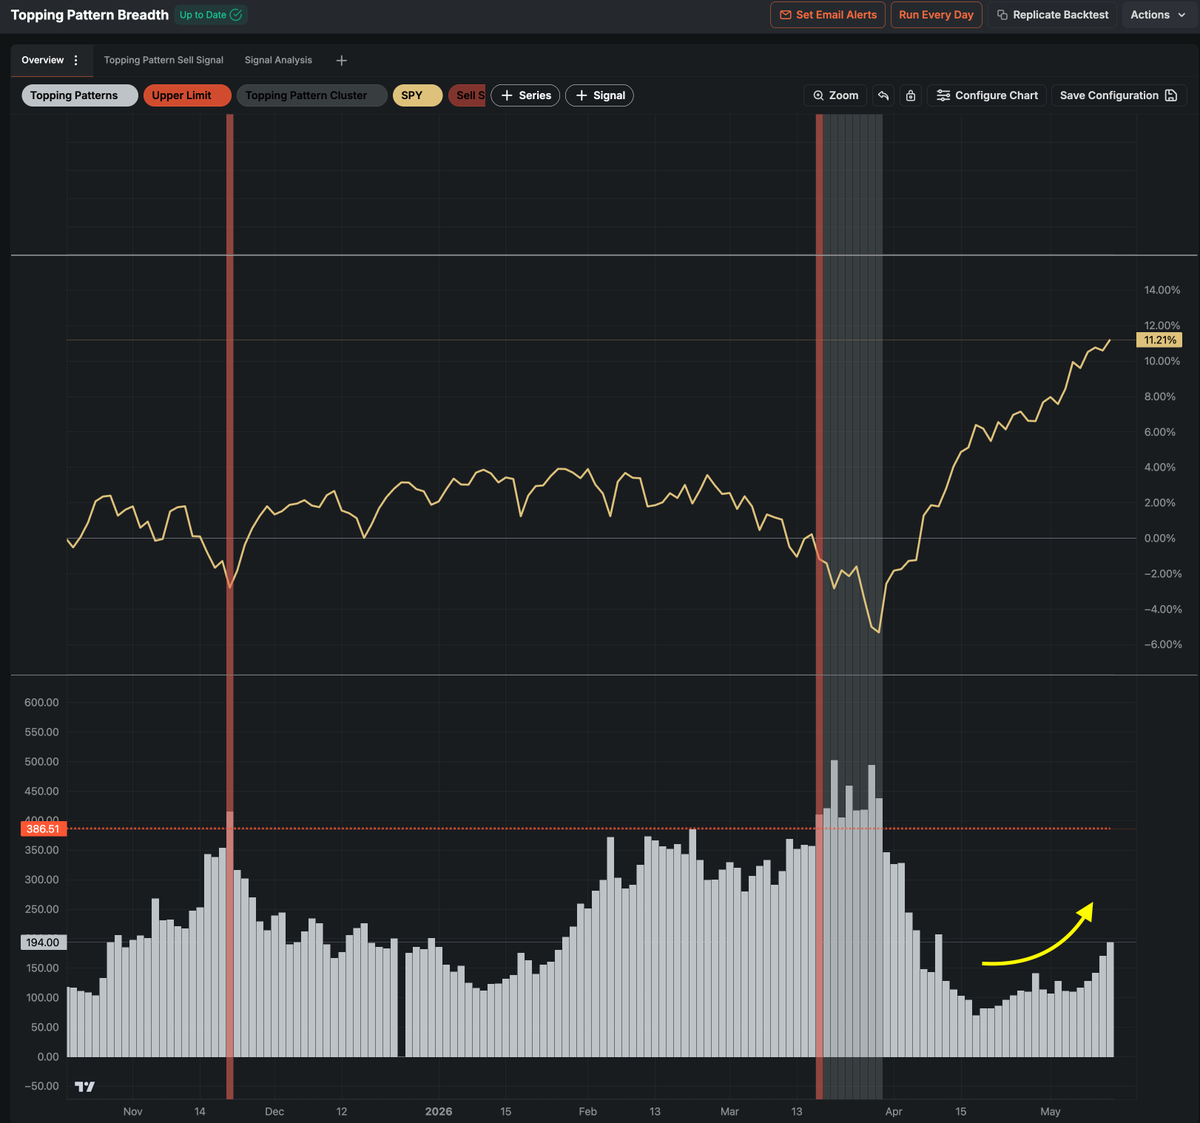
The current rally is narrow - that's certainly true. A breadth measure such as the number of stocks trading in topping patterns has indeed increased since the mid-April lows. However, we are far and away from triggering a sell signal here. Breadth can also broaden and catch up with major market indices.
Andrei Sota tweet media
Jason Goepfert@jasongoepfert

So, again, this is just shouting into a void. But this is the most new lows within the S&P 500 $SPY on a day the index poked above a prior all-time closing high. Ever. Like EVER, ever.
English
0
0
4
672