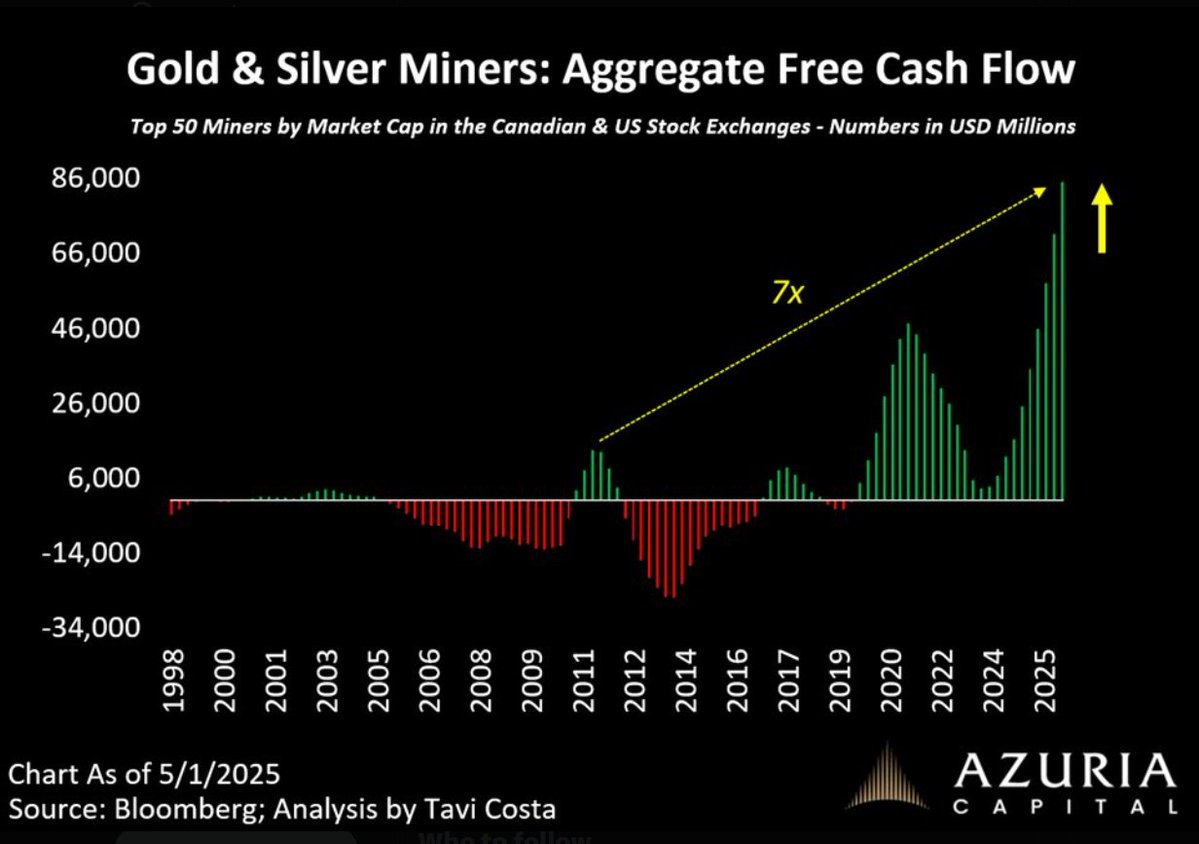
Mining companies are turning into absolute cash printers right now.
Simple breakdown:
Gold (~$4,700/oz):
• Newmont (largest gold miner) → 40-70% higher Free Cash Flow YoY
• ~$3,400–$3,500 profit per ounce after all costs
Silver (~$75/oz):
• Producers like PAAS, HL, AG → 70-150% higher FCF expected
• Keeping $57-60 pure profit per ounce
This is one of the most profitable periods in the entire history of precious metals mining.
Smart money knows exactly what’s coming.
Physics > Paper. 🔥
Who else is positioned for this cash flow explosion?
The free cash flow for gold and silver mining companies is amazing right now, and that is even after the pullback from the high metal prices of January 2026.
I used to have 10 different gold/silver mining stocks in my portfolio, but now I have reduced that to only two.
Aya Gold & Silver is moving from the OTC to Nasdaq on Monday. The ticker is changing also. It was AYASF. Now it will be AYA starting tomorrow.
If you are going to pick one stock in this sector, I think Aya is the silver/gold mining stock to hold for the next 3 or 4 years.
- Producing 6 million oz silver now at Zgounder, their first mine.
- $250+ million in free cash flow
- Building 2nd mine, Boumadine, which will produce 37 million oz silver equivalent (gold, silver, lead and zinc) in 2029 or 2030.
- No stock dilution, 1st mine is so profitable that it funds the huge Boumadine project construction
- Revenue and profits will increase by 6x or 7x, even if silver and gold prices stay at the current levels. If silver and gold go up from here, Aya has even more upside.
@FinX9949770@badcharts1 I was thinking in those terms too. Like I dhould sell Starbucks stocks when coffee price goes up 4-5x ☕️
But with no timing = no accountability
Probably nothing.
Shiller CAPE Ratio (Cyclically Adjusted P/E): As of May 1, 2026, the Shiller P/E stands at approximately 41x -- a level reached only once before in history, during the dot-com bubble in 2000. The long-term mean for this ratio is approximately 17.3, meaning today's market is trading at a roughly 135% premium to its historical average - a feat only surpassed at the peak of the dot-com bubble, when the ratio reached 44.19.
The Buffett Indicator (Market Cap to GDP): As of May 2, 2026, the TMC/GNP ratio has hit approximately 226.8% -- a new all-time high. A separate measure using Federal Reserve corporate equity data puts it even higher, at 232.6%, also a record. The indicator is signaling a strongly overvalued market. This dramatically exceeds the 200% level seen before the 2022 correction, suggesting the stock market's value has continued to detach from the underlying productive capacity of the U.S. economy.
Price-to-Sales (P/S) Ratio: The S&P 500 P/S ratio currently stands at approximately 3.56 -- up from 3.39 in February and near the all-time record high of 3.417 recorded earlier this year. Unlike earnings, sales are harder to manipulate through accounting, making this extreme level a stark warning of price overextension.
Near-Zero Equity Risk Premium: The 10-year Treasury yield held at approximately 4.38% on May 1, 2026, up from 4.29% earlier in the year. Market valuations remain historically elevated, with the S&P 500's forward earnings yield near parity with the 10-year U.S. Treasury -- an equity risk premium of just 0.02%, among the lowest on record. Investors are taking on maximum equity risk for essentially no incremental reward over bonds.
Extreme Market Concentration: The 10 largest companies in the S&P 500 now constitute over 40% of the index's total market cap, driven largely by AI-related returns. The technology sector alone represents 31.2% of the index versus a 9.1% equal-weight share -- a 22-percentage-point overweight. This concentration creates a "passive bubble" where automatic 401(k) inflows disproportionately inflate a handful of mega-cap tech names regardless of their fundamentals.
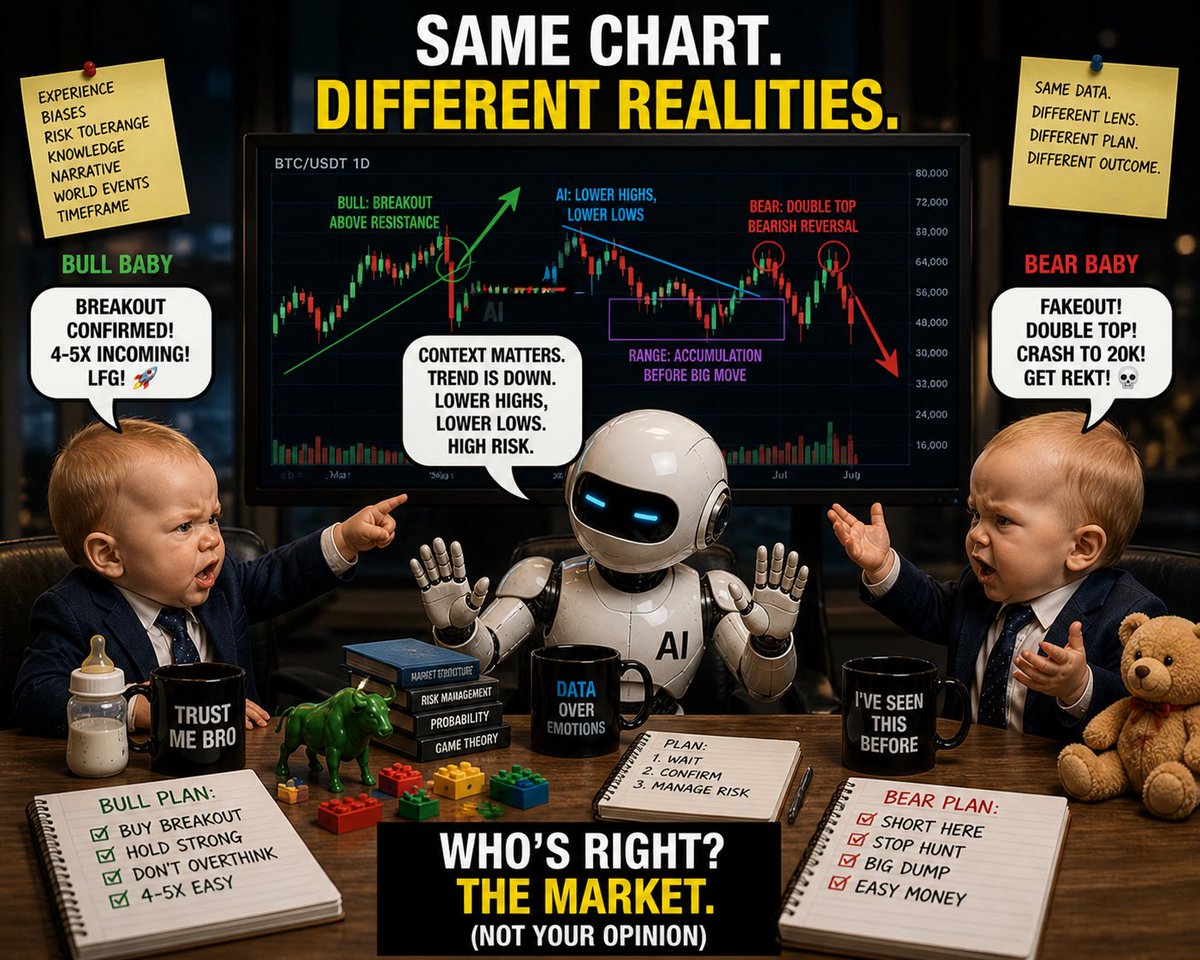
Chart guys in a tie watching the scoreboard thinking it’s the game 😂
Ignore everything else but the candle.. Too much work
🤡Hey, we got AI now 😂
#charts#trader#miners
@badcharts1 Easy explanations don’t survive real markets.
If it was that easy there wouldnt be any losers, or markets 😂
If price alone was the edge…
there would be no edge.
However, if it works for you, do it. 👌🚀
I heard all the bullish narratives saying why gold & silver miners are underpriced and have to go up.
Well, the truth is that it may take time before they offer once again, a lower risk, higher reward opportunity.
Don’t let anyone tell you otherwise.
@SilverSurfer_AG But the chart is what you can actually make gains or losses on. So no need to understand all the moving parts, just trade the actual chart. No noise. Less work.