Slap
5.5K posts


Slap
@Slapy__
CRYPTO & NFT investor , Thread Guru 🧵
idk Katılım Haziran 2022
586 Takip Edilen1.5K Takipçiler

@SynergyMedia_ trust starts when the team is transparent with faces, updates, and clear goals not just a flashy site
English

Sunday vibes ☀️
Everyone says #DYOR. But what really makes you trust a Web3 project / company?
Here’s what we’ve seen after checking out hundreds 👇🧵
GIF
English
@SynergyMedia_ Getting the last bit of work done, then heading out to meet some friends.
English
Friday evening.
For many, that means switching off!
For us, it means ticking off the last to-dos before the weekend calls.
And yes, maybe a cold drink after that. 🍹
How’s your Friday night looking?
#TGIF
GIF
English
@SynergyMedia_ That Gann chart is wild. If the 100k level gives, this whole thing could unravel fast. Everyone’s still leaning bullish, but the cracks are showing.
English
$BTC Weekly Update
Baby, sometimes you are so hard to read 👀
Welcome, dear top buyers and bottom sellers – the big question:
Where are we headed?
Reading the market right now isn’t exactly easy. But let’s break down what’s on the table:
________________________________________
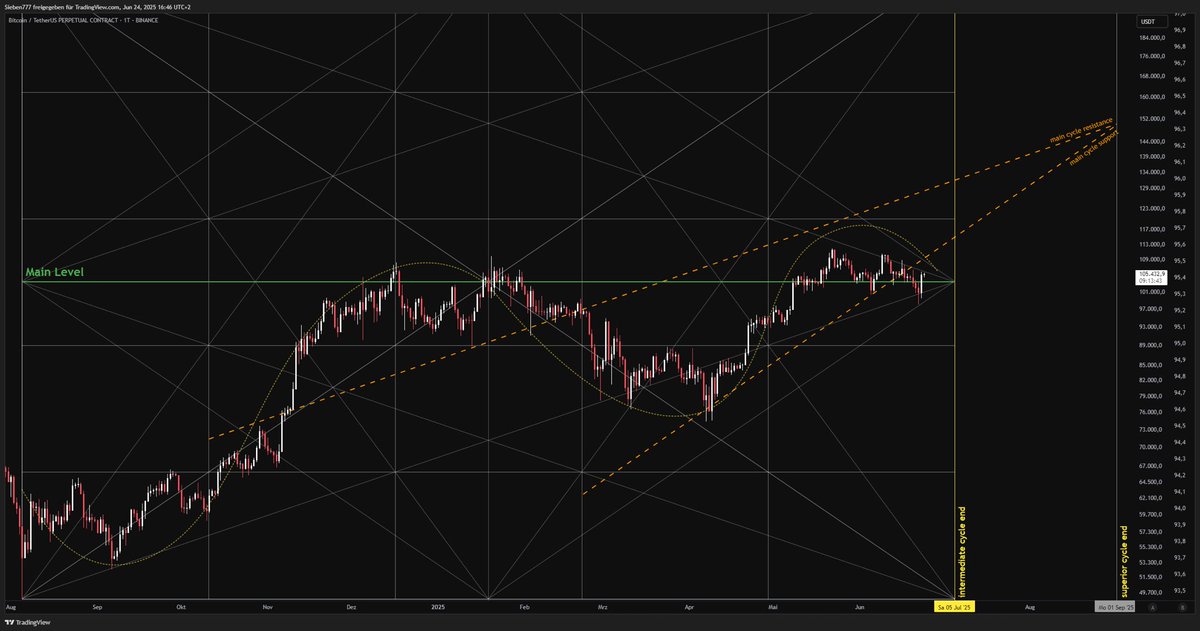
Chart 1 – Divergence, Margin of Error & Crossroads
The bearish divergence is still intact. The Fibonacci projection printed the first low one day late – margin of error is part of the game.
After that first phase came the counter-move. But: That doesn’t automatically mean we’re going higher. And that’s exactly where the current crossroads lies.
________________________________________
Open Interest & Short Overhang
The data shows: Open interest is rising – especially on the short side. In a healthy market environment, this would set up nicely for a short squeeze.
However, BTC’s price action is telling a different story: heavily compressed candle bodies. We already highlighted this setup in the last post – including the Bollinger Bands.
________________________________________
Macro Pressure – Stealth QT Ahead
On the macro side, headwinds are building: The US Treasury plans to boost the Treasury General Account (TGA) – the government’s “savings account” at the Fed – from around $350B today to about $850B by September 2025.
That means $500B in new debt issuance (mainly T-Bills) will hit the market. This pulls money out of the private sector – away from equities, bonds, and crypto.
This is not a one-off; it’s a “stealth QT” that amplifies the Fed’s ongoing balance sheet runoff.
________________________________________
T-Bills vs. Bitcoin – The Capital Tug of War
T-Bills currently yield around 4.8% (3-month), directly competing with risk-on assets. If rates stay elevated, capital will favor safe paper over #Bitcoin – guaranteed price pressure.
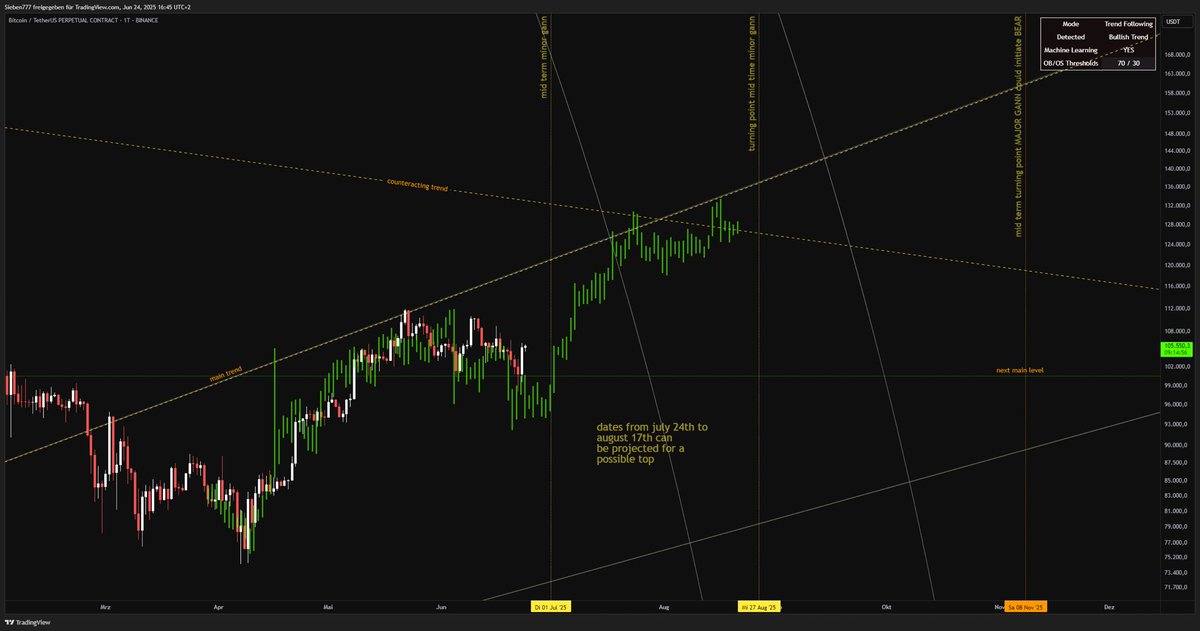
In August, weekly T-Bill auctions are scheduled (e.g., $50B in 52-week bills on August 5). The full $500B liquidity drain could push BTC down as much as –20% – which brings us to Chart 2.
________________________________________
Gann Chart – Price Magnet or Trapdoor?
Our Gann chart marks 100k as a horizontal quadrant boundary – almost exactly matching a potential 20% drop from the ATH at 123k.
Whether the green triangle “price magnet” still holds will only be clear by the end of August. A final liquidation pump to wipe out shorts, followed by the overdue correction, is entirely possible. Short-term: bearish. Macro: risk-off.
________________________________________
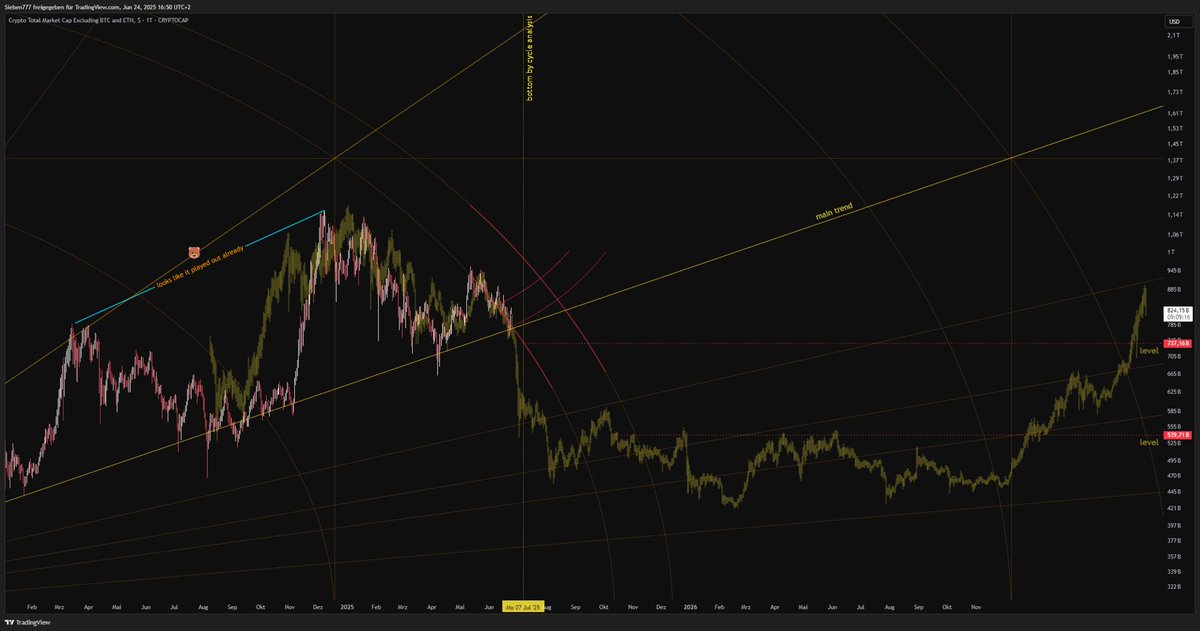
Chart 3 – Déjà Vu or Straight Sell-off?
Chart 3 shows a fractal from the last cycle’s top. This means we may not get a pump at all – the market could dump directly instead.
Yes, that’s an unsatisfying outlook, but right now there’s only one truth: This is not the time to be bullish.
We’ve highlighted bullish momentum ever since the bottom. If you used that window, you’re in a strong position. Now it’s time to play defense.
________________________________________
💡 Note: The levels in Chart 1 only become active once 100k is broken to the downside.


English
5 mistakes almost every project makes and how to avoid them. 🧵⤵️
1. You’ve got a vision, but no strategy.
If you don’t know who you’re building for, where to reach them, or how to communicate your value – you’re not building a project. You’re gambling on hope.
A clear roadmap and positioning are the difference between traction and silence.
GIF
English
@SynergyMedia_ long term thinkers always saw what bitcoin truly stands for
English
For over a decade, people have been saying the same things about Bitcoin.
“Too volatile.”
“Too slow.”
“No intrinsic value.”
And yet… it’s still here.
Because it was never about buying your morning coffee.
It’s about something much bigger:
🧠 Taking control of your money.
⏳ Choosing time over interest.
🛡️ Choosing freedom over dependency.
If you’re looking for fast payments, there are options.
But if you understand the bigger picture, you stick with Bitcoin.
Not for the next week.
For the next decades.

English
@SynergyMedia_ dai’s model is complex but way more transparent than usdt or busd
English
Web3 Puzzle 🧩
Which of these stablecoins is algorithmically backed (not fully backed by cash or assets) ?
English
@SynergyMedia_ love how they mix gann cycles with fib levels, brings a whole new angle to btc analysis
English
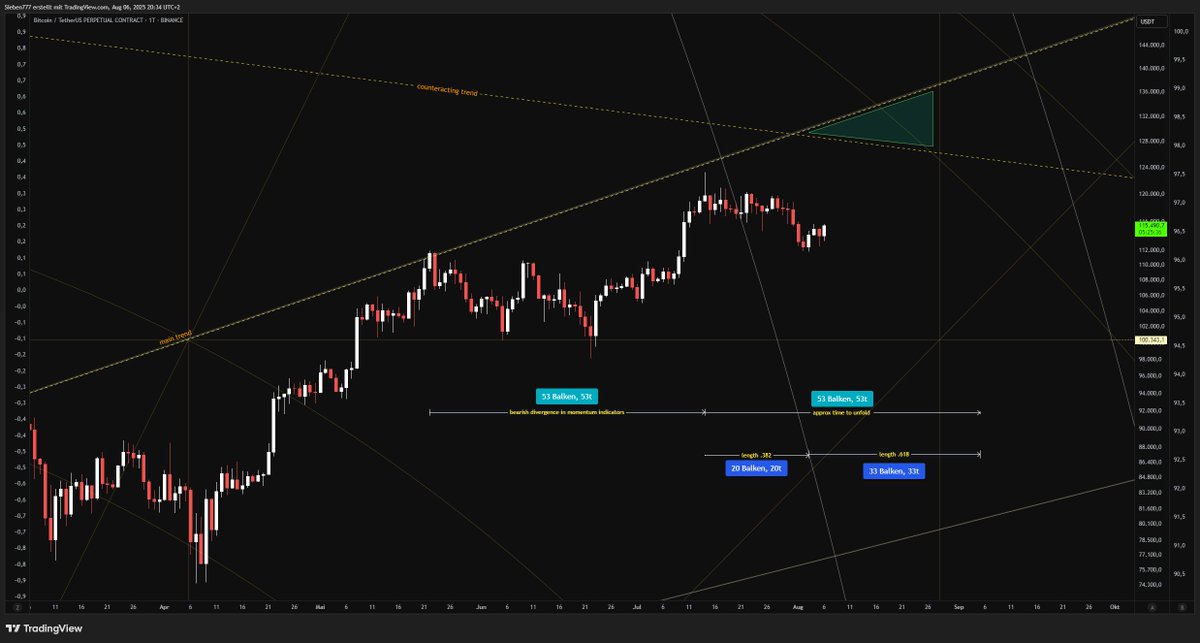
BTC Weekly Update
Over the Top 👀
Just like BTC, we’re back! Well, not entirely. Our analyst is still on vacation — but even from a retreat in nature, surrounded by green candles, he’s bringing you a short update. How lovely!
But the question remains: how much longer will the green last? Given the messy price action and fading momentum, it seems only a matter of time before Bitcoin makes its next move downward. The recent pump, even in the futures markets, happened on declining volume — which has created bearish divergences in both the RSI and MACD. While the MACD hasn't fully confirmed a divergence just yet, the RSI has done so quite clearly.
This divergence has been developing over 53 days, and now we can explore potential timelines for when it might resolve. (A little learning moment!)
You multiply the number of days by key Fibonacci levels. Here's what that looks like:
53d × 0.382 = approx. 20 days
53d × 0.5 = approx. 27 days
53d × 0.618 = approx. 33 days
Now, the big question: which of these durations is the right one? To find out, we turn to good old Uncle Gann, who considered time the most influential factor in price movements. A direct quote:
“Prices are determined by time. Time causes price to change. Time angles are resistance to price.”
A completely different perspective compared to modern technical analysis — and precisely for that reason, quite fascinating.
Long story short: in our Gann-based cycle analysis (see Chart 1), the main trend and the counter-trend converge in early August. This aligns nicely with the 53-day calculation and the 0.382 Fib level. A confluence we consider meaningful.
It’s quite possible that $BTC will hover around the 113–110k range, only to reach a peak near 131k in early August. From that level, we expect a sharper correction to follow — especially if we see lower highs in the RSI and MACD.
Meanwhile, Ethereum isn’t looking too bad either (see Chart 2)! $ETH smashed through the predicted resistance like a hot knife through butter and is now consolidating above that volume barrier, which has turned into support.
What’s more exciting: if we compare the duration of previous BTC dominance cycles, altcoins could continue to drift sideways until mid-August — before Bitcoin finally passes the torch (and liquidity), bringing retail investors’ dreams to life. Dare we say it… an alt… season? 😜
For that to happen, Total3 would need to break through the green resistance (see Chart 3). We even found a perfectly matching fractal (coincidence?) that fits the projected #BTC dump scenario — including a V-shaped recovery.
Some altcoins are already performing strongly and outperforming BTC. We still believe that (selected!!!) altcoins will pump. Which ones might those be? We’ll take a closer look in next week’s report.
Stay tuned! 😎


English
@SynergyMedia_ Finally, someone who gets it. Strategy and creativity should always go hand in hand. This is how real brands grow.
English
Creative team or strategy team?
Why choose when you can have both? 😎
We deliver campaigns that don’t look like copy-paste.
Designs that get noticed.
And plans that don’t fall apart when the market twitches.
In short: we’re the team that thinks with you, not just for you 🤝
No drama. Just Synergies.

English
@SynergyMedia_ at this point if you're not in you're just watching history print from the sidelines
English

@SynergyMedia_ charts ping louder than my alarm now, it's becoming muscle memory
English
Sunday. 30 degrees in Germany 🔥
The sun’s out and somewhere in the shade, someone’s still checking the charts. 👀
How often did you catch yourself today? 😁
A) Just a quick look… like 20 times
B) Only when it pings. Which is… a lot
C) It’s my wallpaper – does that count?
Be honest!
GIF
English
@SynergyMedia_ I’ve learned the hard way that thinking twice can save you a lot of regret 😅
English

BTC Weekly Update
Long time no see, Mr. Waiting Room 😁
Basically, not much has changed since our last update. As anticipated by Gann, crypto remains in a transitional phase, which is likely to play out in the first week of July. For what feels like forever, BTC has been playing ping-pong with us — featuring lower highs and lower lows. Essentially, a bearish structure.
In Chart 1, we acknowledge this structure and assume that another sell-off is ahead. The purpose of this move, in our view, is to create fear and harvest liquidity. Although the yellow fractal suggests a following uptrend, that’s far from a done deal. Whether we actually move higher afterwards must be analyzed step by step — once the next big move has played out and we are likely “blessed” with yet another sideways phase.
This outlook is based on our Gann cycle in Chart 2 and the upcoming trend change. Important: A Gann trend reversal does not automatically imply a reversal in price action. It simply means a new trend is likely to emerge — whether that’s sideways, bullish, or bearish will only be revealed in the days following the shift. It’s entirely possible that further downside follows. Therefore, we urge caution: Nothing is set in stone with BTC, even if the broader structure still appears bullish. A fitting fractal is no guarantee that the future will unfold exactly as projected.
Structurally, we currently see a classic Wyckoff distribution, which aligns with the fractal. However, we can’t confidently anticipate whether BTC will push into another uptrend. On the positive side: Our cycle chart doesn’t yet indicate a regular bottom. This means there’s still theoretical room for expansion and time left before the expected final bottom. A strong confluence zone for a preliminary bottom appears around mid-September. This implies that a new BTC top would need to occur before then — and time is running short.
What fits the bigger picture: When $BTC runs out of steam, it often triggers a liquidity rotation within the crypto market. We’re not giving up hope for an altseason just yet — despite rising BTC dominance. Chart 3 reflects our expectations regarding altcoins. It may still take a while before momentum kicks in there.
Conclusion:
Caution is the order of the day and a stop-loss is a friend, not a foe. 🙏


English
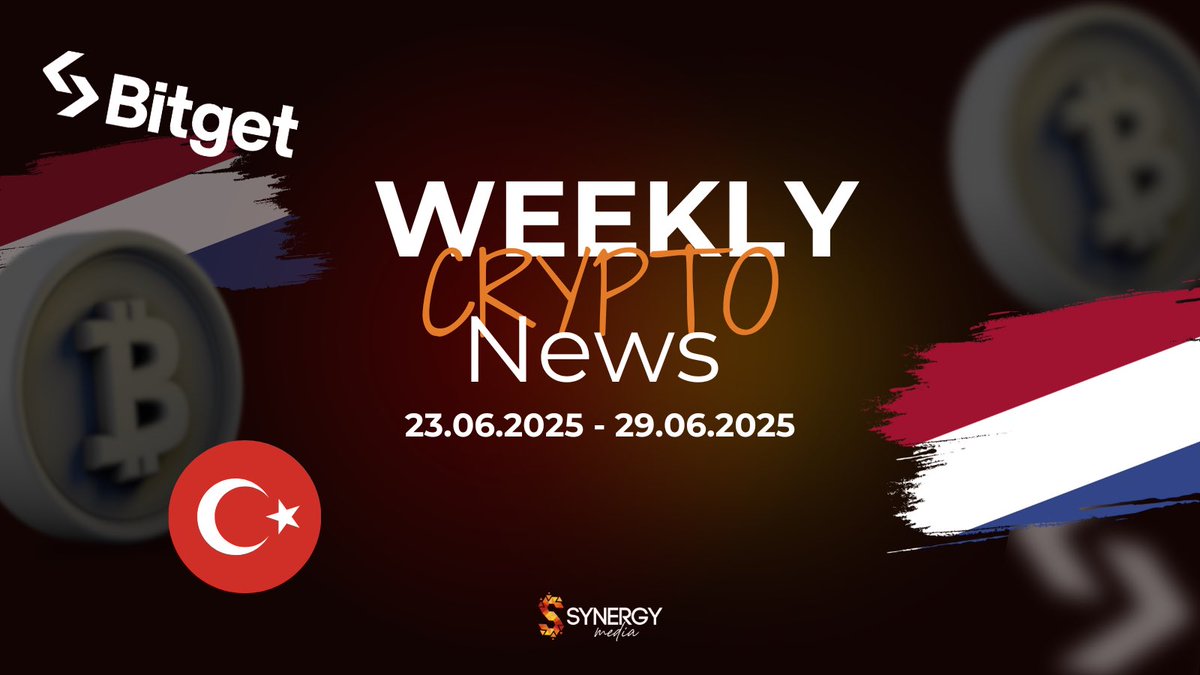
Weekly Crypto News are live!
💰 Bitcoin at $107,360 – Market stays in “Greed” as optimism holds firm despite global tensions.
💳 Crypto cards gain ground in Europe – 45% of all transactions under €10, stablecoins dominate.
🇳🇱 @bitvavocom gets MiCA license – Dutch exchange expands access across the EU.
🏁 @bitgetglobal partners with MotoGP – Launches at Italian GP to grow crypto’s mainstream appeal.
🇹🇷 Turkey enforces stricter crypto rules – New regulations target financial crime and transparency.
Full update on our blog:
🔗 synergy-media.io/weekly-crypto-…
English
BTC Weekly Update
Fractals
A pattern within a pattern within a pattern..😮💨
A fern is a fascinating plant, isn’t it? At first glance, it looks delicate and elegant. But a second, deeper look is worth it: the large leaf consists of many smaller ones – and those of even smaller ones. They all share one thing: their shape, their structure, their pattern. And this pattern repeats – over and over again.
This principle is called a fractal: a pattern that repeats on different levels, no matter how far you zoom in or out.
It’s the same in the markets:
What happens on the monthly chart often looks very similar to the weekly, daily, or even 5-minute chart. Movements like rallies, pullbacks, or consolidations follow the same patterns – just on different timeframes. The structure of the whole reflects itself in the part. A fractal is like a mirror image of the big picture in something small – and every small window of time reflects the larger trend. Those who recognize this see order in apparent chaos.
So why all the philosophy? Get to the point!
In our last post, we issued a clear warning about the upcoming summer solstice – and *oh baby*, did we nail it or what? Now, Crypto Twitter is once again wondering which way is up. Can’t really blame them. The markets are in emotional turmoil – with “orange man” constantly hitting the buzzer and the Middle East seemingly on the verge of ignition.
But if you zoom out, you’ll see: not much has happened yet. On Chart 1, we can see that the cyclical trend supports have held. Yes, we’ve dipped below the main cycle support – but we don’t see that as a red flag. Currently, we expect a consolidation phase until the reversal point of the minor cycle. The convergence of multiple trend fans supports this theory, as do the neutral readings from our indicators.
On Chart 2, we return to our opening thought:
After in-depth fractal analysis of past major cycles, we conclude that the “2021 Playbook” is being used again. We already saw Wyckoff distributions playing out – for example, in December 2023. In fact, multiple Wyckoff scenarios can be found throughout this current run.
Why is that?
Because it’s a relatively illiquid, futures-driven market – easier to manipulate. That’s really all there is to it.
We’ve included the fractal pattern to reinforce our consolidation thesis. It suggests that we could stay in this sideways movement until early July. The dates shown are meant as rough guidance. Whether a pump will follow remains to be seen. We remain bullish and lean toward the depicted fractal scenario – but the current news cycle is a variable not to be underestimated. A single wrong word from Powell, and markets could turn red. He’s speaking live twice this week – so keep your eyes open.
To account for these uncertainties, a trader must always be prepared for both scenarios. That’s why we’ve also brought the TOTAL3 chart (Altcoins) in two versions: one with a bullish and one with a bearish outcome of the current price action.
Remember? 👀
A few weeks ago, we showed you the TOTAL3 chart with a note on the “Time of Transition.” And as the Bollinger Bands evolve – aligning with our Gann analysis – it won’t be long before we see a decisive move. This move could very well be explosive – in either direction.
What we currently see as a positive sign:
The bullish retest of the main trend fan and the rising Gann arcs, which could act as a catalyst for a new uptrend.

English
English
Web3 went beach mode - and we made sure you felt it.
Big shoutout to @bitgetglobal & @SweatEconomy for teaming up with us on this bold summer drop.
Treasure hunts, crypto clues, and real community vibes.
This is how we do it.
#SWEATxBitget #SynergyMedia #Web3Events
Bitget@bitget
Zrće Beach just turned into Web3's version of Pirates of the Caribbean 🏴☠️ We teamed up with @SynergyMedia_ and @SweatEconomy to drop a crypto treasure hunt. 📍 Clues were hot, sand was hotter, and the prizes? Let’s just say some lucky folks are now flexing more than just abs. If you found us on the beach, congrats—you’ve officially unlocked #SWEATxBitget summer questline. #MovementEconomy #WalkIntoCrypto #EventwithBitget
English
GM and happy weekend to everyone 🌞
Sun’s out, coffee’s strong, vibes are good. That’s all you need.

English