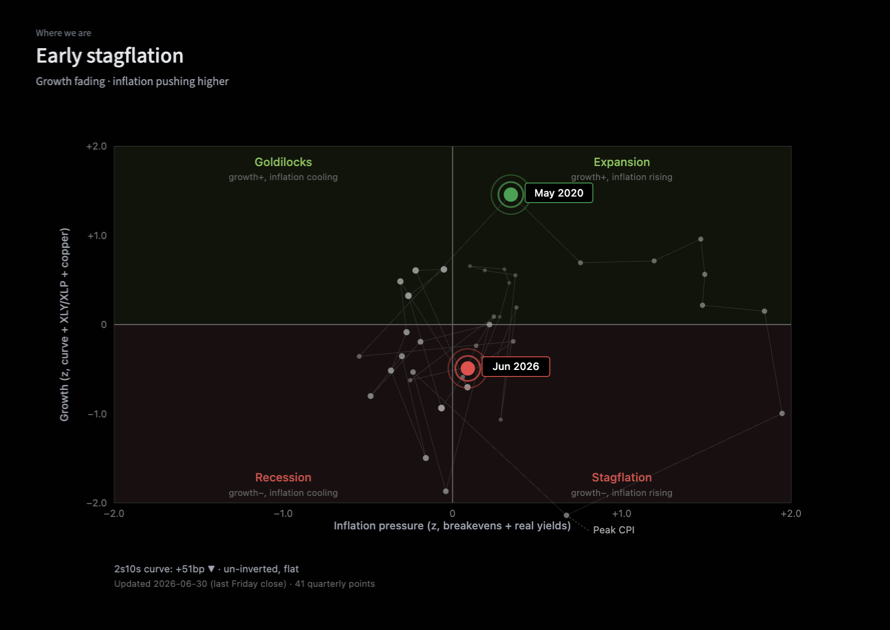
srojasmacro

11.8K posts

srojasmacro banner
srojasmacro

srojasmacro

@Srojas78

Multi-asset investor · Macro, risk, and volatility models · Building toward AI-driven decision systems

South Florida USA Katılım Ekim 2009
376 Takip Edilen664 Takipçiler
srojasmacro
srojasmacro@Srojas78·
Today's bias 
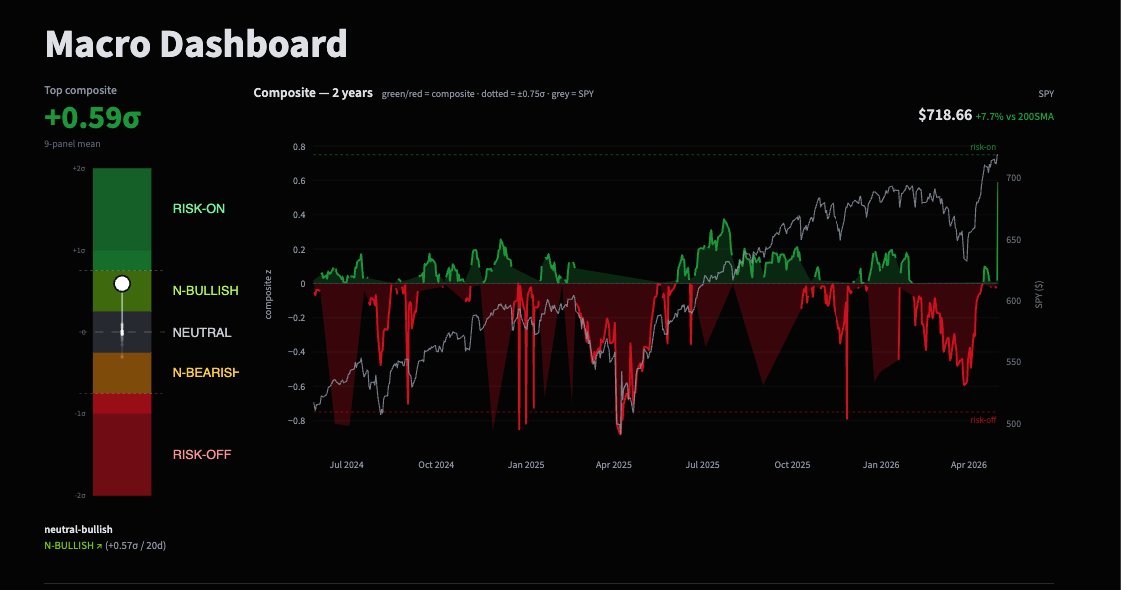
SPY is extended at $720 (+7.8% vs 200SMA, NTM PE 20.8x = "slightly rich") with the composite improving (+0.20σ, +0.51σ over 20d) on a tape-led rally — ride the regime turn, but don't add into the overbought watch and the 30Y at 4.99%. What changed 
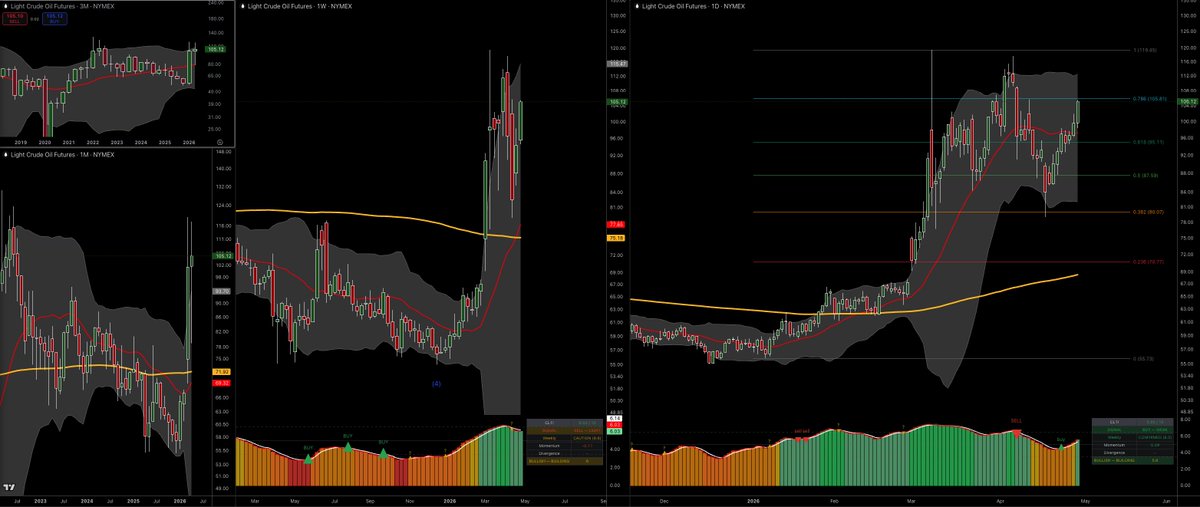
SPY pushed to $720 (3M chart shows new highs) — daily tape now flagged OVERBOUGHT–WATCH. Move is real but stretched; fresh longs have poor risk/reward here. Long-end yields jumped: 30Y 4.99%, 10Y 4.46%, 2Y 3.97% — bear-steepening pressure returning. EFFR-vs-30Y spread now +1.35% (curve says fully accommodative). Term premium 0.65% and rising again. Risk panel +0.55σ confirms no stress — VIX 17.7, VIX/VIX3M 0.87 (deep contango), HY OAS contributing +0.89σ. Credit is calm even as rates back up. Sentiment -0.46σ stays the divergence — NAAIM exposure -1.13σ (managers underweight) while tape rips; this is fuel, not a top signal yet. Macro panel -0.33σ, Liquidity -0.62σ unchanged — net liquidity still tightening (-4.2% YoY), bank reserves draining, M2/Gold ratio at 0.67/10. The structural drag the weekly flagged is still there. 
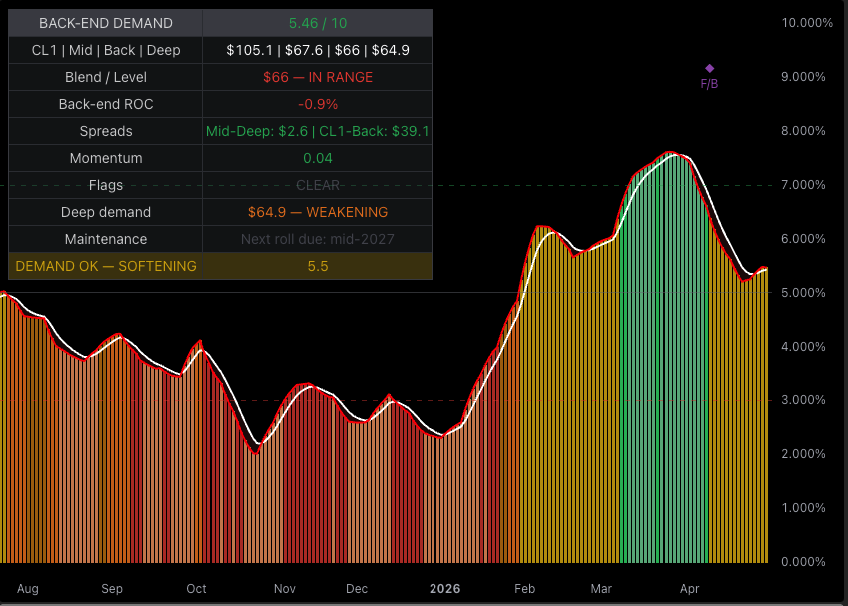
Earnings Health 4.78 → "WEAKENING, BULL AT RISK" — NTM PE 20.8x against softening earnings is the core fragility under this rally. Today's risk 30Y above 5.00% closes the rate-cut narrative and pressures the PE multiple directly; currently 4.99%, one bad print away. 
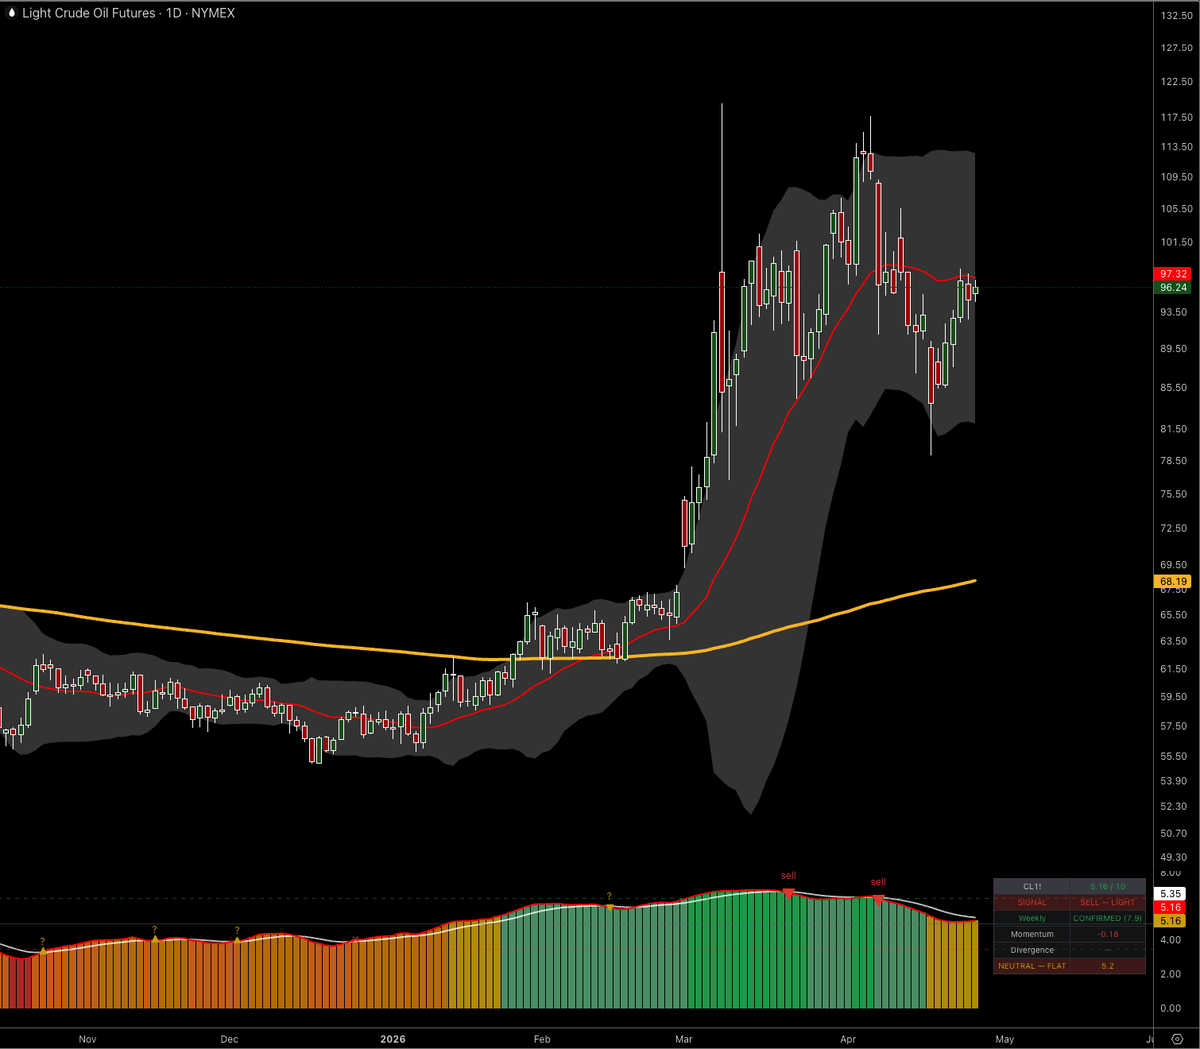
SPY losing $716 (yesterday's pivot on the 1D chart) flips daily momentum and likely triggers the overbought-watch unwind toward 700 / 671 (50d). DXY at 98.29 sitting on 200d — break lower would re-fuel risk; break higher (with yields up) is the squeeze that hurts everything. Cross-check Formal Composite (5.10 NEUTRAL) and Cycle (WEAK 5.5) disagree with the tape (+0.67σ Technical, +0.55σ Risk) — formal score leads on size (don't size up; structural backdrop is mediocre), tape leads on direction (stay with the trend until breadth or credit cracks). Translation: hold longs, don't add, tighten stops under $716.
English
0
0
0
16
Dr_NEOphyte
Dr_NEOphyte@Dr_NEOphyte·
@nickgiva1 Nice. It’s amazing how LLMs are unleashing creativity. Bullish.
English
1
0
1
249
Nick G.
Nick G.@nickgiva1·
So, feeling bored yesterday, I asked Claude Design to make me a new website. I then smacked it into Claude Code and it came up with this: charityhedgefund.com What do you think? Certainly more modern that it used to be...
English
11
0
16
4.8K
srojasmacro
srojasmacro@Srojas78·
@nickgiva1 Looks more aesthetically pleasing and UX feels more responsive than old version. Claude leads all coding from my experience. I'll share some macro stuff I've worked on via subscriber account DM
English
0
0
1
9
srojasmacro
srojasmacro@Srojas78·
What stage of the business cycle are we in?
srojasmacro tweet media
English
0
0
0
21
srojasmacro
srojasmacro@Srojas78·
Week in review Quiet week on the surface, structurally informative underneath. The formal Macro Health Composite traced a shallow dip-and-recover path: 5.08 Monday → 4.92 Tuesday → 4.94 Wed → 4.97 Thu → 5.00 Fri, finishing essentially flat (+0.08σ delta) and locked in NEUTRAL with the RATE-CUT DRIVEN @ 5.6 classifier unchanged all week. SPY, by contrast, did the work — +0.94% on the week, closing $718.66, +7.7% above the 200SMA, and hitting fresh wave-(5) territory near $724 on the weekly Elliott count. The dashboard composite z is now +0.59σ (9-panel mean), 20-day change +0.35σ, and the regime label has migrated to N-BULLISH. So you have price and dashboard z confirming risk-on while the formal composite stays pinned at the neutral midline — that's the key tension this week. Underneath, the rotation was clear. Tuesday's earnings_health score crashed from 6.07 → 4.75 (one print, likely an EPS-age/staleness flag plus the "Bull at risk" flip on the earnings panel) and stayed there; that's the single biggest structural change of the week. Master_risk score crept higher every day (4.01 → 4.45) as the master_composite caution-stabilizing label held but VIX bled lower (16.98, contango 0.83). Yield_curve held flat at 5.50, macro_backdrop pinned at 4.45 — the slow-burn channels didn't move. Liquidity_cycle ticked up marginally to 6.41. The week's color came from commodities and breadth. Oil_momentum_63d sits at +3.94σ (extreme), CL1 vs 100w at +1.75σ, OVX at -2.08σ — the supply-shock crude rip from March is now mature and volatility has collapsed around it. Advance_decline at +1.56σ. Gold is the mirror image: gld_copper_ratio -2.55σ, gld_realized_vol -1.76σ, GLD itself printing a NEUTRAL-FLAT signal off its wave (4) pullback near $423. What changed structurally Earnings health stepped down hard. Score dropped 6.07 → 4.76 on Tuesday and never recovered. The EPS age flag is "CRITICAL — UPDATE NOW" and status is WEAKENING / BULL AT RISK. That's a structural notch, not noise — buyback cycle is also at 4.52 with "BUYBACK RETREAT" and "ISSUANCE TIGHTENING — BUYBACKS AT RISK." Demand pillar is weakening even as price makes highs. Master_risk score quietly improved every day (4.01 → 4.14 → 4.24 → 4.34 → 4.45). Slow grind, but it's the offset to the earnings deterioration and explains why composite stayed flat. The VIX panel cooperated — VIX/VIX3M 0.83, VVIX 95, realized vol 11.5%. SPY closed at +7.7% over 200SMA with RSI 71 on the weekly composite. That's a stretched tape on the "slightly rich" PE multiple (23.3x, NTM 20.8x, +16.6% vs fair value). Position is overbought into a wave (5) target zone ($724.87 weekly). Cross-asset divergence widened. SPY/GLD finally turned up off its multi-month downtrend; USO/GLD blew out to multi-year highs. Gold-linked panel z is -0.48σ vs Oil +0.17σ vs Crypto +0.45σ — the commodity complex is bifurcated, with industrial/energy bid and monetary haven pressed. SPY weekly bias Directional lean: Cautiously long / fading-rallies posture. Conviction: low-to-medium. The structural thesis: the formal composite is neutral (5.00), classifier is RATE-CUT DRIVEN @ 5.6 ("Fed driven — watch for fade" per the dashboard), and SPY just printed a wave-(5) extension into $720+ with NTM PE 20.8x and earnings health weakening. That's late-cycle, Fed-supported price action — not a structural breakout. The dashboard composite z at +0.59σ and N-BULLISH regime says don't fight the tape on Monday/Tuesday, but the asymmetry has flipped: upside from here requires fresh fuel (earnings beats, oil cracking lower, real-yield relief), while downside has multiple primed catalysts (earnings stale, buybacks retreating, oil at $102 with backwardation, VIX at 17 with nowhere to go but up). I'd be tactically long but uninterested in adding into strength; any close back below the weekly 5MA / $700 would be the first warning. The "FED DRIVEN — WATCH FOR FADE" label on the master_composite is doing real work here. Cross-asset shifts: Duration / long-end bonds: 30Y closed 4.96% (just under the 5.00% line in the sand), 10Y 4.42%, 2Y 3.88%. Term premium 0.65% and easing slightly per the TPSO panel ("ACM TP rising -0.02"). Real 30Y synth at 2.76%, real 10Y at 1.99%. Real rates remain restrictive; the AI mentor's framework [1][6][10] would call this "term premium doing the heavy lifting" — modestly equity-negative if it pushes higher, neutral if it consolidates. SPY implication: neutral-to-mild headwind; a 30Y break above 5.00% would be the trigger to cut equity beta. Curve: 2s10s +49bp, 2s30s +108bp, 5s30s +94bp — bull steepener intact, still consistent with the rate-cut-driven classifier. No regime change this week. SPY implication: supportive while it holds; bear-steepener flip would change the story. Commodity — gold: GLD $423, NEUTRAL-FLAT, sitting on weekly wave (4) support near $420. Gld_realized_vol -1.76σ — vol crushed. Gold has finished its parabolic and is consolidating; not signaling stress. SPY implication: mildly risk-on (gold not bid for fear). Commodity — oil: CL1 $102.5, full backwardation, oil curve signal "SUPPLY CRISIS PREMIUM." Oil_momentum_63d +3.94σ is historically extreme and mean-reverting — but OVX at -2.08σ says the market has stopped fearing the spike. SPY implication: this is the single biggest tail risk for next week; oil rolling over would be a clean tailwind, oil to $110+ would re-ignite the 2026 supply-shock inflation thesis [1][9] and crush multiples. USD: DXY 98.2, broke down through 100 support, sitting at 98.5 50DMA. JPY strength (USDJPY 157 down from 161). DXY z -0.11σ. SPY implication: weak USD modestly supportive of multinational earnings, neutral overall. New divergences vs resolved divergences New / widening divergences: SPY at ATH vs earnings_health stepping down to 4.76. Price-fundamental gap. Demand pillar weakening, buybacks retreating, EPS data stale. Dashboard composite z (+0.59σ) vs formal Macro Health Composite (5.00 / neutral). The 9-panel mean is signaling N-BULLISH while the 5-component formal score is dead-flat neutral. Dashboard is leaning on Technical (+0.69), Risk (+0.58), Breadth (+0.55); formal is held back by macro_backdrop 4.45 and earnings 4.76. This is the cleanest internal disagreement we've had in weeks. Oil_momentum_63d +3.94σ vs OVX -2.08σ. Price momentum extreme, vol pricing benign — classic complacency setup ahead of either a resolution lower or a violent re-spike. Macro panel breakeven_5y +1.34σ vs real_10y -1.20σ. Inflation expectations rising, real rates falling — the bond market is pricing in growth/inflation more than discipline. Aligns with the AI mentor's "supply-shock regime" framework [1]. Resolved / narrowing divergences: SPY/QQQ ratio at 1.07 (lows) — tech leadership has been resolved in favor of broad market participation; not a divergence anymore, it's just a regime. ITOT/GOVT broke higher, confirming the risk-on equities-over-bonds preference. The early-April divergence (equities up, ITOT/GOVT lagging) closed this week. XLY/XLP at 1.41, freshly broken to new lows on the week — the consumer cyclical signal is the one risk-off voice in an otherwise risk-on chorus. Not "resolved," more like "now louder." Quantitative trajectory cross-check The formal Macro Health Composite was anchored at 5.00 ± 0.08 all week — basically flat. The dashboard composite z moved +0.35σ over 20 days and now sits at +0.59σ with regime N-BULLISH. They are diverging, and the dashboard is leading. Per the playbook, when the dashboard z leads and the formal composite hasn't followed, that's either (a) early signal that the formal will catch up next week, or (b) a positioning/technical overshoot in the 9-panel that will mean-revert. The component scores tell us which: master_risk improved daily (good), but earnings_health stepped down and stayed there (bad), and macro_backdrop never moved (stuck). The formal anchor isn't moving because two of its five legs are firmly neutral-to-weak. My read: the dashboard is running ahead of the macro fundamentals on the back of price action and breadth, and unless earnings_health revives or macro_backdrop lifts off 4.45, the dashboard z is more likely to fade toward the formal anchor than the other way around. That's the quantitative argument for the cautious tone in the SPY bias. What to watch next week 30Y yield: 5.00% line. Closed 4.96%. A weekly close above 5.00% breaks the multi-week consolidation and re-engages the term-premium-stress narrative [1][10] — equity-negative. CL1 oil: $95 (50% retrace) on the downside, $110 on the upside. Either resolves the supply-crisis-premium signal. A break under $95 would crush oil_momentum_63d back toward the +2σ band and remove the biggest tail risk from the macro backdrop. SPY $700 (weekly 5MA / round number) on the downside, $724.87 (wave-5 0.562 extension) on the upside. Daily close below $700 would signal the wave (5) is done; failure at $724-725 with bearish divergence on the daily SPY composite (currently 6.77, OVERBOUGHT-CAUTION) would set up a wave (a) pullback toward $683 (1.0 fib). Earnings season catalysts. With EPS age flagged "CRITICAL" and earnings_health at 4.76, any major-cap earnings disappointment hits a stretched tape with no buyback cushion. Tech earnings are 90% of index EPS growth per [2] — that concentration is the vulnerability. Composite transition: watch for formal Macro Health Composite to either close >5.30 (confirms dashboard's bullish lead) or drop <4.80 (confirms dashboard is overshooting). The 5.00 anchor is the pivot. Classifier transition: RATE-CUT DRIVEN @ 5.6 holding all week is the floor of the bullish narrative. A flip to RATE-CUT DRIVEN @ <5.0 or "GROWTH FADING" intensification would invalidate the long bias. VIX 17 / VIX3M 20.5 / contango 0.83. A move below 0.78 (red line on VIX/VIX3M chart) would mark complacency extreme; a spike above 1.00 backwardation flips risk regime. Net liquidity (-1.20σ on the panel, "TIGHTENING" on the macro backdrop). Bank reserves draining 10.4% YoY. If the liquidity panel z deteriorates past -1.5σ, that's the slow-bleed channel that ultimately caps multiples. Confidence & caveats Earnings_health step-down on Tuesday (6.07 → 4.75) is suspicious as a single-day drop. Could be data refresh / EPS-age recompute rather than a real fundamental change. The "CRITICAL — UPDATE NOW" flag on EPS age suggests this is partly stale-data driven; treat the new lower level as provisional until confirmed next week. The dashboard z vs formal composite divergence is real but the playbook on which leads isn't bulletproof. I've leaned on "formal anchors and dashboard mean-reverts," but in strong trending tapes the dashboard can be the leading indicator and the formal does catch up. If breadth holds +1.5σ and master_risk continues to improve, the formal composite could lift through 5.30 and validate the bullish setup. Oil_momentum_63d at +3.94σ is so extreme that any signal derived from it is non-stationary. I've flagged it as a tail risk in both directions; not pretending I know which way it breaks. No fresh fixture for COT_gold_netlong (n/a) and bear_steep on master_risk (—). Minor data gaps, not material to the read. Dashboard regime label "N-BULLISH" with formal "NEUTRAL" — when the labels disagree, I default to the formal classifier as the macro anchor and the dashboard as the tactical overlay. That's the source of the cautious-long rather than outright-long bias.
srojasmacro tweet mediasrojasmacro tweet media
English
0
0
0
33
srojasmacro
srojasmacro@Srojas78·
$Crude $Oil $USO $CL Daily setup. CL1! (Light Crude Futures) is trading ~102.01, sitting just above the 20 SMA (red curve, ~102) and well above the 200 SMA (~70 area, rising). Price is in the upper half of the BB but not pressing the upper rail — the band expanded sharply on the recent impulse and price is now consolidating within it. The 0.786 Fib retracement sits at ~105.61, acting as near-term resistance that capped the most recent push. The 0.618 level at ~100.11 is the first meaningful support below current price. Daily Universal Oscillator: score ~6.00/10, signal appears BUY (moderate), regime reads NEUTRAL-FLAT. Momentum is slightly positive but not accelerating. Weekly context. Weekly chart shows the aggressive V-recovery off the (4) low (~42-46 area) completing a large multi-month impulse. Price is now ~102.01 on the weekly as well, with the 20 SMA at ~75.18 — deeply below price, confirming trend strength. The 200 SMA on weekly is ~77.49. Weekly Universal: score ~6.13/10, signal BUY, confirmation reads CAUTION (8.4) — that "caution" tag is notable; it flags the oscillator is elevated and momentum may be stretched. Weekly regime: BULLISH-BUILDING. Weekly confirms daily direction but the caution flag warns against chasing. Monthly / 3M structural. On the 3M chart, price is recovering back toward the channel midline after a deep multi-year correction. The 3M 20 SMA is at ~102.04 — price is essentially at it, a key test. The 200 SMA on the 3M is visible and well below (not shown precisely but the monthly shows it at ~72.02/71.01 zone). Monthly BB: price is in the upper half, having reclaimed midline. Elliott wave labeling on the weekly marks a completed wave (4) correction and now an impulse leg underway — likely early wave (1) or (3) of the next higher-degree leg. The 1.0 extension target visible on the daily at ~119.45 is the next structural objective if 105.61 clears. Macro alignment. Composite z of -0.03 is essentially flat/neutral — no macro tailwind or headwind. Regime labeled "improving" is constructive and consistent with crude catching a bid after a prolonged correction. The technical picture (price reclaiming multi-year structure, wave (4) complete, oscillators in buy territory) aligns directionally with an "improving" macro backdrop. No overt conflict, but the near-zero composite z means macro isn't driving a strong impulse — this is technicals-led, not macro-confirmed with conviction. Levels to watch. Resistance: 0.786 Fib ~105.61 (hard cap tested and rejected), then 1.0 extension ~119.45. Support: 0.618 ~100.11, then 0.5 ~97.59 (green horizontal), 0.382 ~82.07, and daily 20 SMA now rising through ~102. Weekly 20 SMA ~75.18 is the swing low anchor — losing that negates the entire recovery thesis. If-then. Confirmation: daily close above 105.61 on volume opens the path to 109-114 and ultimately the 119.45 target. Invalidation: daily close back below 97.59 (0.5 Fib) with momentum rolling negative on the Universal signals a failed breakout and retest of the 87-88 zone minimum. Watch the weekly CAUTION flag — if weekly momentum goes negative while price is under 100, the (4) low is back in play structurally.
srojasmacro tweet media
English
0
0
0
143
srojasmacro
srojasmacro@Srojas78·
bitcoin:native $bitcoin $btcusd BTCUSD is printing ~78,374 on the 1D, sitting below the 20 SMA (~96,000 area, red curve) and well below the 200 SMA (~98,000+, yellow/orange — descending and acting as dynamic resistance). Price is in the lower half of the BB, having bounced off the lower-rail lows but not reclaiming the midline. The daily Universal table reads BUY-HIGH signal with CONFIRMED weekly confirmation and regime BULLISH-BUILDING at a score near 5.5. Nearest resistance is the 20 SMA and BB midline cluster ~82–84K; support is the recent swing low in the 73–74K zone. Key Fib levels visible: ~60,474 (deeper support), ~77,322 (immediate), ~96,000 area (retracement resistance). Weekly context. Weekly chart shows price tagged the 200 SMA (yellow, curling lower) as overhead resistance and has since corrected through a clear (a)-(b)-(c) ABC correction off the wave (5) high (~109K area). Weekly Universal scores ~6.4, signal is BUY-WEAK to BUY-MOD, weekly row reads CONFIRMED (7.1), momentum at +0.26, regime NEUTRAL-STABILIZING. The weekly BB lower band was recently tested; price is attempting to stabilize in the lower half. Weekly is not yet confirming a clean impulse recovery — still in corrective consolidation posture. Monthly / 3M structural. Monthly labels show wave (5) labeled at the top (~109K), with the current decline as the corrective wave sequence post-cycle peak. The 3M chart confirms: price completed a large degree (5) wave and is now in a higher-degree correction — monthly label shows (5) top, with (b) and (c) corrective legs unfolding. Monthly 20 SMA (~122K) is far overhead; price is back near the 200 SMA on the monthly timeframe (yellow curve visible, price approaching from above). On 3M, price is below the 20 SMA and in the lower half of BB, consistent with a multi-quarter corrective phase. The parallel channel on the weekly suggests the lower channel rail near 65–68K is the structural floor if current support fails. Macro alignment. Composite z at -0.03 is essentially flat/neutral — macro is neither contracting nor expanding with conviction. Regime label "improving" is mildly constructive and aligns with the daily BULLISH-BUILDING oscillator regime and the BUY-HIGH signal firing on the daily. However, the technical structure is still corrective at the weekly/monthly level. The macro doesn't conflict with a bounce/base scenario, but it doesn't supply the tailwind needed to call a new leg higher with confidence. The alignment is: tactical daily buy setup within a larger corrective structure — not a macro-driven breakout impulse. Levels to watch. Immediate resistance: 20 SMA daily ~82–84K, BB midline zone. Hard resistance cluster: 91–96K (20 SMA monthly, prior breakdown zone, 0.5 Fib retracement off the cycle high). Support: 77,322 (labeled Fib), then 73–74K (recent swing low). Below that: 65–68K (channel lower rail, 0.618 Fib area), 60,474 (Fib extension visible on daily). 200 SMA daily is ~98K and declining — that is the bull/bear structural divide. If-then. Confirmation: daily closes above 84K BB midline and holds, weekly oscillator shifts to BUY-MOD/HIGH with momentum accelerating positive — opens a run toward 91–96K. Full invalidation: break and close below 73K on daily volume, which re-targets 65–68K channel support and would confirm the (c) wave extension on the weekly is incomplete.
srojasmacro tweet media
English
0
0
0
41
srojasmacro
srojasmacro@Srojas78·
Daily (1D): GLD is at ~426.90, sitting right on the 20 SMA (red curve), which is itself declining—price has been grinding sideways-to-down off the wave (3)/5 peak near ~500. The daily Universal Oscillator is showing a fresh BUY signal (visible in bottom-right), with momentum turning up after a multi-week washout. Price is in the lower half of the BB, near the midline but not quite reclaiming it. Key reference levels cluster at 437.91 (recent resistance), 388.86 (lower support), and 426.90 (current price ≈ BB midline test zone). The (4) label on the daily appears to have completed near the 385–391 area with the c-wave low, suggesting a corrective low is in. Weekly (1W): Weekly oscillator reads SELL-MOD with score ~5.25, CONFIRMED at 3.9, regime NEUTRAL-FLAT. Momentum on the weekly is -0.14—still negative, but decelerating. Weekly price is below the 20 SMA, in the lower half of a wide BB that has been expanding since the wave (3) top in early 2026. The weekly structure is in clear corrective mode after the blow-off wave (3)/(5) sequence. Weekly does NOT yet confirm the daily BUY—this is the key conflict to track. Monthly / 3M structural: The 3M chart shows GLD well above the 200 SMA (200 SMA not visible—off-screen below), deep inside the BB upper half, still within the long-term rising channel. Elliott labeling on 3M/1M shows wave (3) with a 5-sub-wave completion near ~487–500, and a wave 4 correction now underway. Monthly price at ~426.90 is below the 486.91 high, above the 340.09 support level. The 200 SMA on the monthly is ~247.50—structural bull trend intact by a wide margin. This is a wave (4) correction within a multi-year impulse; the question is how deep it runs. Macro alignment: Composite z of -0.03 is essentially neutral with regime labeled "improving." This is modestly supportive—not a macro headwind. Gold's role as a macro hedge means an improving-but-not-overheating macro backdrop is consistent with a consolidating (4) wave rather than a trend reversal. No conflict between macro and the technical corrective thesis; both suggest range/consolidation rather than breakdown. Levels to watch: Upside: 437.91 (20 SMA / first resistance), 450 (BB midline on weekly), 466–470 (weekly BB upper half resistance). Downside: 420–422 (immediate support / BB midline on daily), 407–410 (lower BB daily), 388.86 (labeled support / prior c-wave area), 370 (channel lower rail on weekly). Fibonacci cluster from wave (3) top to (4) low likely places 0.382 retrace near 456–460 as first upside target if (4) is complete. If-then: Confirmation of (4) complete and (5) launch = daily close above 437.91 with weekly oscillator momentum crossing positive. Invalidation = daily close below 388, which would extend the (4) and open 370–360 channel support. Weekly SELL-MOD flipping to BUY-WEAK is the oscillator confirmation trigger to size up.
srojasmacro tweet media
English
0
0
0
19
srojasmacro
srojasmacro@Srojas78·
Today's Narrative - Composite rises to Neutral-Bullish but ... Lean: cautious long, conviction LOW-MEDIUM. SPY at $722 is printing a wave-5 extension into the weekly upper band with composite +0.23σ and improving (+0.52σ over 20d) — ride the regime turn but treat this as a chase, not an entry. Tape leads, macro lags, and the divergence is widening. What changed SPY broke out to new highs ($722, +8.2% vs 200SMA) — daily chart shows a clean (5) print at 719.79 fib extension, weekly tags the upper rail of the rising channel. Technical panel +0.79σ, with spy_pos_in_bb_20w at +1.05σ. Tactically: extended, not broken. Risk panel +0.60σ confirms the move — VIX/VIX3M at 0.84 deep contango, HY OAS tight (+0.89σ), VRP positive. No internal stress to fade the breakout on. Breadth +0.55σ improving but thinning — A/D thrust strong (+1.56σ) yet pct_above_200sma only at 55.6% with the index at ATH. Participation is following, not leading. Yields backed up sharply: 30Y 4.98%, 10Y 4.44%, 2Y 3.92% — front-end inverted curve (3m10y +72bp, 2s10s +49bp) with bear-steepener active and term premium at 0.65%. This is the live tension: rate-cut-driven cycle reading at 5.6 sits against a bond market repricing hikes (yield_curves_oil shows "MARKET PRICING HIKES"). Sentiment -0.47σ, NAAIM -1.14σ — managers underexposed into a breakout. Supports continuation; doesn't argue for adding aggressively up here. Crude $102, full backwardation, supply-crisis premium tag — oil_momentum_63d at +3.87σ. The supply shock is live and is what's driving term premium higher [1]. Today's risk 30Y above 5.00% (currently 4.98%) flips the rate-cut narrative into a bond-vigilante tape; SPY multiple at 23.4x ("SLIGHTLY RICH") cannot absorb that without a drawdown. This is the single binary today. DXY 97.9 sitting on the 200-day — break lower keeps risk-on intact; a snap-back above 99 with yields up would tighten conditions fast. Earnings Health 4.75 / "BULL AT RIST" / buyback retreat — the structural offset to today's tape strength. If a bellwether print disappoints into this extension, the air pocket below 698 (prior breakout) is wide. Cross-check Formal composite (5.00 NEUTRAL) and Economic Cycle (5.6 RATE-CUT DRIVEN, "watch for fade") disagree with the dashboard z (+0.23σ improving) and the tape — formal score says "don't size up, the macro hasn't confirmed," tape says "trend is your friend." Resolution: respect direction (long), constrain size (this is a chase at extension, not a fresh entry), and key the 30Y as your stop-out on the macro thesis.
srojasmacro tweet media
English
0
0
0
17.4K
srojasmacro
srojasmacro@Srojas78·
@kylebray_ @UAPLuigi she said you can't travel into the future. But that doesn't mean you can't get back to the present if you travel to the past. You just can't go forward from the present.
English
0
0
1
99
kb
kb@kylebray_·
@UAPLuigi If you can travel backward and not forward in time and then you do go backward in time. Are you then stuck there and unable to return to where you started?
English
8
0
49
25.7K
UAP ★ Luigi ★👁️⃤ 🇺🇸 κρυπτός W.👽MJ12 SOM1-01🫈
BREAKING: 🚨‼️ NEW ‼️🚨 Amy Eskridge, one of the 15+ missing or deceased scientists told her friend Franc Milburn via signal chat on October 26, 2021 that the world was ending: "I told you the cataclysm was in 7 years. That would be (October?) 2028, like he just said." #cataclysm #UFOTwitter
UAP ★ Luigi ★👁️⃤ 🇺🇸 κρυπτός W.👽MJ12 SOM1-01🫈 tweet mediaUAP ★ Luigi ★👁️⃤ 🇺🇸 κρυπτός W.👽MJ12 SOM1-01🫈 tweet media
UAP ★ Luigi ★👁️⃤ 🇺🇸 κρυπτός W.👽MJ12 SOM1-01🫈@UAPLuigi

NEW: 🚨‼️ Amy Eskridge, one of the 15 missing or deceased scientists, discussing; NASA, harassment, and time travel. #missingscientists #NASA #UAP Src: Franc Milburn

English
107
490
3.7K
524.2K
Brian Krassenstein
Brian Krassenstein@krassenstein·
Trump is so disrespectful. He literally cut in front of Queen Camilla while she was shaking hands. Every day is another embarrassment for our country.
English
13.3K
22.5K
96.3K
3.7M
srojasmacro
srojasmacro@Srojas78·
Crude Oil - Price diverging from weakening back end and deep demand. Attempting to re-test the 3M upper bollingers band
srojasmacro tweet mediasrojasmacro tweet media
English
0
0
1
56
Dom Lucre | Breaker of Narratives
🔥🚨RECENT: Scientists revealed that seismic data from satellites has discovered that Earth creates a pulse every 26 seconds, often described as its "heartbeat.” Which is keeping the science community puzzled, alluding to the earth being a living thing.
English
248
599
4.3K
283.9K
Wade Stotts
Wade Stotts@wadestotts·
"History PhD here--the number of World Wars is actually a *very* controversial topic in academia. Some say there have been two (traditional view), while others say up to sixty-four. Scholars disagree, and that's okay! What's NOT ok are these RACIST attacks on Rep Omar!"
I Meme Therefore I Am 🇺🇸@ImMeme0

Rep. Ilhan Omar: “The last time the Alien Enemies Act was invoked… during World War ELEVEN.” She must have gotten her education in the Quality Learing Center.

English
6.7K
248
4.1K
865.5K
srojasmacro
srojasmacro@Srojas78·
Crude Oil - CL - Clear picture for now. Back end demand will show first move
srojasmacro tweet mediasrojasmacro tweet media
English
0
0
2
35
MLFootball
MLFootball@MLFootball·
TRENDING: This video of Cleveland #Browns assistant general manager Catherine Hickman talking about their draft class has gone viral. 👀 Hickman joined the Cleveland in 2022 as the assistant general manager and vice president of football operations.
English
135
50
1.1K
713.5K
Katie
Katie@katiephillips68·
@Srojas78 @Magi42 @kekiusteeshirt The idea is that, to simulate our reality, we would need to use literally every ounce of energy in the universe to do it. If we didn’t, we wouldn’t be simulating reality. If even one atom in the simulation doesn’t parallel ours, then there’s no sense in calling it a reality sim
English
2
0
0
44