Shahid Hussain

1.4K posts

Shahid Hussain

Shahid Hussain

@Starbox2001

Katılım Temmuz 2023
16 Takip Edilen551 Takipçiler
Sabitlenmiş Tweet
Shahid Hussain
Shahid Hussain@Starbox2001·
$GME Monthly chart An update from Dec 6, 2025 The chart appears very similar to the prior post! GME has continued to move sideways, within a tight range, however, the chart has become more bullish on multiple timeframes! We had a >3-years bullish falling flag, with a breakout in 5/2024, which followed by a >24-months of re-accumulation with doji-like tiny monthly candles and a side-ways move! When we break the trading range, the price will likely test the upper edge of the Ichimoku Cloud around $60! If we are able to go through and above the Cloud, we may test the ATH around $125, within the smaller green channel! Then, the price may retrace to the upper boundary of the Cloud before it moves back up and into the gray channel (the upper boundary $2500-$3000)! Note that, since 2020, the GME price structure has evolved within a giant RE-ACCUMULATION SCHEMATIC and therefore is likely a CONTINUATION PATTERN! Good luck!
Shahid Hussain tweet mediaShahid Hussain tweet media
Shahid Hussain@Starbox2001

$GME Monthly chart We had a >3-years bullish falling flag, with a breakout in 5/2024, which followed by a >15-months of re-accumulation with doji-like tiny monthly candles and a side-ways move! When we come out of the current trading range, the price will likely test the ATH around $125 (red arrow) and primarily move within the green channel (the upper boundary $125-$150)! After that, the price may retrace to the upper boundary of the Cloud, and then likely move back up and into the gray channel (the upper boundary $2500-$3000)! Note that, since 2020, the $GME price structure has evolved within a giant RE-ACCUMULATION SCHEMATIC and therefore is likely a CONTINUATION PATTERN! Good luck! 💥💥💥

English
4
9
121
13.8K
Shahid Hussain
Shahid Hussain@Starbox2001·
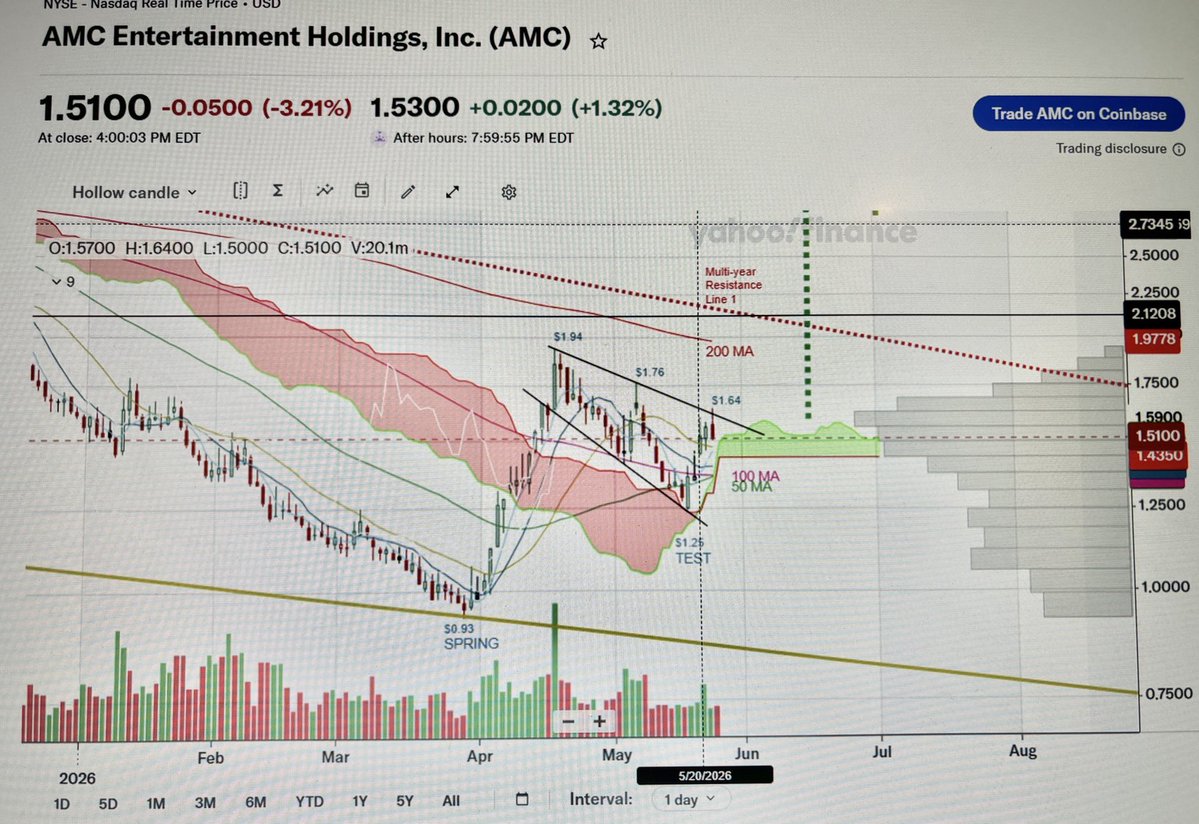
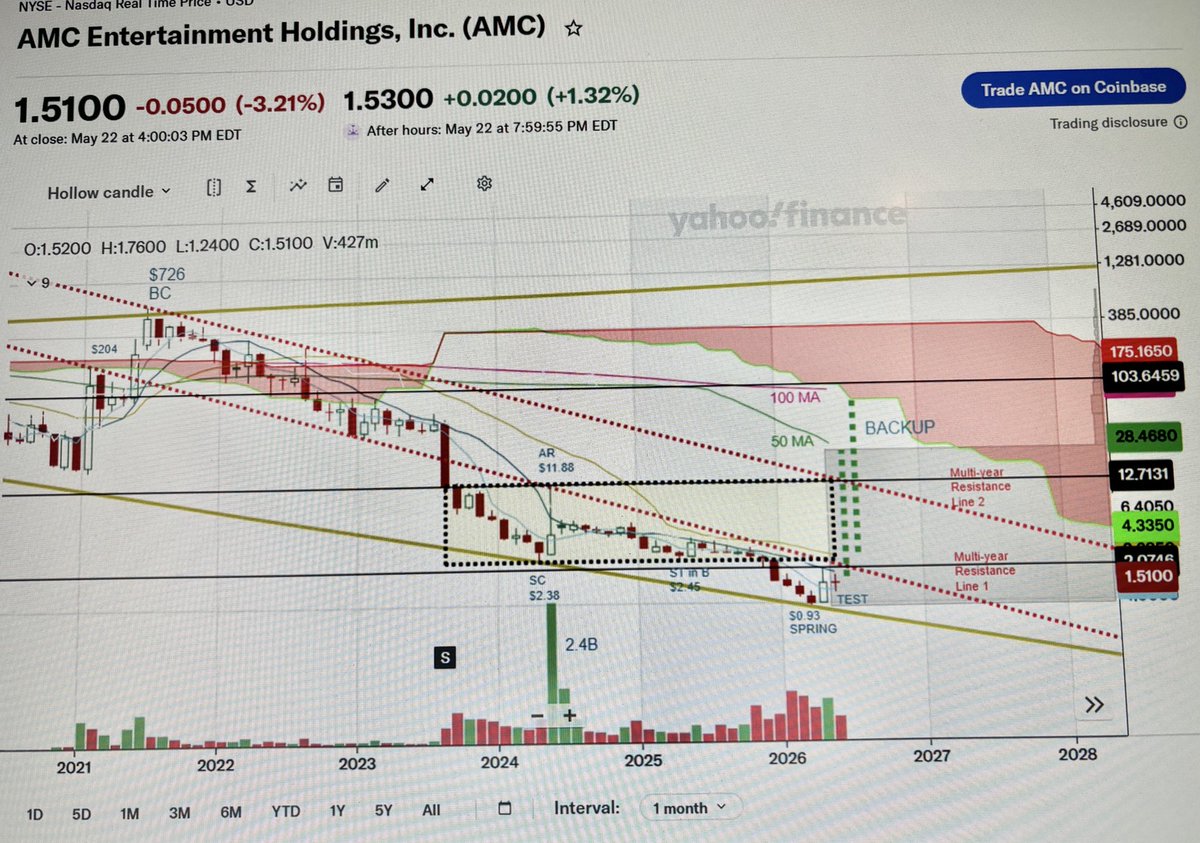
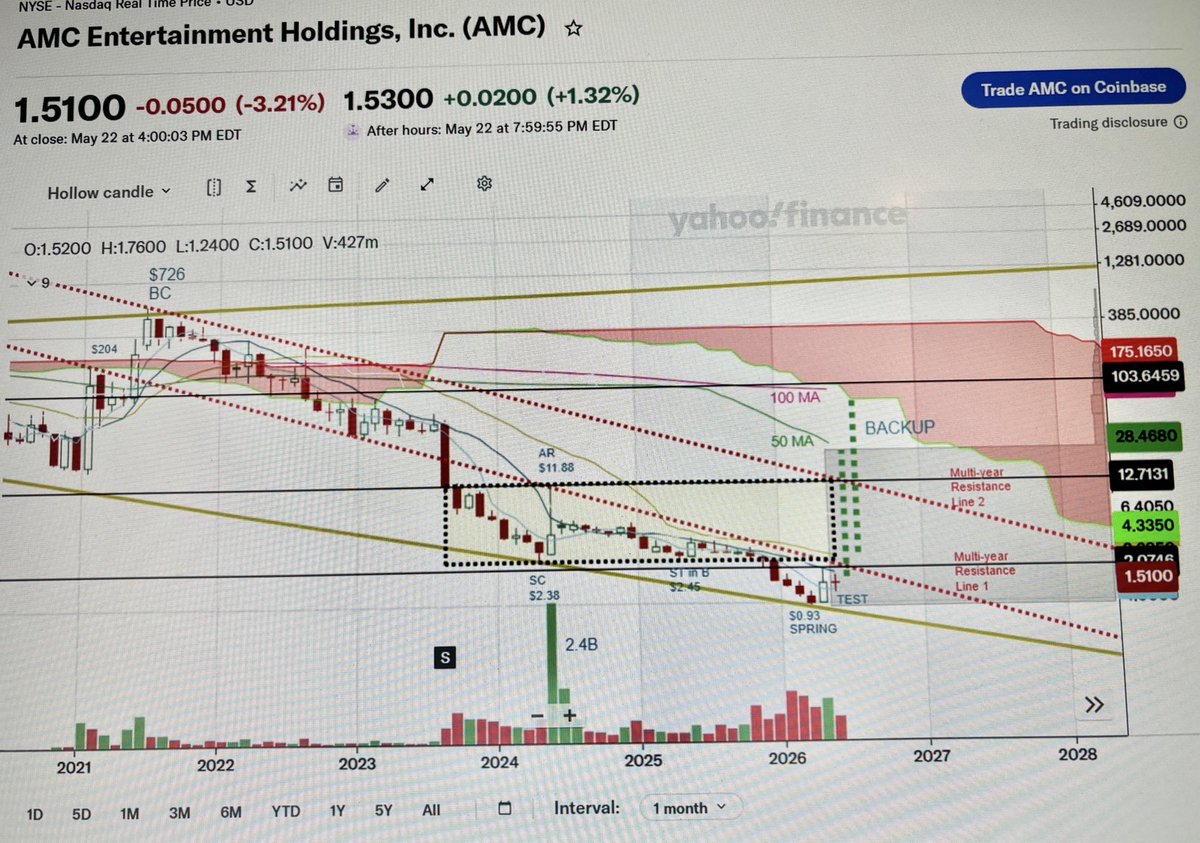
$AMC Wyckoff Type I Distribution Schematic Pic I Monthly chart During the meme-stock MOASS in 1/2021, the price surged from $19 to $204 and reached an ATH and a Buying Climax (BC) of $726 in 6/2021! Since then, the price steadily declined within a falling flag formation, and accelerated its descent in 8/2023 with panic selling after a 1-10 stock split, culminating into a Selling Climax (SC) at $2.38 in 4/2024! This was followed a massive auto rally (AR), with the price rebounding to $11.88, with the highest monthly trading volume of 2.4B in 5/2024! Then, the price moved sideways, forming a trading range between $2 and $12 (yellow box). In 12/2025, suddenly the price broke through the $2 to the downside, and continued to fall till it reached an ATL of $0.93! This was likely a high-volume Wyckoff Spring, a false move to the downside, which typically occurs before a BACKUP can begin! Note that there are two long-term Resistance Lines 1 and 2, which coincide with the lower and the upper boundaries of the trading range! After completing the TEST of the SPRING, the price has make its way back into the trading range (yellow box) > $2-2.50! During an uptrend, the price has to break the resistance lines and could move up, with multiple gap fills, toward a range between $15-$30! Then, it is likely to fall back into the trading range! Finally, it could go back up and reach the monthly 100 MA/lower edge of the Ichimoku Cloud around $100! Pic II Wyckoff Type I Distribution Schematic Drawing The monthly AMC chart shows striking resemblance to the drawing and the important landmarks can be identified, such as the BC, SC, AR, ST in B, SPRING, TEST of the SPRING, and finally the BACKUP (BU) phase! Pic III Weekly chart Note a more detailed view of the trading range (yellow box) with the key events (SC, AR, ST in B, SPRING, TEST). Also, note that the lower resistance line 1 coincides wit the weekly 50 MA, 100 MA + the lower edge of the Ichimoku Cloud, while the upper resistance line 2 coincides with the upper boundary of the trading range + the weekly 200 MA! Pic IV Daily chart Note the detailed view of the most recent price action with the ATL of $0.93, likely the SPRING, followed by a price rebound to a local high of $1.94! Then, the price went into a descending broadening wedge, likely resulting in the TEST of the SPRING at $1.25, and now appears to be in a new uptrend! The price needs to break the $1.94 to the upside, in order to move back up into the trading range, >$2-$2.50! The daily 200 MA is at $1.98 and the resistance line 1 is around $2.12! Breaking below the recent low at $1.25 will invalidate the entire setup!!! Time will tell! NFA Good luck!
Shahid Hussain tweet mediaShahid Hussain tweet mediaShahid Hussain tweet mediaShahid Hussain tweet media
English
4
10
87
6.5K
Shahid Hussain
Shahid Hussain@Starbox2001·
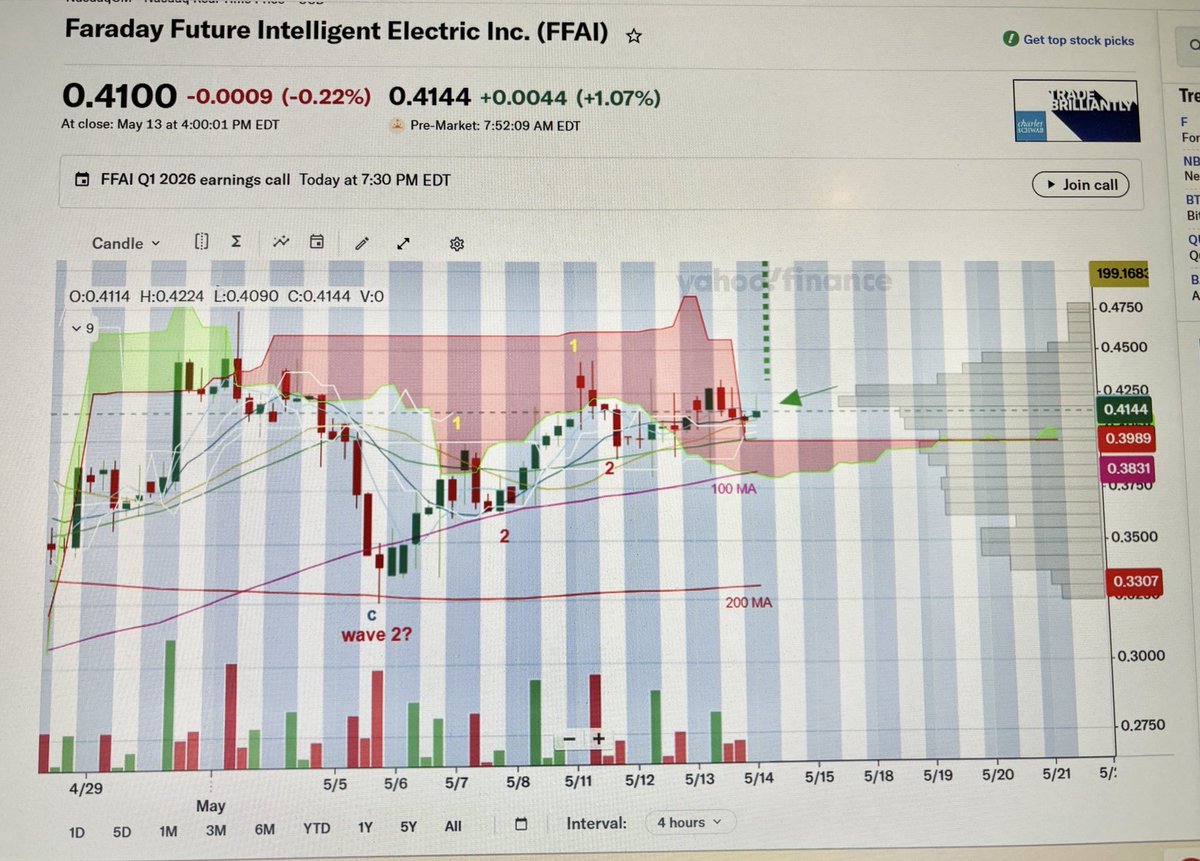
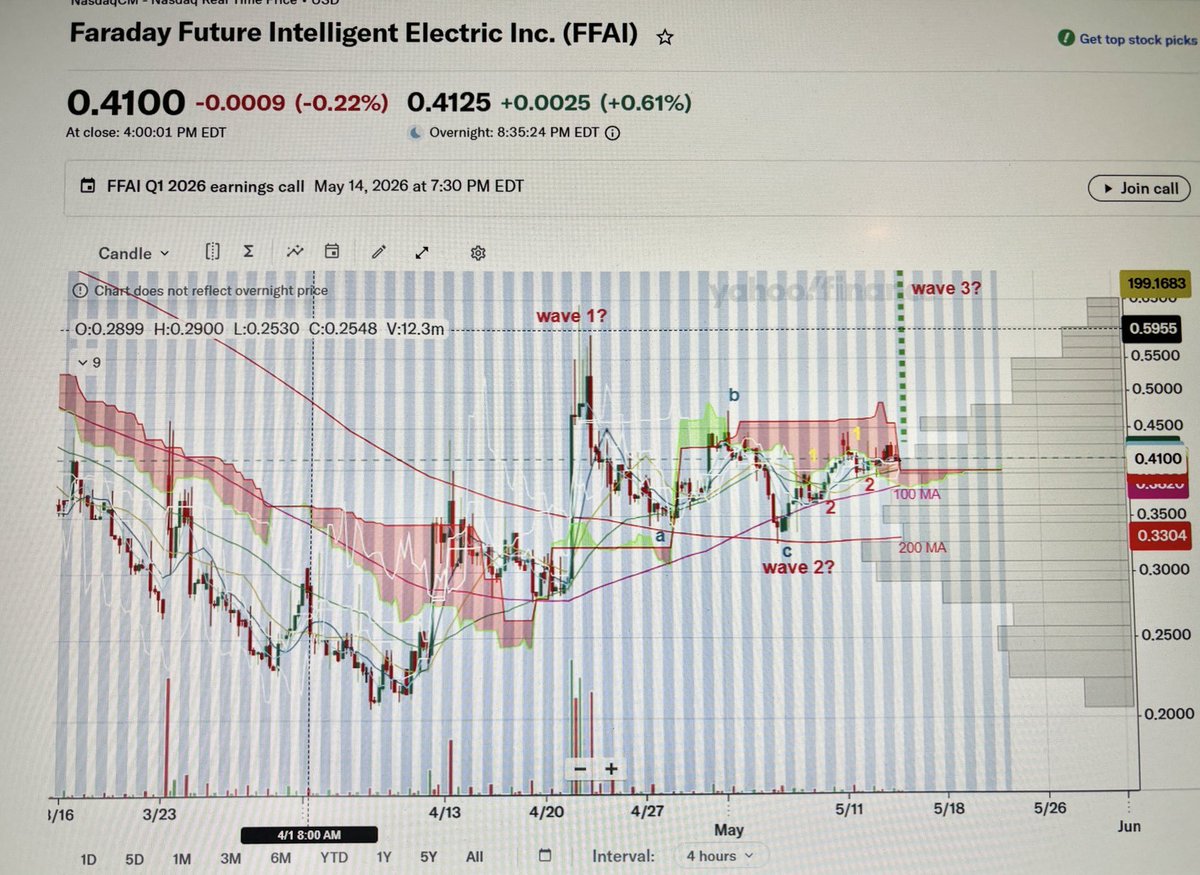
$FFAI 4hrs and daily charts An update from May 5 Pic I The Elliott Wave 1-2 1-2 structure is a so-called a nesting pattern and often occurs just before an expected explosive, vertical move of a stock in the form of a WAVE 3 OF WAVE 3! This can result in an extended, super-extended, or even an hyper-extended Wave 3! Pic II and III 4hrs charts, a zoomed in and a larger view After we finished the a-b-c sub-waves, it looks like we have formed a nested 1-2 1-2 structure! Also, note that the Ichimoku Cloud is becoming very thin and even flipped green into the future! The today's 4-hrs candle is now printing outside the Cloud with significantly less resistance (arrow)! Daily chart We likely formed the wave 1 on 4/21/2026 with a single large green candle and the daily trading volume of 590M, which is the highest volume in a single day ever recorded for FFAI! After the earnings call, we have three potential scenarios: Bearish case: if the price breaks the wave c (wave2) at $0.32 to the downside, the entire setup invalidates! Neutral case: the earning announcement could be a non-event, with only a small spike up or down. Bullish case: IF we can break the wave 1 at $0.5940 with high volume >150M, an explosive wave 3 could unfold! Standard Wave 3 (1.618 extension): Target $0.9478 Extended Wave 3 (2.618 extension): Target $1.3358 Super-Extended Wave 3 (4.236 extension): Target $1.9636 Hyper-Extended Wave 3 (9.618 extension): Target $4.0518 For such extensions, extremely high daily trading volumes will be needed, between 300M-1B! Time will tell! NFA. Good luck!
Shahid Hussain tweet mediaShahid Hussain tweet mediaShahid Hussain tweet mediaShahid Hussain tweet media
Shahid Hussain@Starbox2001

$FFAI Daily and 4-hrs charts An update from April 30 Pic I Daily chart shows how the wave a-b-c is playing out, which is much bigger than the cycle before, with bigger daily candles, and kind of surprised us with its intensity! It gave the impression that it was the reversal but the volumes were much lower than for instance during the main move on 4/21/2026! Expect the wave c to end somewhere between $0.36-0.35; could double bottom with $0.34 or even go a little lower. Note: the Ichimoku Cloud has now flipped green! A very BULLISH sign! Pic II Note how much bigger the second yellow box is compared to the first! The 4-hrs 100 MA has crossed the 200 MA to the upside! Now, on this timeframe, all of the MAs are above the 200 MA, which is another BULLISH sign! The next destination: the gap fill around $1.04, and hopefully much higher! Good luck!

English
1
3
20
2.4K
Shahid Hussain
Shahid Hussain@Starbox2001·
@MSJSCJ Never get impatient in stocks, my friend! Stay cool and wait for the big run! Thanks for all your likes!🙏
English
1
0
3
46
MSJJ
MSJJ@MSJSCJ·
@Starbox2001 Yes please! Been patiently waiting.
English
1
0
1
46
Shahid Hussain
Shahid Hussain@Starbox2001·
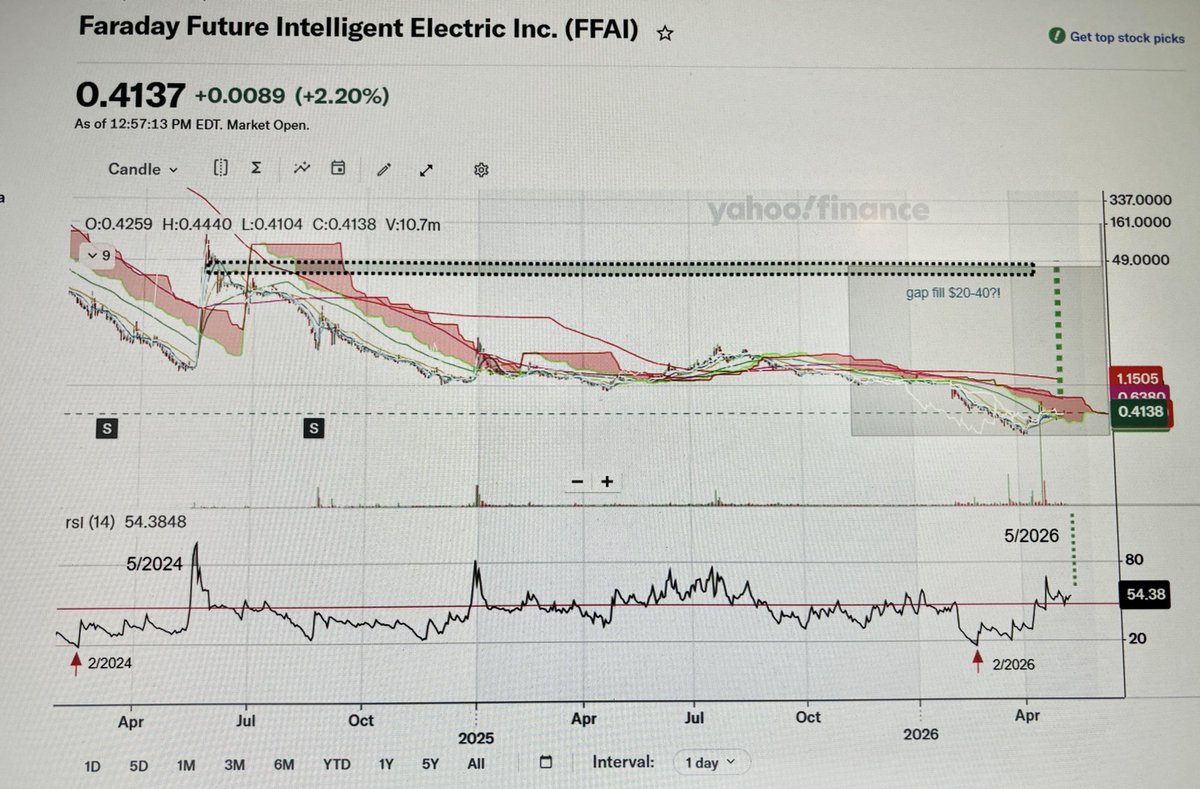
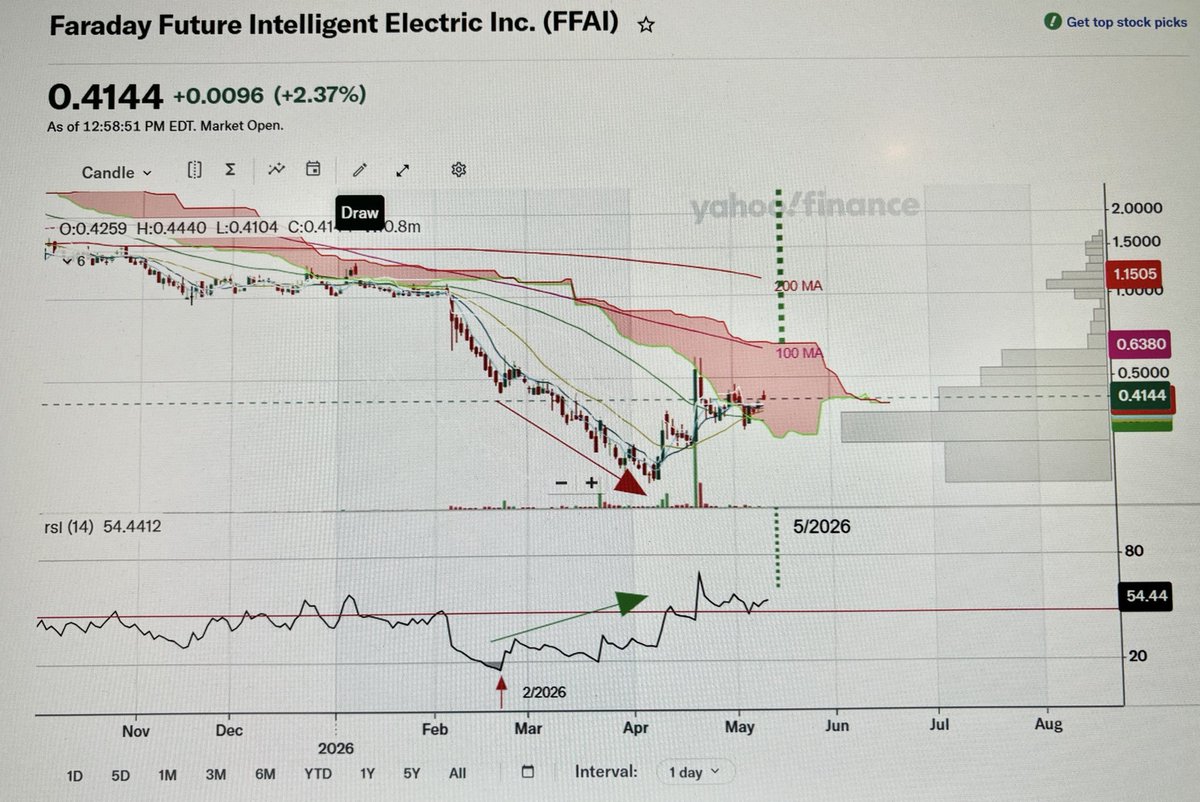
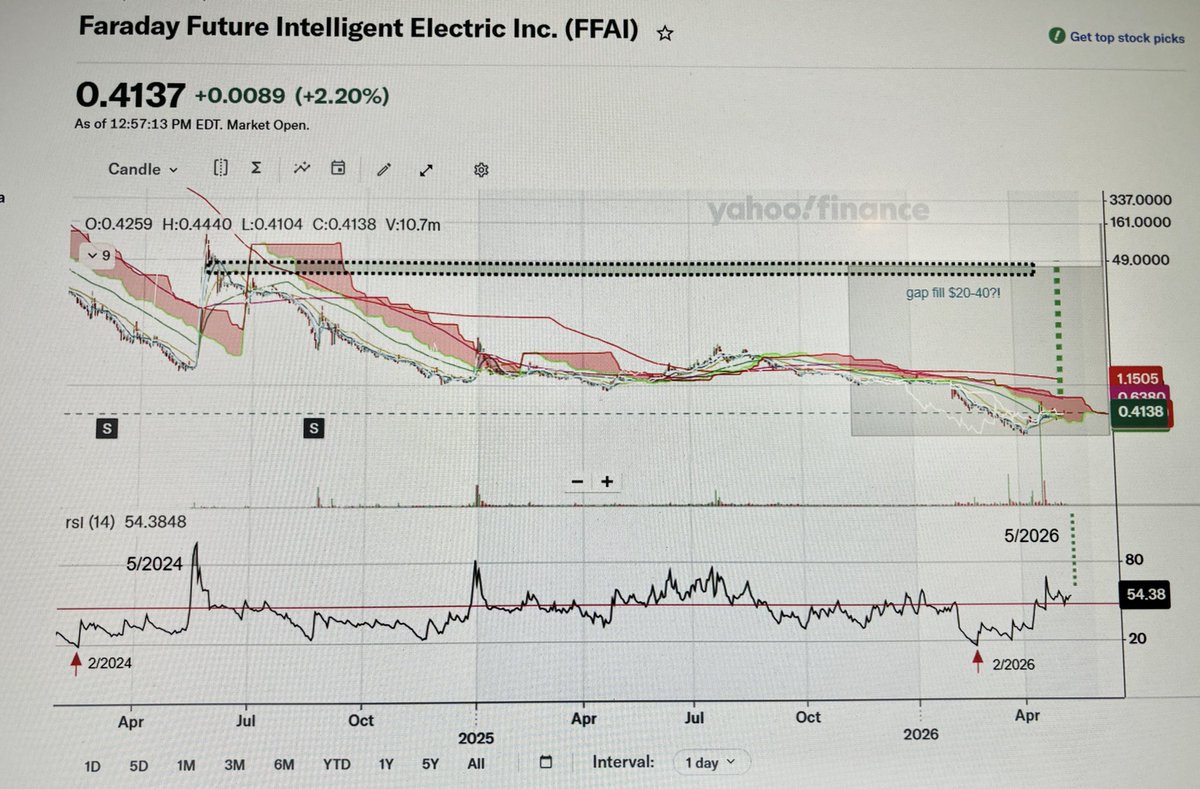
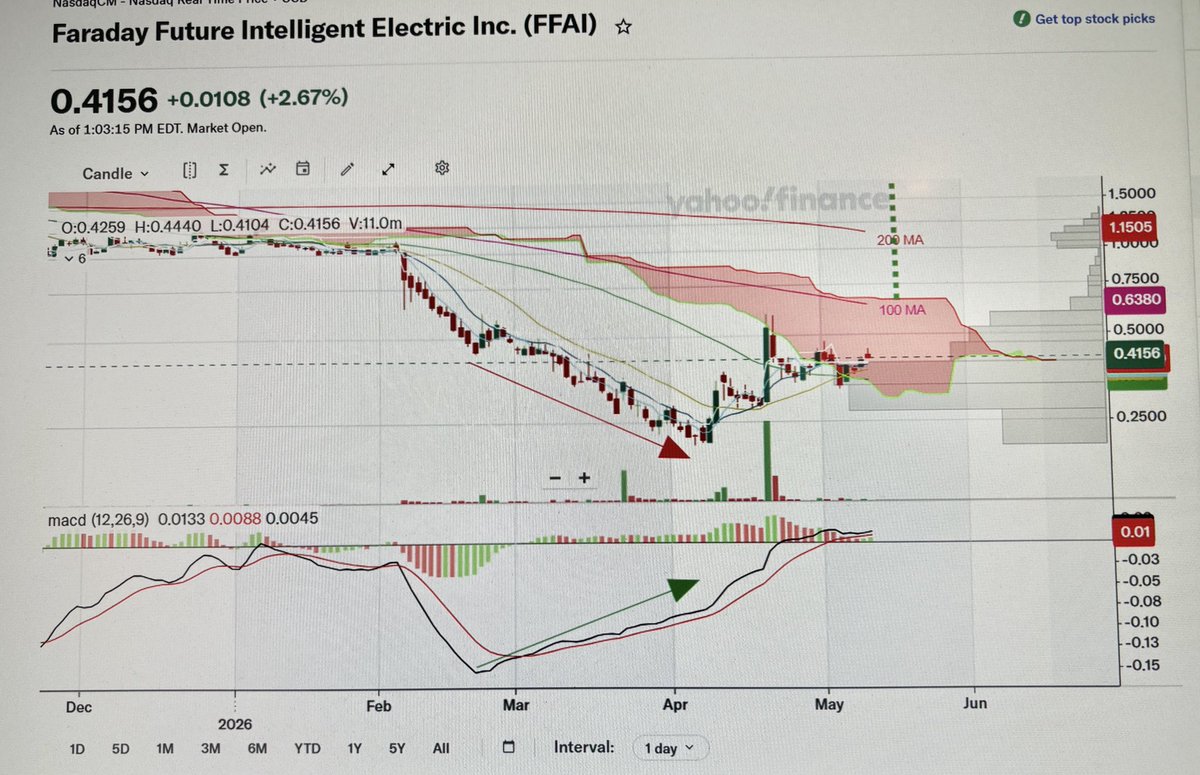
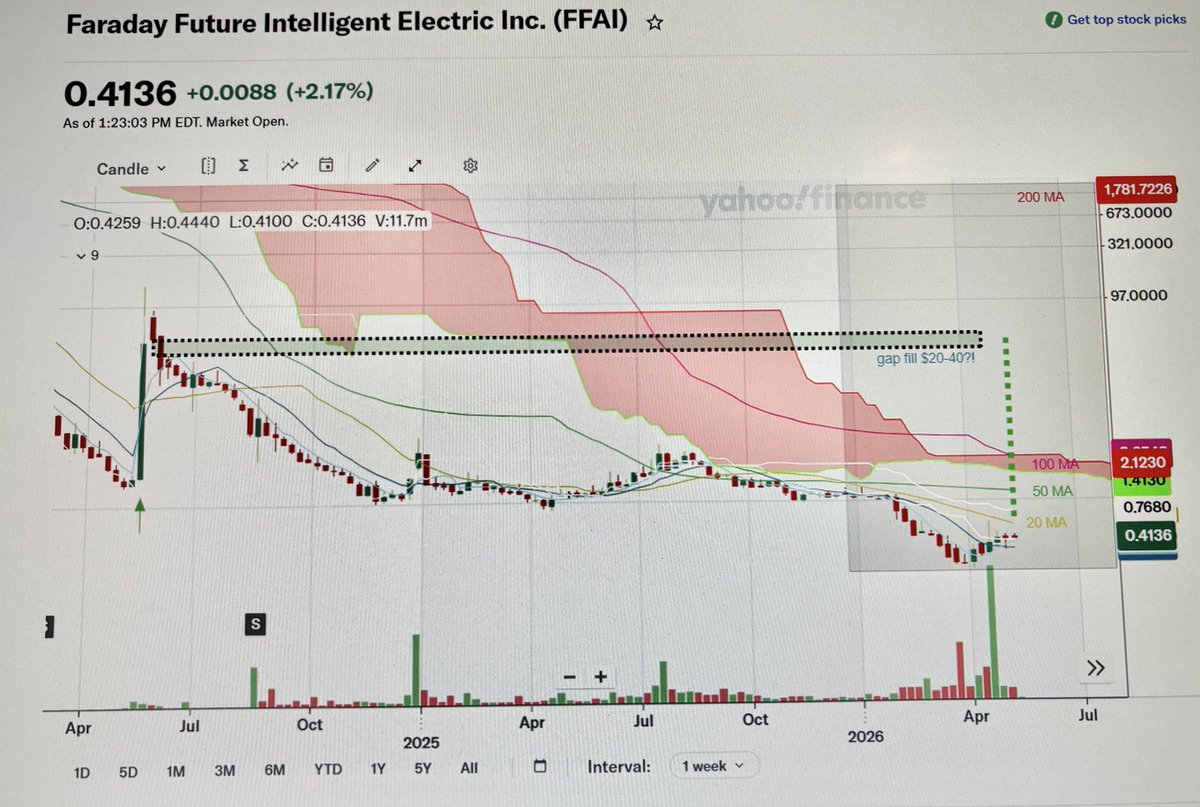
$FFAI Pic I Daily chart This overview of the daily chart continues to show a striking resemblance between the course of the RSI during the period 2/2024 -5/2024 and recent period since 2/2026-till now; seems like, the RSI is just a much bigger version of the RSI from 2024! Pic II and III Note the BULLISH DIVERGENCE between the falling price and the RSI + the MACD between 2/20/2026 and 4/7/2026! Both the RSI and MACD continued their rise after the price rebounded from the ATL of $0.2060 on 4/7/2026! Note, the MACD has also crossed the zero line to the upside! Pic IV Weekly chart Although, on the daily chart, the first gap fill is around $1.04, with the price reaching the daily 200 MA, on the weekly chart we might have one giant weekly candle that goes straight to the gap fill area around $20-$40, and potentially higher! Just look at the single weekly candle from 5/2024 (arrow): it went from $1.80 to $156 in a single week!!! The weekly 100 MA is now just around $2.12 and coincides w/t upper edge of the Ichimoku Cloud! weekly 50 MA, $1.20 weekly 20 MA, $0.57 NFA. Good luck!
Shahid Hussain tweet mediaShahid Hussain tweet mediaShahid Hussain tweet mediaShahid Hussain tweet media
English
3
2
25
2K
Shahid Hussain
Shahid Hussain@Starbox2001·
@MSJSCJ Thank you! Will be awesome if this would play out, right?!
English
1
0
2
66
Shahid Hussain
Shahid Hussain@Starbox2001·
@Thrillhouse747 Why don't you post your own TA; I usually block people who spread negativity using my posts or my name; so you need to stop. One more negative post and you will be gone.
English
1
0
0
33
ManBearPig
ManBearPig@Thrillhouse747·
@Starbox2001 Wyckoff without VPA is just noise Way too many words here and not enough substance
English
1
0
3
37
Shahid Hussain
Shahid Hussain@Starbox2001·
$GME Monthly chart An update from Dec 6, 2025 The chart appears very similar to the prior post! GME has continued to move sideways, within a tight range, however, the chart has become more bullish on multiple timeframes! We had a >3-years bullish falling flag, with a breakout in 5/2024, which followed by a >24-months of re-accumulation with doji-like tiny monthly candles and a side-ways move! When we break the trading range, the price will likely test the upper edge of the Ichimoku Cloud around $60! If we are able to go through and above the Cloud, we may test the ATH around $125, within the smaller green channel! Then, the price may retrace to the upper boundary of the Cloud before it moves back up and into the gray channel (the upper boundary $2500-$3000)! Note that, since 2020, the GME price structure has evolved within a giant RE-ACCUMULATION SCHEMATIC and therefore is likely a CONTINUATION PATTERN! Good luck!
Shahid Hussain tweet mediaShahid Hussain tweet media
Shahid Hussain@Starbox2001

$GME Monthly chart We had a >3-years bullish falling flag, with a breakout in 5/2024, which followed by a >15-months of re-accumulation with doji-like tiny monthly candles and a side-ways move! When we come out of the current trading range, the price will likely test the ATH around $125 (red arrow) and primarily move within the green channel (the upper boundary $125-$150)! After that, the price may retrace to the upper boundary of the Cloud, and then likely move back up and into the gray channel (the upper boundary $2500-$3000)! Note that, since 2020, the $GME price structure has evolved within a giant RE-ACCUMULATION SCHEMATIC and therefore is likely a CONTINUATION PATTERN! Good luck! 💥💥💥

English
4
9
121
13.8K
Shahid Hussain
Shahid Hussain@Starbox2001·
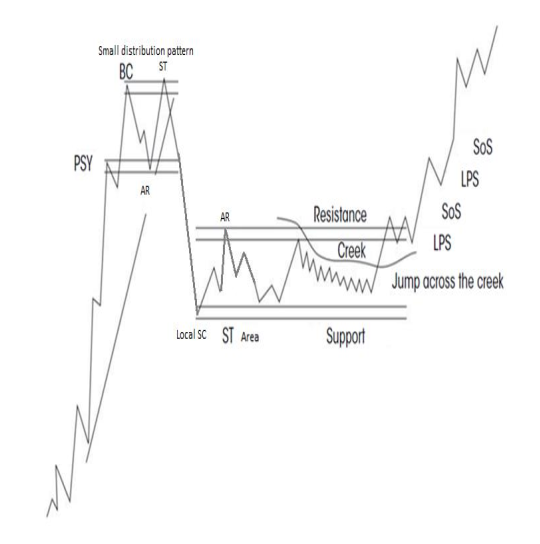
$GME Wyckoff Re-accumulation Schematic Landmarks explained Pic I The drawing shows important landmarks: after reaching the Buying Climax (BC), a small distribution structure plays out, which is composed of an Automatic Reaction (AR) and a Secondary Test (ST). Then, there is a sharp decline, resulting in a Local Selling Climax (Loc SC), followed by an Auto Rally (AR). After this, the price starts to move sideways, in a tight range, between the Support and the Resistance boundaries, in which it also forms a Creek! At some point, there will be a Jump Across The Creek and the price escapes the range-bound territory and rapidly starts to move up, and overcomes the Resistance! Then, the final Backup (BU) or the markup begins with a series Last Points of Supply (LPS) and Signs of Strength (SOS)! Pic II Monthly chart The same landmarks can be identified in the monthly chart of GME! The major support line is the monthly 200 MA and the Resistance line is the upper edge of the Ichimoku Cloud around $60)! Note that the price has hit the edge of the CREEK three times! IMO, a move >$28 should be the Jump Across The Creek! Pic III Weekly chart The golden lines mark the major support and resistance lines! The SPRING, which is an important event within the Wyckhoff Re-accumulation schematics, caused the price break the major support line! This is an important liquidity sweep: a false move to the downside by the Composite Operator (CO) so that the weak hands sell their stock and the CO can scoop up those shares at record low prices! The Resistance is formed by the upper edge of the Creek and the weekly Ichimoku Cloud around $28! Pic IV Daily chart This timeframe provides more granular detail and shows how the price perfectly hit the upper edge of the Creek three times and should be able to break it the next time! Also note, how the price + all of the moving averages + the Cloud is tightly squeezed into the apex of this wedge/triangular structure! POC = point of control. No Financial Advice! Just my opinion! Good luck!!!
Shahid Hussain tweet mediaShahid Hussain tweet mediaShahid Hussain tweet mediaShahid Hussain tweet media
English
2
7
66
4.7K
Shahid Hussain
Shahid Hussain@Starbox2001·
@GrubynaBramce Yes, I know how the Cloud looks like! And you are right; the price doesn't need to wait for the thinnest portion to cross it! Look at the 2020 chart; it didn't wait for the thinnest portion then! Sorry this the last reply to you. let's agree to disagree!
English
0
0
3
48
Gruby na Bramce
Gruby na Bramce@GrubynaBramce·
@Starbox2001 Ignore the lines and look at the monthly Ichimoku only please. It's thinnest in November 2027, which makes it the most probable place for a breakthrough.
English
1
0
0
53
Shahid Hussain
Shahid Hussain@Starbox2001·
$FFAI 4-hrs and daily charts Just a quick update It’s a nice run! On the 4-hrs chart, we are entering the red Cloud; may get a rejection, unless the volume massively increases! Watch the daily 100MA around $0.65 and the daily 200 MA around $1.16! And of course the gap fill!
Shahid Hussain tweet mediaShahid Hussain tweet media
English
0
3
11
1.2K
Shahid Hussain
Shahid Hussain@Starbox2001·
sorry I can't make sense of this chart; no one knows for sure; however, if there is a catalyst like an updated form 13D from RC showing increased stake in EBAY, that, imo, will be a game changer; all this is strikingly similar to what happened between RC and GME in jan 2021 before RC became chairman of the board and then CEO of GME. Thanks.
English
1
0
0
75
Gruby na Bramce
Gruby na Bramce@GrubynaBramce·
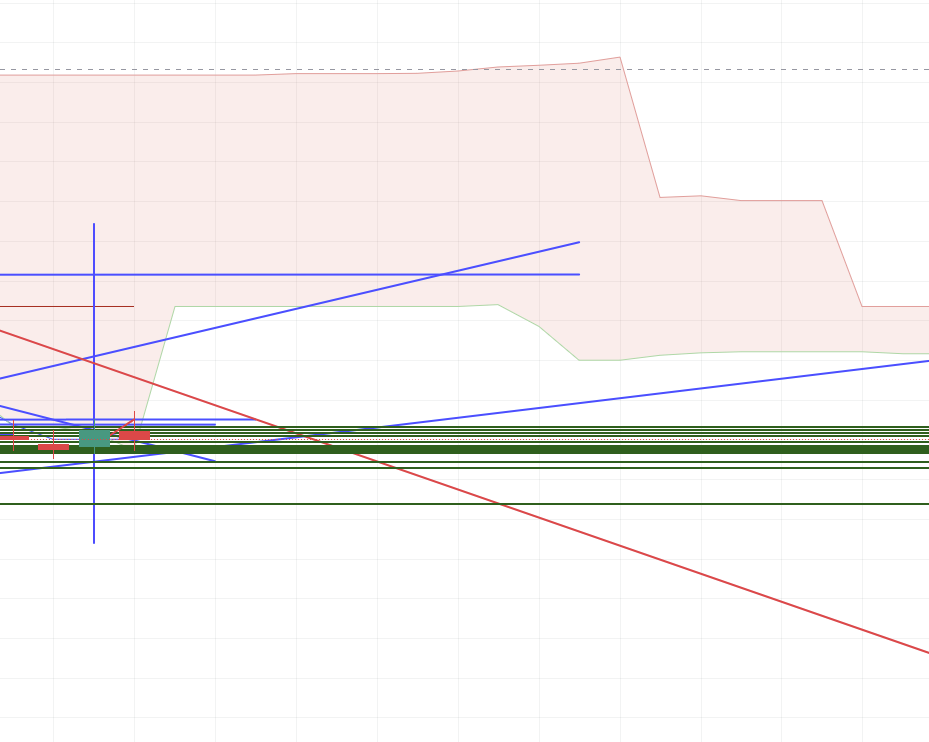
@Starbox2001 If I were to be completely honest, I would say that the next period of "thin", easy to break monthly Ichimoku is November 2027... (the last centimeters on the right here).
Gruby na Bramce tweet media
English
1
0
0
56
Shahid Hussain
Shahid Hussain@Starbox2001·
Oh Okay; got it; yes, I give you that; the green dotted line has approximately similar steepness (maybe a little less even) as the massive price surge in Dec 2020/Jan 2021. My chart and the posts are just my opinion. It is OK to disagree but please show me your chart, which may show us how and why yours is different. Thanks!
English
1
0
1
69
Gruby na Bramce
Gruby na Bramce@GrubynaBramce·
@Starbox2001 The first two points - no problem. But the third one has no real justification - it could be any single one of the points on the chart. In other words, the width is OK but the angle doensn't seem to have justification.
English
1
0
0
55
Shahid Hussain
Shahid Hussain@Starbox2001·
@GrubynaBramce Disagree. The larger gray channel is just an extension of the ATL in 4/2020 and the ATH in 1/2021; sorry, there is nothing arbitrary about this.
English
1
0
2
148