在专业回测系统的支持下,期权策略的逻辑、执行、对冲和损益分析都会变得一目了然,欢迎大家体验
Jeff Liang@JeffLia12309881
客户测出来的nb策略,他怀有回测的愿望很多年,终于实现了。
中文
Alex Wu
10 posts

@StochAlex07
Options Quant @ https://t.co/1N1kClHJz3
客户测出来的nb策略,他怀有回测的愿望很多年,终于实现了。
太强了!感谢 @GreeksLive 团队! 先说回测结果本身:每月双卖30天 $btc ATM跨式+每日delta对冲,Sharpe 0.84,胜率63%,最大回撤0.14 BTC。数字不夸张但是非常真实的卖方的样子:稳定收租,偶尔挨打,长期为正。 这种带DDH模拟的期权策略回测,在美股市场都是稀缺品。 美股做期权回测的工具不少(ORATS、OptionVue、TastyTrade),但大多数只能回测静态策略,比如“每月卖一个iron condor然后持有到期”。 一旦你想加入DDH,就需要完整的历史期权链数据(不是只有ATM vol,而是每一个strike,每一个到期日的完整曲面),加上一个能模拟每日调仓滑点和交易成本的引擎。 这套东西在美股要么自己写代码+买OptionMetrics的数据(一年几万美元),要么用机构级平台。散户基本接触不到。 而在加密期权市场,这种工具在此之前根本不存在。你想回测一个Deribit上的卖方策略加DDH?自己写Python爬历史数据慢慢搭。 现在GreeksLive直接把这个做成了产品,而且是带SABR模型一致性的回测,这意味着你回测时用的Greeks和你实盘时用的Greeks是同一套模型算出来的,不存在“回测用BSM实盘用SABR”的错位问题。 做时间的朋友之前,先得有工具验证时间到底是不是你的朋友,对吧? @JeffLia12309881 的波动率交易课程,不仅仅是教授知识,其实我觉得更多是一整套系统的东西。 欢迎大家加入我们Crypto期权社区一起讨论:t.me/GlobalLife2023
我和Quant Alex @StochAlex07的讨论:Vega*∂Sigma/∂F是否可以被称为Vanna项? **Compressed Summary: Jeff & Alex Wu Discussion on “whether Vega × ∂Sigma/∂F is a Vanna term?”** ### Core Question (Jeff) Jeff asks why many traders call **Vega × ∂Sigma/∂F** (Smile Delta / Shadow Delta) a “Vanna term” under implied vol surface context. He notes this term represents **spot-induced IV change due to moneyness shift**, but it differs from the classic cross-derivative ∂²P/(∂F ∂Σ). He wants to know if this broader usage is valid. ### Alex’s Clear Verdict **No — it should not be called Vanna.** The “broad interpretation” is **sloppy and mixes two different concepts**: - **Classical BS Vanna**: Second-order Greek — how Vega changes with Spot, or how Delta changes with IV (inside BS PDE). - **Vega × ∂Sigma/∂F (Smile Delta)**: Describes **realized spot–IV dynamics** (how the implied volatility surface itself moves when spot moves). Alex: “They are not the same thing — their explanatory targets are completely different.” ### Why the Confusion Exists - In pure BS, Vanna and Volga were introduced to handle Greeks sensitivity to spot/IV moves. - Spot-induced IV changes are a **separate phenomenon**, addressed by market conventions: - Sticky Strike / Sticky Delta / Sticky Local Vol - Implied Skew (quick proxy for spot-vol linkage) - Calculating full strike-by-strike spot-IV correlations is impractical, so desks focus on **Spot vs ATM IV dynamics**. ### Modern Practical Approaches (Beyond BS Vanna) 1. **Parametric Vol Dynamics** (SEPP / SVI / Vola Dynamics path) Regress dSpot & dATM Vol → derive each strike’s dIV/dF. Focuses on **smile shape**, not stochastic dynamics. Naturally compatible with sticky rules. 2. **Stochastic Volatility Models** (e.g. SABR) Directly links implied skew to **spot-vol covariance**. A Vanna-like term appears in the PDE, but **Bartlett Delta contains no Vanna**. ### Key Takeaways - Smile Delta’s essence is **spot-vol covariance + smile shape**, unrelated to classical BS Vanna. - The popular “Vanna = Smile Delta” shorthand is convenient market talk but **technically inaccurate**. - Real trading desks have long moved beyond pure BS Greeks precisely because BS Vanna alone cannot capture actual vol-surface behavior. **Conclusion**: The terminology is misleading. Vega*∂Sigma/∂F and Vanna explain different objects and should not be conflated.

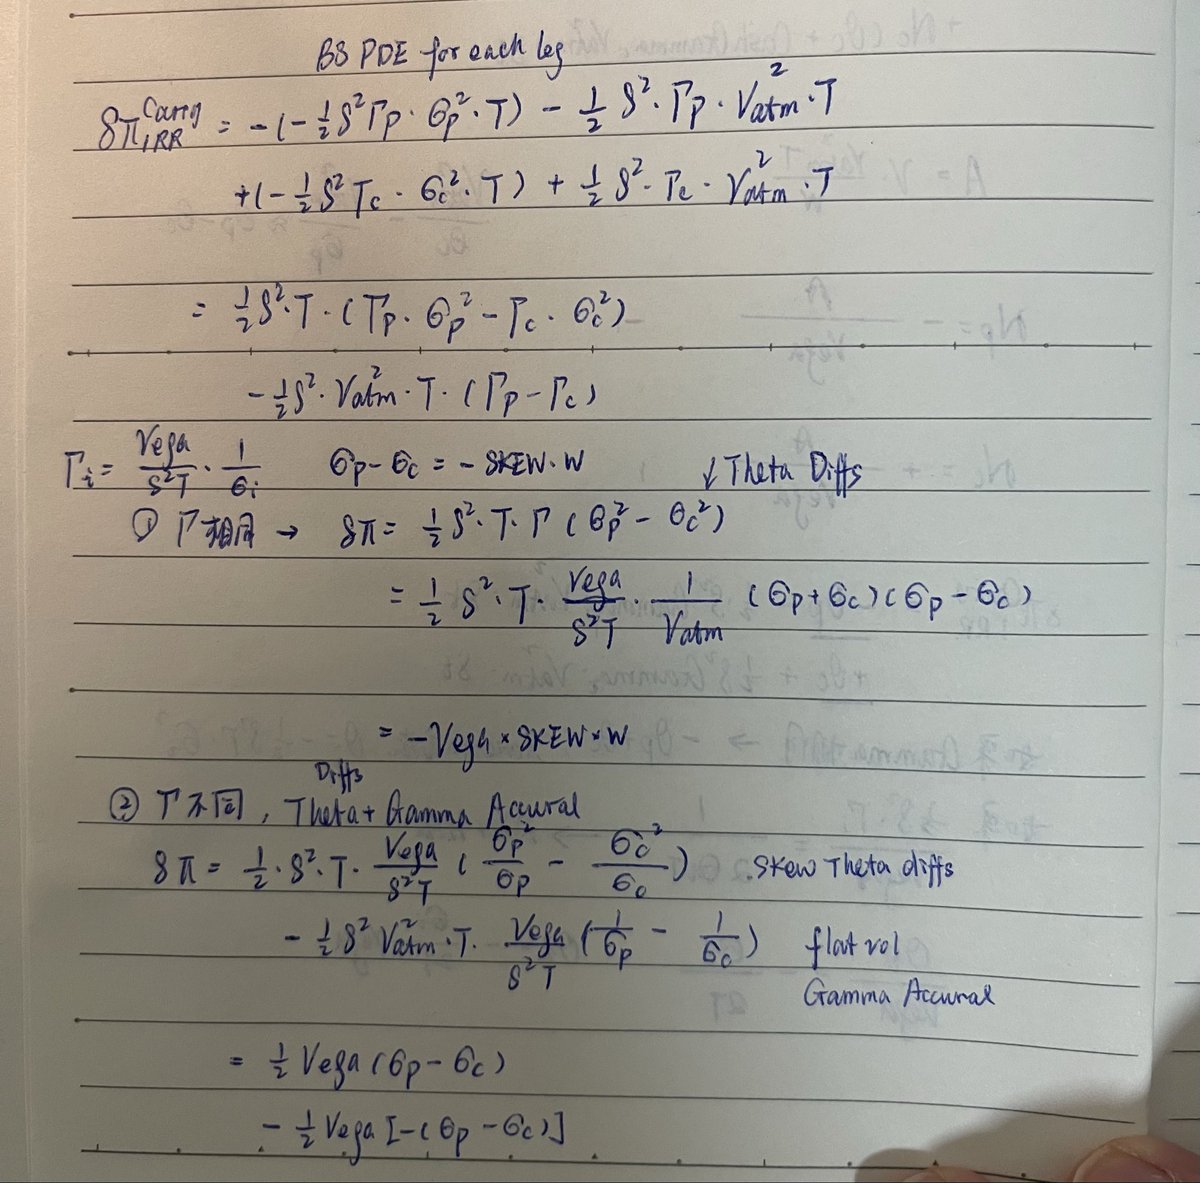
和公司Quant Alex @Vladimir114514 讨论SABR Theta vs Spot Theta+Cross Theta+Vol Theta的差异。 附上英语浓缩,方便英语读者。 English Summary (Compressed) The chat discusses the key differences between SABR Theta and the granular Spot Theta + Vol Theta + Cross Theta in the SABR model, mainly for P&L attribution and risk management. Main Points: Relationship: SABR Theta − SABR Gamma ≈ Spot Theta + Vol Theta + Cross Theta − Spot Gamma − Volga − Vanna. They are mathematically related but not the same. Definitions: SABR Theta (dC/dt): Directly calculated from Hagan’s implied volatility approximation formula (closed-form). Spot + Vol + Cross Theta: Derived from the SABR PDE, offering a detailed 3-dimensional time decay breakdown. Key Differences: SABR Theta is a quick, formula-based total theta. Spot/Vol/Cross Theta is PDE-consistent and provides better economic interpretability. SABR Theta does not explicitly separate certain cross terms (e.g. ∂B/∂σ × ∂σ_imp/∂τ). Practical Usage: Current P&L systems require Spot + Vol + Cross Theta for full 3D risk explanation. Using pure SABR Theta + SABR Gamma reverts to Hagan’s original simpler framework (“another story”). With SABR Theta, time decay is largely absorbed into the gamma/theta pair. Conclusion: SABR Theta is a convenient approximation, while Spot + Vol + Cross Theta is preferred for precise, granular P&L attribution. They serve different analytical needs.


传统市场里,同等级别的工具大致是这个量级: 纯波动率曲面/Greeks分析: IVolatility机构版大概$2-5万/年,OptionMetrics约$2.5万+/年。这些只是数据和静态分析,不带实时对冲输出。 带SABR校准+实时对冲+PnL归因的完整系统: Numerix、FINCAD这类专业定价引擎,$5-20万/年起步。Murex、Calypso这种全栈交易系统更贵,$10-50万/年,但包含的功能远超纯分析。 Bloomberg OVML(期权波动率模块)内置在Terminal里,单seat约$2.5万/年,但SABR校准精度和自定义程度远不如专业工具。 所以一个SABR校准+曲面动态调整+实时Greeks+PnL分解+回测+API接口的打包方案,在传统市场对标大概$5-15万/年/seat是合理区间。 Jeff把这套东西做成crypto原生版本…. 为 @GreeksLive 团队的工程能力点赞! 欢迎大家加入我们crypto期权社区:t.me/GlobalLife2023