Sabitlenmiş Tweet
Supa
1.3K posts


Supa retweetledi


ive created a sheet that calculates the number of trades to lose an account and risk or ruin (probabilistic) based on your model W/R and R/R
if you want just drop a RT and subscribe to @TheLabLive" target="_blank" rel="nofollow noopener">youtube.com/@TheLabLive and i'll DM you the link for you to copy on your google sheets

English
Supa retweetledi

Let’s do a drone light show over an uncontacted tribe and become their gods 💀


English
Supa retweetledi

Supa retweetledi

Supa retweetledi

Supa retweetledi

Guys,
Regards $YM. You have to understand one thing, and I’m willing to die on this hill. They keep selling you imaginary stuff to make you think you have so much to learn, so you’ll always feel subpar and keep searching for the next “secret” to become profitable. Now $YM is suddenly super popular. Why?
Because SMTs are all over the place. And when you apply the “triad,” there will always be some SMT. That way they can always say: “Look how great I am, I spotted one of the 100 SMTs, I’m better than you, come learn from me.”
First of all, the correlation between $NQ and $YM is around 0.44. In statistics, anything below 0.7 is considered only moderate correlation. That means it’s too weak to draw consistent conclusions, and won’t be used in finance.
This is a textbook case of Overfitting.
“Overfitting is when a model learns its training data too perfectly, including irrelevant noise, and performs poorly on new data. It memorizes details rather than general patterns, making it unreliable in the real world.”
Another thing: up until maybe 4-5 months ago, no one even mentioned $YM. Now suddenly everyone is trading it. Please explain what changed. Did we really discover something new after decades of markets? And how come zero verified traders who’ve made hundreds of thousands trading indices never touch $YM?
These sales people don’t even know how $YM is priced (it’s a price-weighted index, unlike $ES and $NQ which are market-cap weighted) and it shows. Structurally they cannot be correlated.
Please, don’t get scammed.
One Product.
One Session.
One Model.
Until you’re profitable. Then you can start experimenting.

English

Supa retweetledi

If @4500px influenced your trading in anyway, consider donating to his funeral expenses.
Any donations remaining will be given to a Mental Health Charity/Suicide Prevention Organisation, both to support others in need and to honour Tyler’s memory.
Toast@AnAwesomeToast
Here is the LInk. ❤️ gofundme.com/f/TylerFuneral…
English

RIP to a legend @4500px 👑
was an absolute pleasure working alongside you in chroma over the years & seeing what a truly disciplined trader is
you will be missed but your knowledge will be forever shared♥️
JONZi@jonzitrades
legendary trades #9 setup: H4 Raid + FVG - H4 [RAID + FVG] as our HTF POI - HTF draw of liquidity (reason for price to move) - Original consolidation, BSL/SSL to target - Equal low/highs being built followed by intraday shift and displacement, with FVG entry cc: @4500px
English
Supa retweetledi

🚨 APEX GIVEAWAY 🚨
1/ 5x Apex accounts to win!
must follow my Twitter, retweet & comment this post.
2/ 3x others Apex accounts to win!
must join my new free Telegram: t.me/ForecasterGang
2 chances to win an account of YOUR choice: from $25K up to $300K!
Ends in 1 week!
English


Supa retweetledi


Supa retweetledi


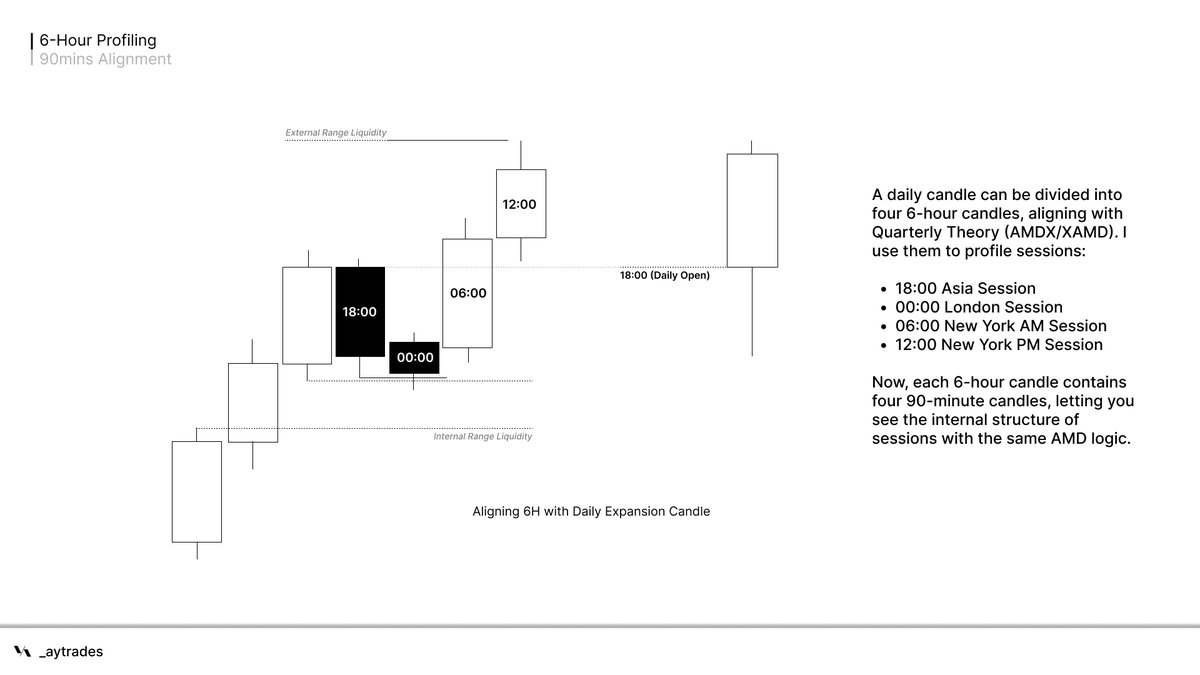
Are you struggling with GxT profiling?
It’s not the model it’s the way you’re aligning the expansion candles.
I used to have the same issue with 4H profiling, until I simplified everything. The real clarity comes from using 6H profiling with 90m. It gives a much sharper view on the higher timeframe, which is the key to consistently spotting high quality setups.
I’ve put it all together and made a clear blueprint so you don’t have to waste time figuring it out.
Comment "6H Profiling" and make sure you’re following so I can send it over. 📩
English