Casey
11.6K posts


Casey
@Team2Trading
Professional options trader • Not financial advice
Katılım Haziran 2020
0 Takip Edilen52.1K Takipçiler


@Raj791048857519 It’s called a typo. And no I’m not correcting it 🤣
English
Days like today bring out the “coulda, shoulda, woulda” in all traders.
We look at the options price from high to low, then calculate what could have been and how much we left on the table.
Well guess what?
If you even caught a small piece of one of those moves today then you did a great job!
We’re talking top 1% great.
Don’t forget that part when you are doing your hindsight calculations tonight 💚
English
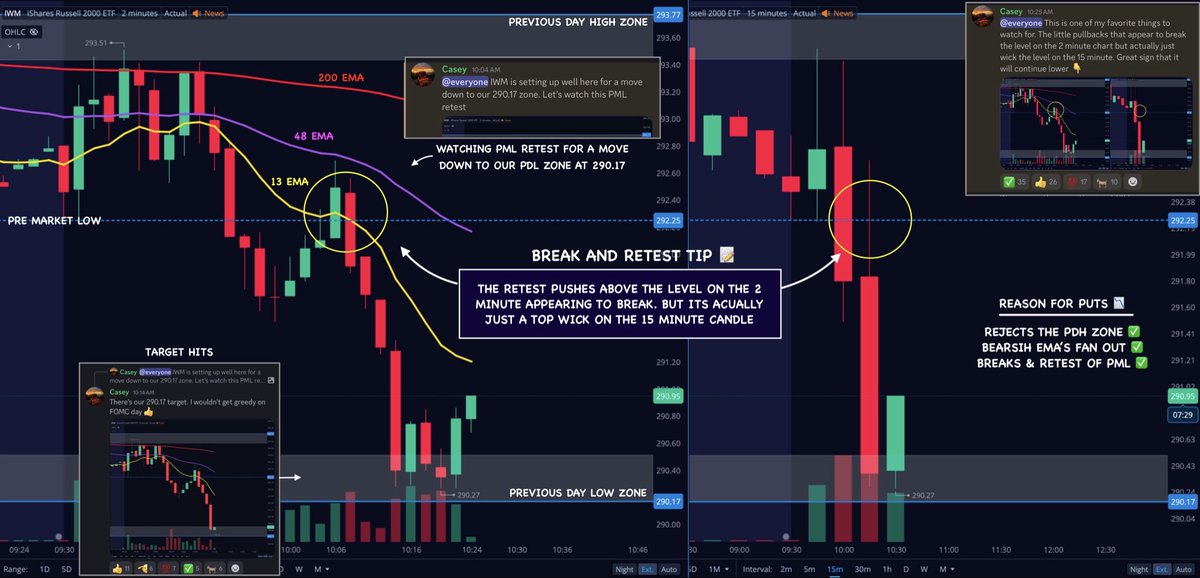
@savagelybeaten That wick happens in the first couple minutes of the 15 minute candle as it rejects the EMA’s on the 2 minute chart. This is showing you that the support is flipping to resistance and the EMA trend is getting respected 👍
English

@Team2Trading Help me understand this one. At the time the 2m is above the level, the 15m is also above the level. The wick only forms after the fact. So there's no way to know that until after it happens.
English
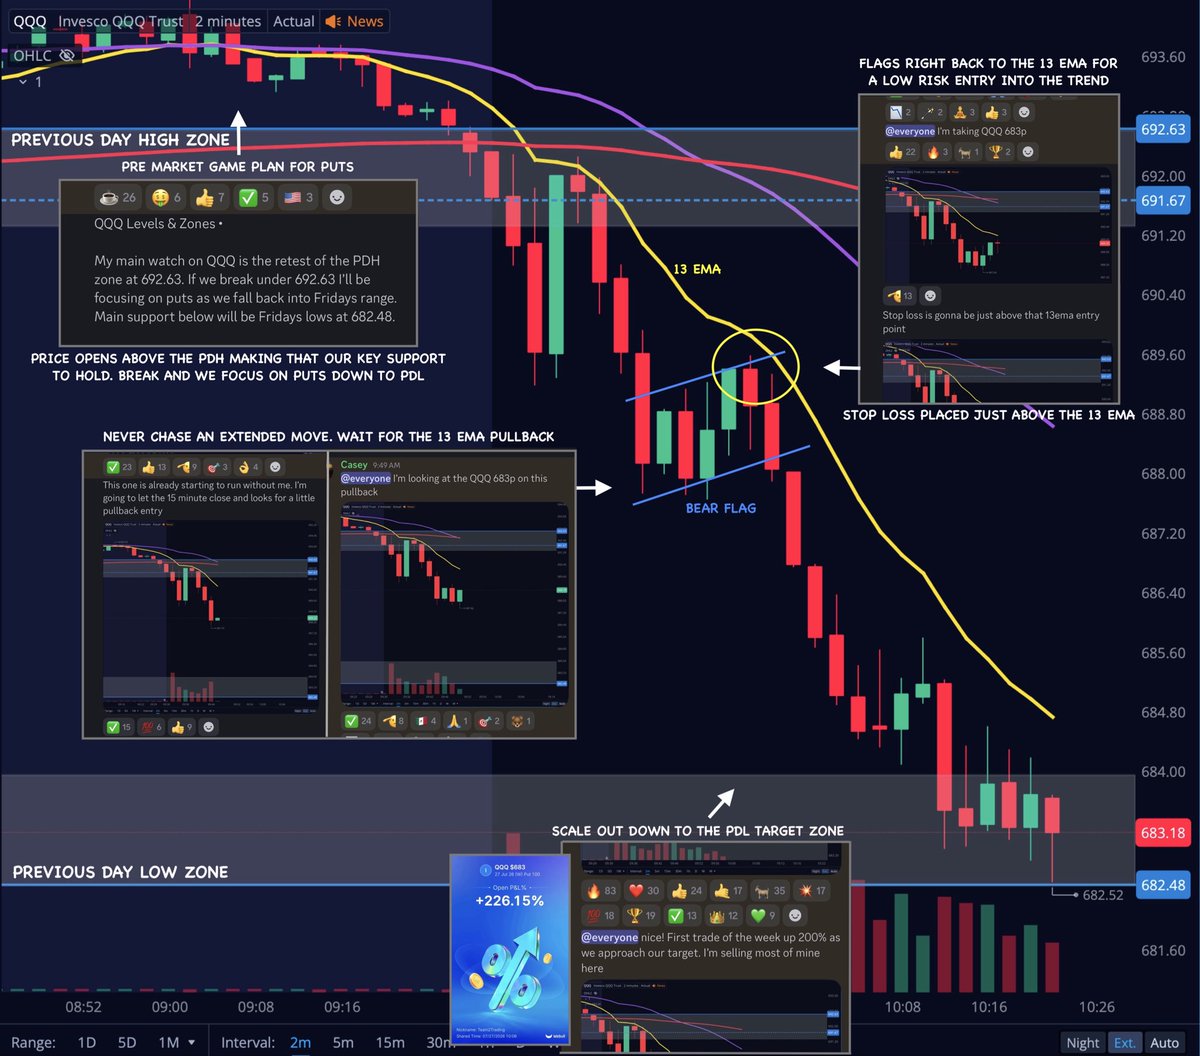
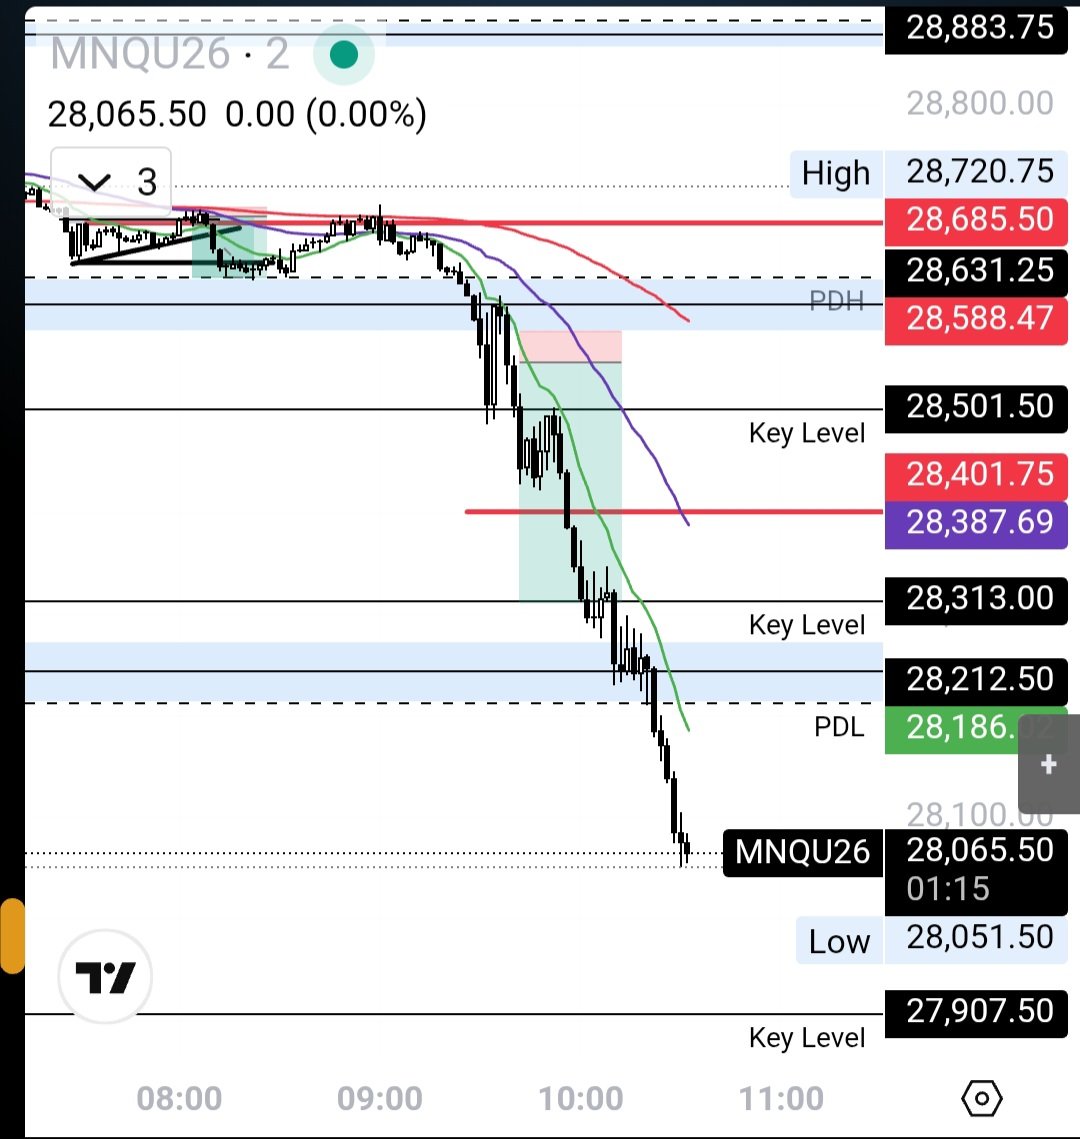
Need an A+ setup?
Here’s an excellent one to study for trading puts / downside 📝
This is the sequence / flow👇
📌 Rejects PDH zone
📌 Bearish EMA’s fan out
📌 Break & Retest of pre market low
The 15 minute candle close confirms the break of pre market low ✅
Then watch the 2 minute chart when it pulls back for the retest of the level + EMA trend for an entry ✅
It’s a solid setup that anyone can learn and watch for on a daily basis 🤙
$SPY $QQQ $IWM
English


@Team2Trading break and retest short off the PML on the QQQ/NQ for a 200%. Credit this strat to you.

English

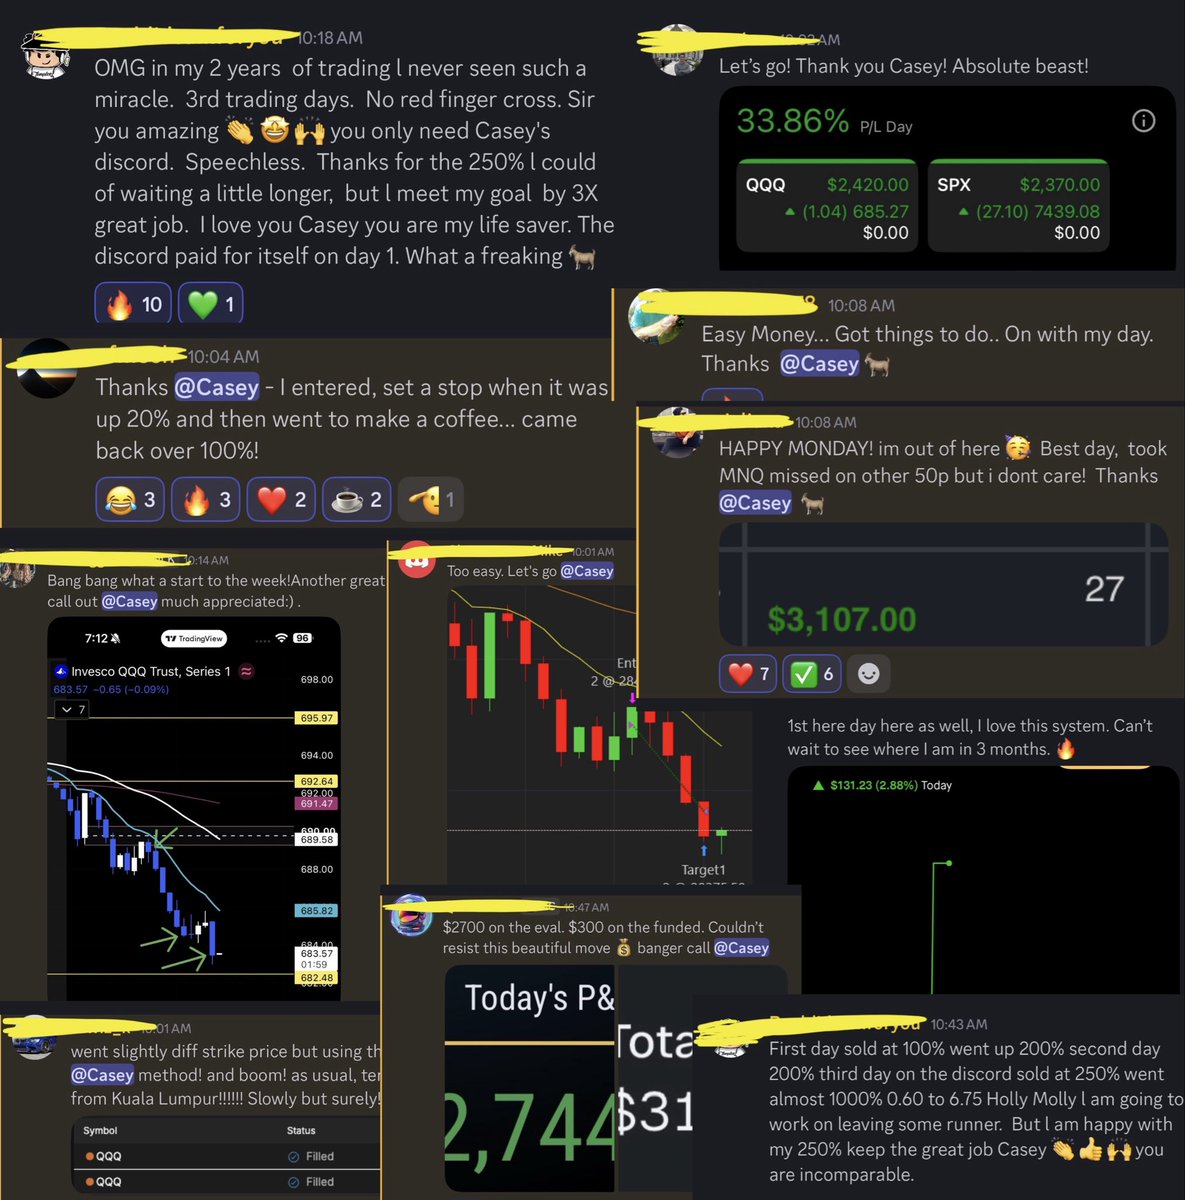
Completely locked in this month throwing down a win rate of over 80%+ through all of July 🎯
Feels like it’s been back to back 100%+ trades every single day! 🤯
The highlight real is absolutely insane…
$QQQ +500% ✅ $QQQ +215% ✅
$QQQ +110% ✅ $QQQ +210% ✅
$QQQ +100% ✅ $QQQ +150% ✅
$IWM +200% ✅ $QQQ +125% ✅
$QQQ +110% ✅ $SPY +100% ✅
$QQQ +120% ✅ $QQQ +200% ✅
$QQQ +230% ✅ $SPY +115% ✅
While this isn’t that far off from our usual stats I know July has been tough for many traders out there…
So it feels really good to have performed at such a high level for the team during such a difficult month.
Cheers gang! Let’s keep it rolling 🍻


English
Casey retweetledi
My DM’s are absolutely flooded so we’re bringing it back by popular demand!
The biggest promo we’ve ever done 💥
Use code “TEAM2” for 50% off your membership! For life!! 🥳⬇️
whop.com/team2trading
When I ran it at the beginning of the month I said “welcome to the winning team!”
Here we are just 3 weeks later with an 80% win rate and over a dozen home runs already alerted this month 💚
Let’s keep it rolling gang. We’re gonna continue to raise the bar and set the standard out here! 🤙


English

@Team2Trading Indeed. Anybody thinking about joining T2T - do it!! I hear he’s doing a discount which I’ve never seen. I’ve been a member for years!
English

@RahShuheb @tradertheory Thanks. Just posted a thread on that over the weekend if you want to check it out 👍
English

@Team2Trading @tradertheory @Team2Trading Thanks for the daily lessons! Quick question on execution: what is your exact trigger for entering a trade? During the session, we see a lot of EMA crossovers—how do you filter out false signals and know this is the right time to pull the trigger? Thanks
English

Profitable traders in the game for 3 years+
What’s the fastest way to get profitable?
English

@Team2Trading My two trades this morning. Yeah first trade i missed soo much. Second trade, sold for 235pts only for it to drop to nearly 640. 😭
Nonetheless, I am grateful. 🙏

English

@Trades2BeFree The PMH aligned with the upper resistance.
The PML was just above the PDH zone (put trigger).
So they weren’t really needed today 👍
English

@Team2Trading Don't you usually map out PMH and PML as well? Why wasn't break of PML part of your decision today?
English
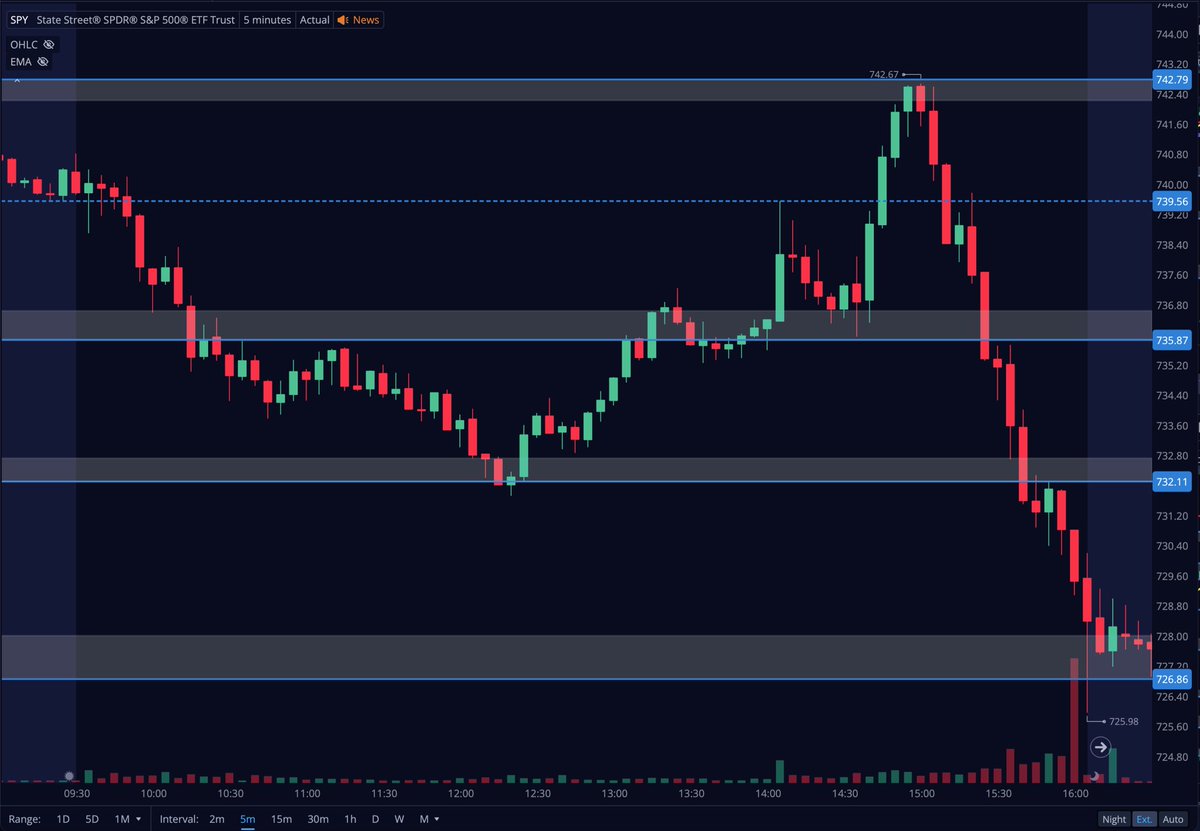
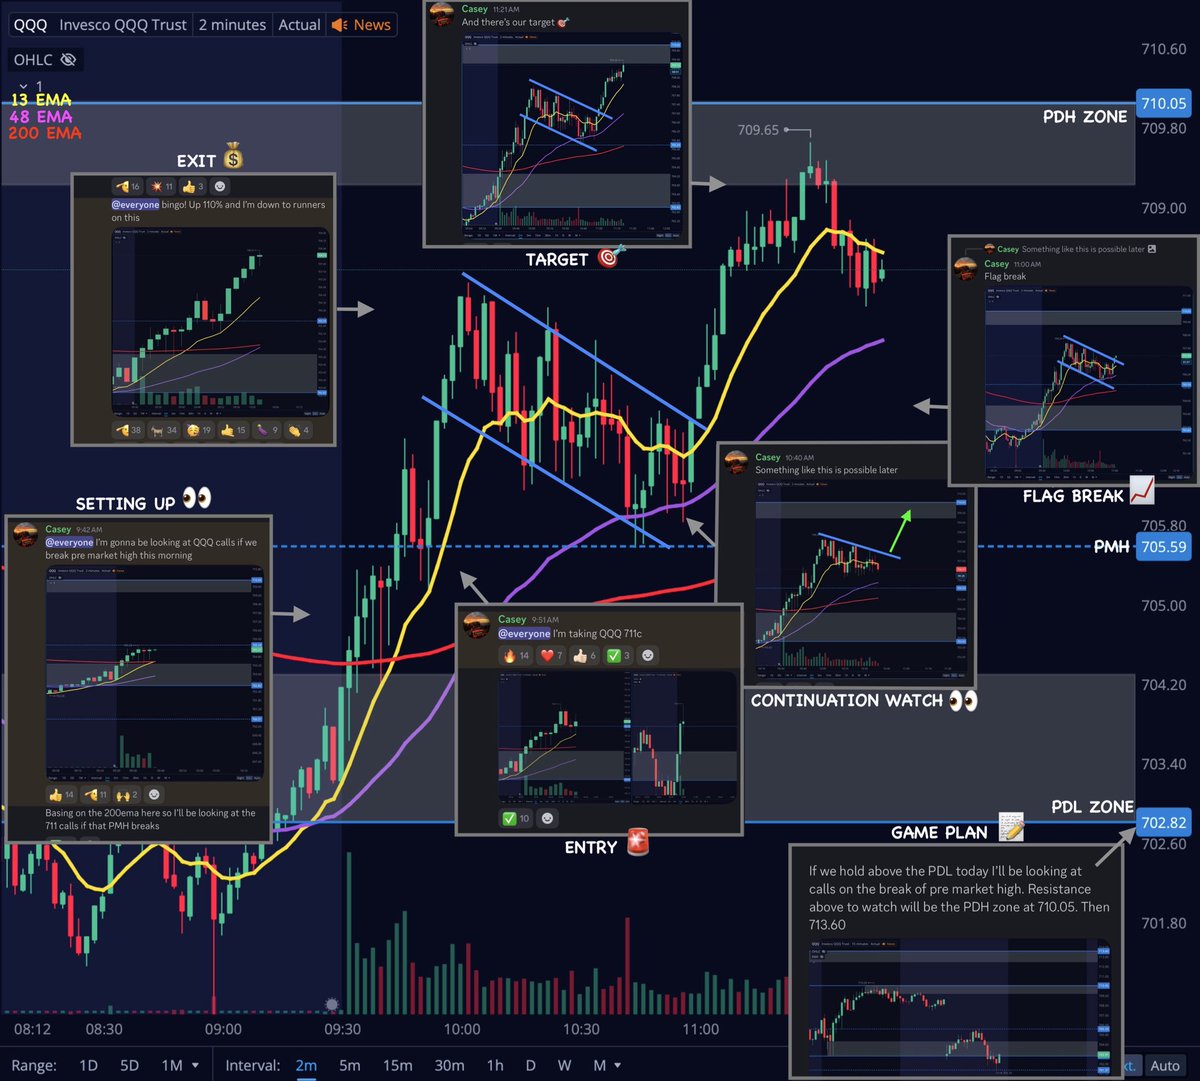
How to create an unbiased game plan for trading $SPY using levels & zones 📝
I would like to show you the before and after from our pre market prep this morning.
Every day there are high quality areas for both long and short opportunities.
Chart them out. And wait for them to trigger.
Follow the levels. Not your bias 🤙


English