Aksel Kibar, CMT

43.7K posts

Aksel Kibar, CMT banner
Aksel Kibar, CMT

Aksel Kibar, CMT

@TechCharts

Chartered Market Technician (CMT) and Classical chart trader. Ex-Fund manager. 📈 ➡️ https://t.co/VSwr0eryIS 📺 ➡️ https://t.co/XFZI3RE8aj

Bansko, BULGARIA Katılım Mayıs 2011
447 Takip Edilen179.3K Takipçiler
Sabitlenmiş Tweet
Aksel Kibar, CMT
Aksel Kibar, CMT@TechCharts·
Consider TechCharts Membership- Weekly Global Equity Reports, breakout alerts, Educational Video - Classic Charting. blog.techcharts.net
Aksel Kibar, CMT tweet media
English
100
48
457
0
Aksel Kibar, CMT
Aksel Kibar, CMT@TechCharts·
Many charts needed more time to consolidate. While technical outlook is intact on several names, breakouts are probably delayed. Well-defined ranges take time to become mature. Meanwhile these consolidations offer trading opportunity between the boundaries.
Aksel Kibar, CMT tweet media
English
0
0
25
9.5K
Aksel Kibar, CMT
Aksel Kibar, CMT@TechCharts·
Edwards & Magee and Schabacker discussed the H&S continuation in their book. In the new technical analysis books, this is not well covered. There is a misconception that H&S can only form as a reversal at the bottom or top. H&S can act as a continuation chart pattern as well.
Aksel Kibar, CMT tweet media
Aksel Kibar, CMT@TechCharts

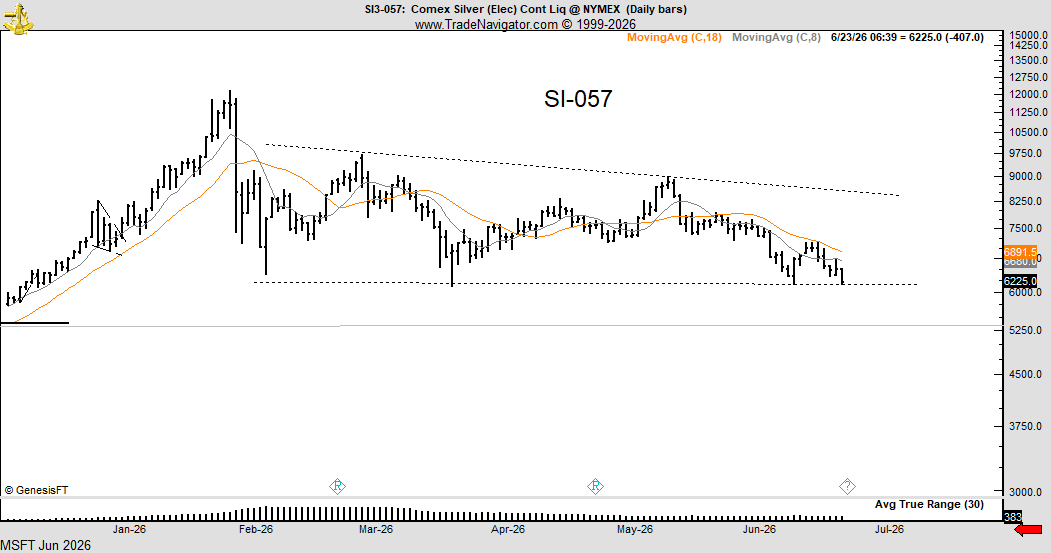
Stocks that hold well during volatile market conditions will be the first to breakout when momentum returns. #TECHCHARTSMEMBERS I covered this setup under the #watchlist A text-book H&S continuation chart pattern Access >> tinyurl.com/d95snfm9

English
3
4
62
14.2K
Aksel Kibar, CMT
Aksel Kibar, CMT@TechCharts·
Breakout, pullback and continuation? A H&S continuation with a re-test. Candidate for a Type 2 breakout. Price action that remains above Last Full Day low (intraday price action not closing basis) and reach price objective are categorized as Type 2 breakout. $KRNY
Aksel Kibar, CMT tweet media
English
2
2
57
14.8K
RoosterCoe
RoosterCoe@RoosterCoe·
@TechCharts Axcell abi yapıyorsun bu sporu valla 👈🏻👏🏻
Türkçe
1
0
1
110
Aksel Kibar, CMT
Aksel Kibar, CMT@TechCharts·
#GOLD last support before heading to the lower boundary of the channel.
Aksel Kibar, CMT tweet media
English
29
72
653
66.5K
YAGIZ YAVUZ
YAGIZ YAVUZ@YaazYooz·
@TechCharts Örnek, 12'ler iyi bir alım yeriydi ki bu tarz yapılarda daha çok breakout sonrası yerine, dibe yakın almak mantıklı geliyor.. (stoplu) Siz ne düşünüyorsunuz hocam?
YAGIZ YAVUZ tweet media
Türkçe
1
0
0
98
Aksel Kibar, CMT
Aksel Kibar, CMT@TechCharts·
$BCAX Type 2 breakout. Reached its price objective after a re-test of pattern boundary. Polarity principle, previous resistance becomes the new support.
Aksel Kibar, CMT tweet media
English
5
1
44
18K
Aksel Kibar, CMT retweetledi
The Factor Report
The Factor Report@PeterLBrandt·
Lookout below?? $SI_F
The Factor Report tweet media
English
27
20
261
71.6K
Aksel Kibar, CMT
Aksel Kibar, CMT@TechCharts·
#SILVER Support at 61. Breakdown can send prices lower to long-term support at 50.
Aksel Kibar, CMT tweet media
English
20
51
532
41.8K
Aksel Kibar, CMT
Aksel Kibar, CMT@TechCharts·
@JulesJules_L I cover ETF's to give an overall perspective in equities. Breakout signals are focused on single equities. Chart pattern statistics are compiled from single equity breakouts. You can easily add the 3% breakout confirmation and act on the breakout.
English
1
0
3
557
Aksel Kibar, CMT
Aksel Kibar, CMT@TechCharts·
@Financialnews78 Sort of. Darvas Box was focusing on more short-term consolidation. Though the concept is the same.
English
0
0
4
647
Aksel Kibar, CMT
Aksel Kibar, CMT@TechCharts·
Best performing classical chart pattern historically: #rectangle Top 2 YTD: #rectangle Rectangle also has the highest Type 1 breakouts. Breakout and rally and usually past the price objective. If you are trying to simplify your chart pattern breakout trading, I don't see a better setup to start from.
Aksel Kibar, CMT tweet media
English
4
12
154
23.1K
Aksel Kibar, CMT
Aksel Kibar, CMT@TechCharts·
@ambeecious You are using adjusted chart. I am using unadjusted chart (excluding the dividends).
English
1
0
5
646
Rohit
Rohit@ambeecious·
@TechCharts How is it that your chart is showing a different price then mine , the breakout has already happened it seems
Rohit tweet media
English
1
0
0
261