Sabitlenmiş Tweet

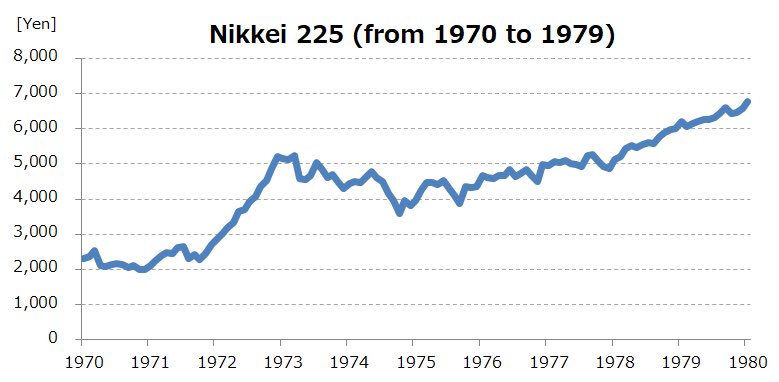
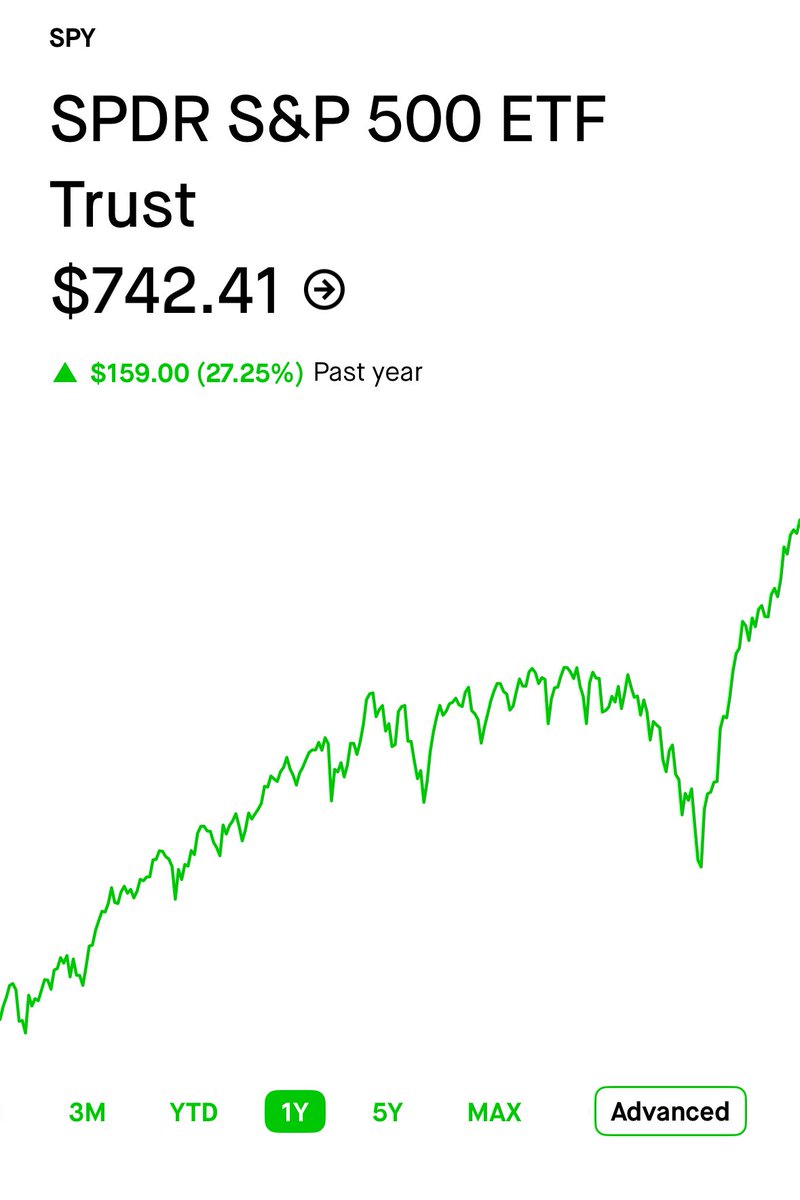
Japan’s Stock Market was up over 100% in 1972. The USA right now has a remarkably similar setup to Japan in the 70s. This month is just the start of a massive bull run that has never been seen before. $SPX could be in for a RECORD YEAR and here’s why:
The similarities between now and 1970s Japan:
• Excess liquidity flooded into a narrow group of assets
→ Japan: land, golf memberships, equities
→ Today: AI infrastructure, mega-cap tech, private markets
• Index concentration masked weakening breadth
→ A small group of winners carried the entire market higher
• Energy shocks hit during speculative expansion
→ 1973 OPEC crisis
→ Today’s geopolitical/oil supply disruptions
• Inflation stayed sticky while central banks were trapped
→ Tightening too hard risked recession
→ Staying loose fueled speculation further
• Valuations detached from underlying economic growth
→ Financial assets inflated faster than the real economy
And here’s the part most people miss:
Japan’s market didn’t collapse immediately after the oil shock.
The Nikkei continued climbing for years because liquidity and speculation overwhelmed deteriorating fundamentals.
That’s what makes late-cycle bubbles so dangerous.
They can survive bad news far longer than people expect.
The 1970s in Japan were not the crash.
They were the setup.
English