The Market Stats

451 posts

The Market Stats banner
The Market Stats

The Market Stats

@TheMarketStats

Quant trader. Posting trades, research

Moon Katılım Temmuz 2020
72 Takip Edilen13.2K Takipçiler
The Market Stats
The Market Stats@TheMarketStats·
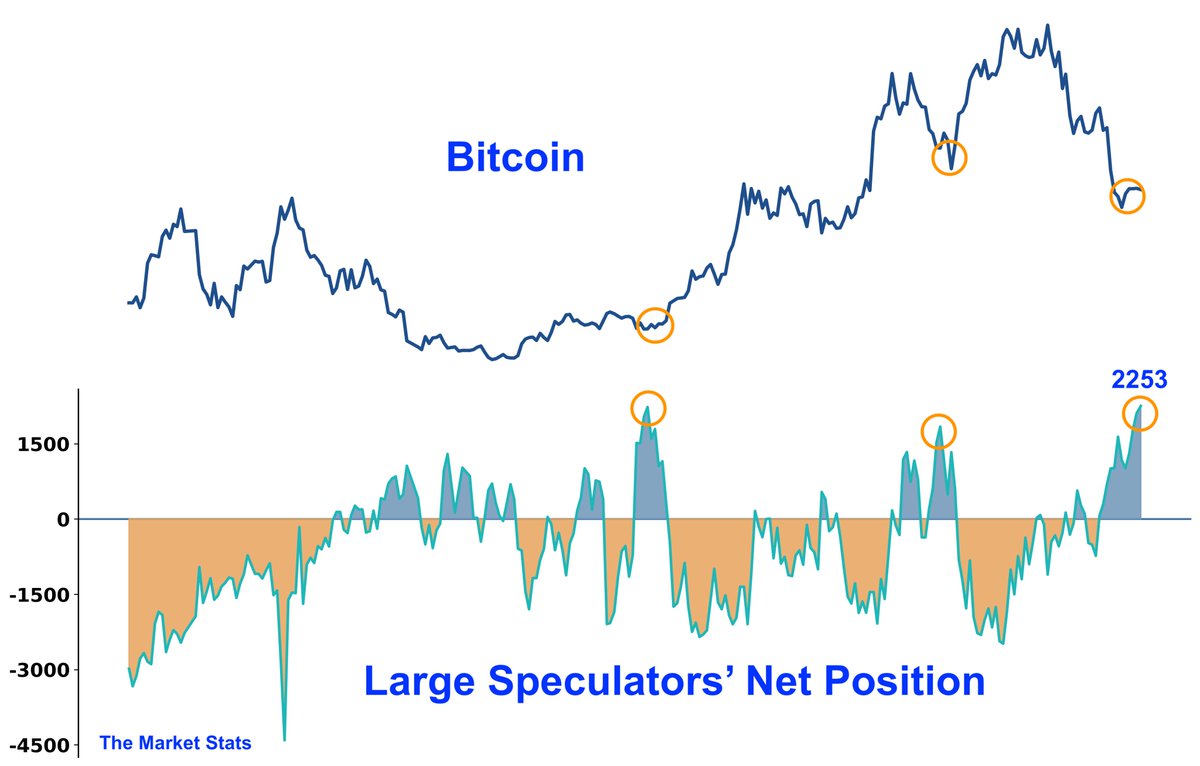
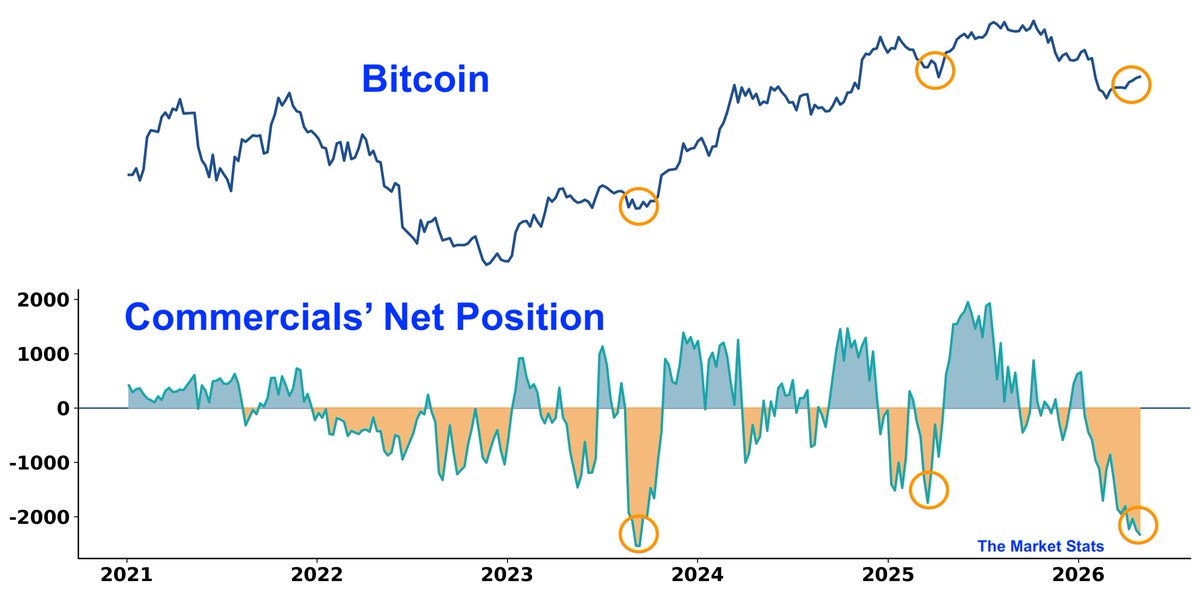
Commercials are extremely net-short Bitcoin This kind of extreme positioning historically aligned with bottoms in as seen in 2023, 2025 and today $BTC
The Market Stats tweet media
English
3
41
236
17.4K
The Market Stats
The Market Stats@TheMarketStats·
Another day, another record! Semiconductors $SOX are Up a record 17 consecutive days, with a gain of +42% Wild.
The Market Stats tweet media
English
3
14
115
7.3K
The Market Stats
The Market Stats@TheMarketStats·
History in the making today The Semiconductor Index ($SOX) is Up a record 16 consecutive days, gaining over +36% during this streak This has never happened before
The Market Stats tweet media
English
7
90
431
129.7K
The Market Stats
The Market Stats@TheMarketStats·
Despite stocks at all time highs, investors are still bearish AAII Bears have stayed above 40% for 6 consecutive weeks Similar bearish sentiment saw $SPX higher every time 3 months later Average gain: +7%
The Market Stats tweet media
English
7
33
189
25.1K
The Market Stats
The Market Stats@TheMarketStats·
NASDAQ is up 12 consecutive days Similar streaks saw $NDX finish higher 1 year later 100% of the time, with an average gain of +20% The average maximum loss was -8.9%
The Market Stats tweet media
English
8
34
164
23.6K
The Market Stats
The Market Stats@TheMarketStats·
@Barchart Nasdaq 100 up 12 days consecutive days is bullish $NDX higher 12 months later 7 of 7 times Average gain: 20.5%
The Market Stats tweet media
English
1
2
33
1.6K
Barchart
Barchart@Barchart·
JUST IN 🚨: Nasdaq on track for its 12th consecutive green day, its longest winning streak since July 2009 📈🥳🤑🫂
Barchart tweet media
English
60
209
1.6K
90.3K
The Market Stats
The Market Stats@TheMarketStats·
$VIX fell more than -40% in the past 13 days Historically, similar declines saw $SPX higher every time, 1 year later Average gain: +15% Max drawdown: -10.2%
The Market Stats tweet media
English
4
46
265
25.8K
The Market Stats
The Market Stats@TheMarketStats·
What a rally! NASDAQ 100 went from oversold to overbought in just 12 days When this kind of rapid shift occurred within a 5 week window, $NDX finished higher 7 of 8 times over the following week h/t @Mr_Derivatives
The Market Stats tweet media
English
2
32
177
9.8K
The Market Stats
The Market Stats@TheMarketStats·
NASDAQ is up 11 consecutive days Similar streaks of strong momentum saw $NDX finish higher 1 year later 100% of the time, with an average gain of +26% The average maximum loss was -8%
The Market Stats tweet media
English
11
107
538
49K
The Market Stats
The Market Stats@TheMarketStats·
NASDAQ 100 is up 8 consecutive days with a total gain over +9% Similar streaks saw $NDX higher in all 7 instances, 2 months later, with an average gain of +10.2%
The Market Stats tweet media
English
4
49
236
24.6K
The Market Stats
The Market Stats@TheMarketStats·
For the first time in a year, AAII bears have outnumbered AAII bulls for 8 straight weeks Sentiment getting stretched? Similar bear sentiment saw $SPX higher 9 out of 10 times, 3 months later
The Market Stats tweet media
English
3
33
185
11.1K
The Market Stats
The Market Stats@TheMarketStats·
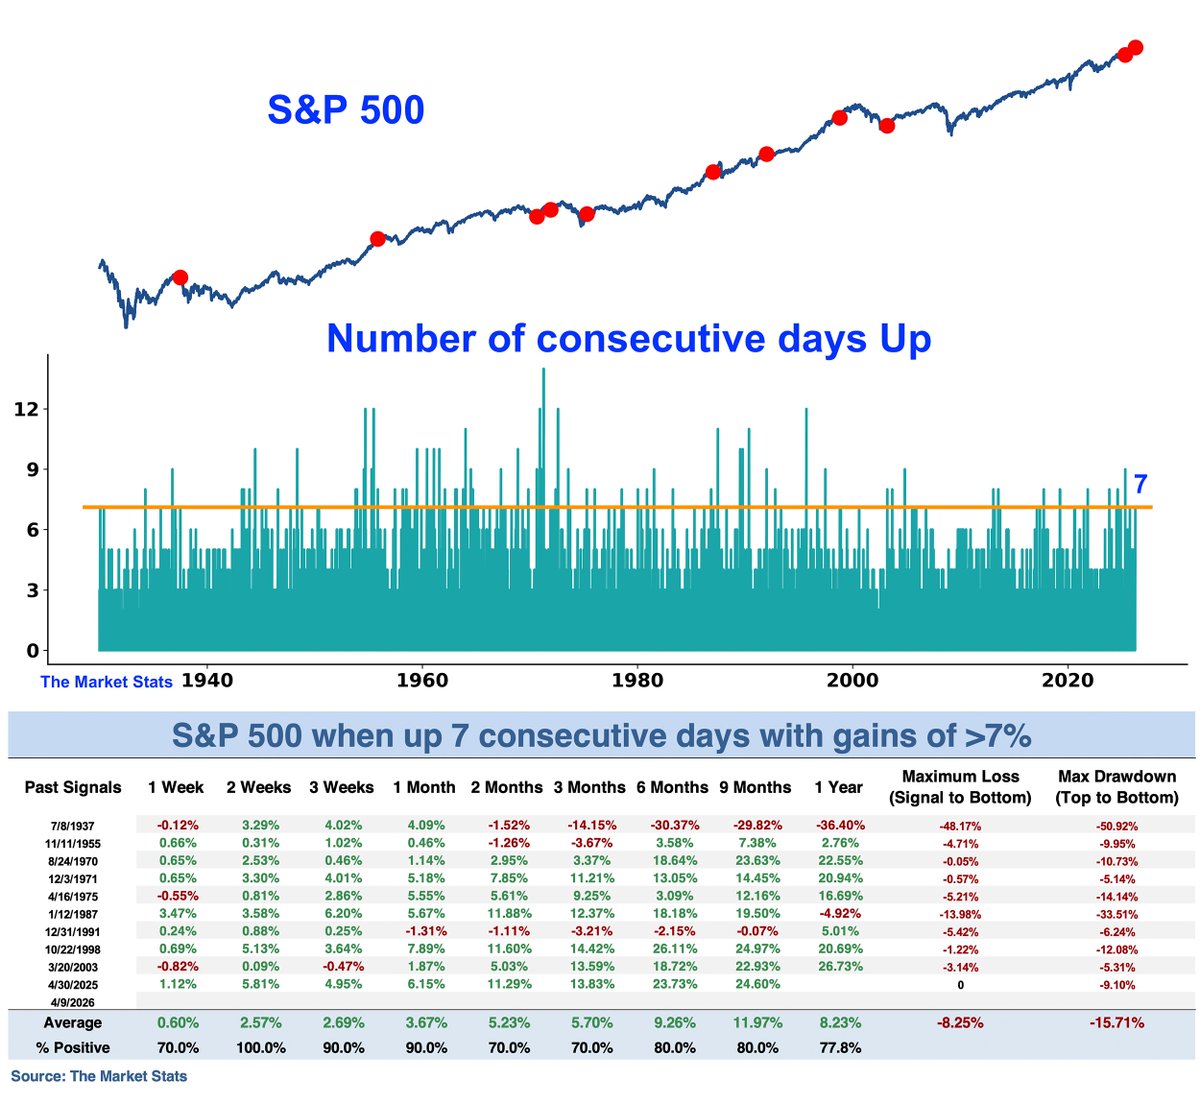
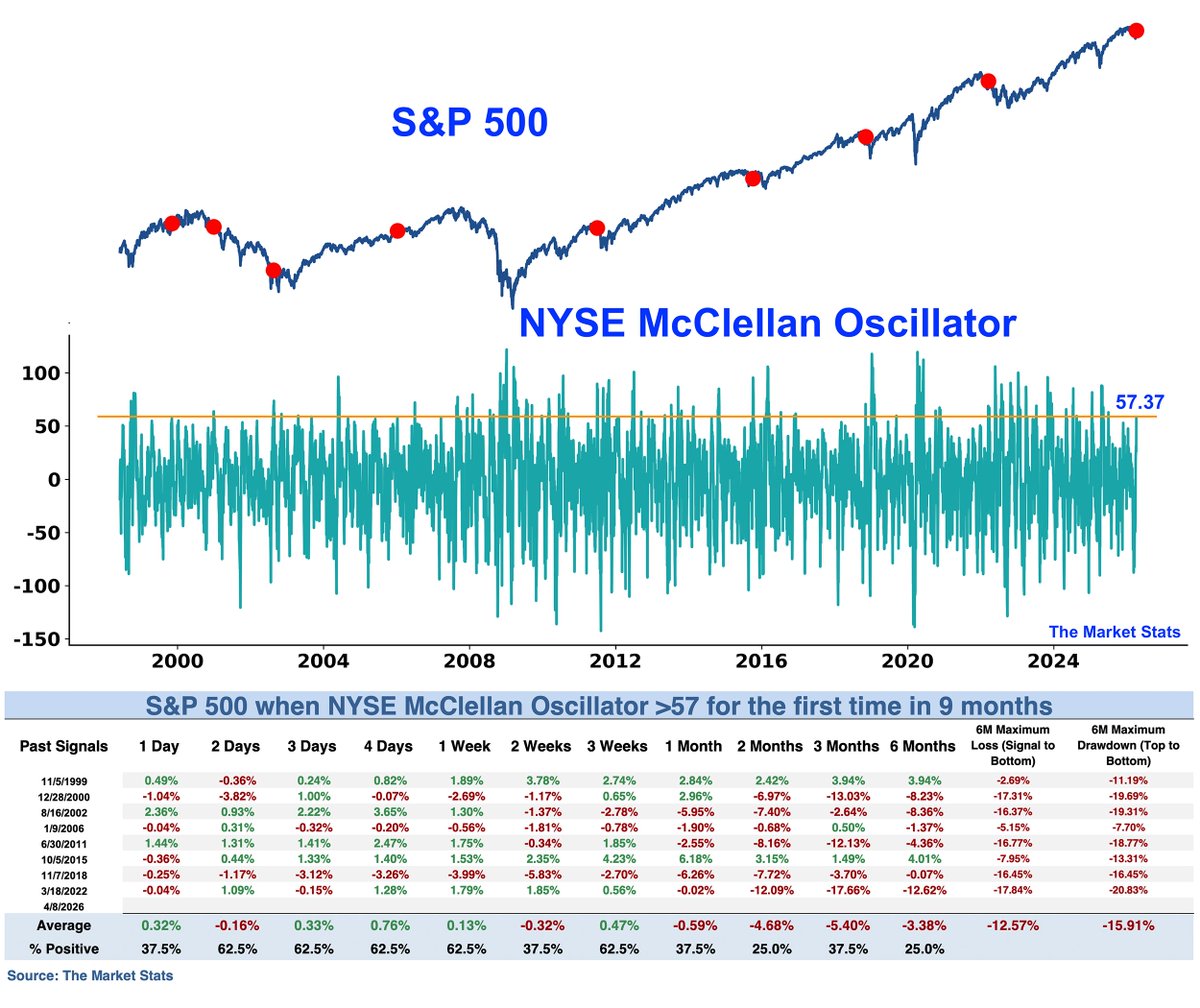
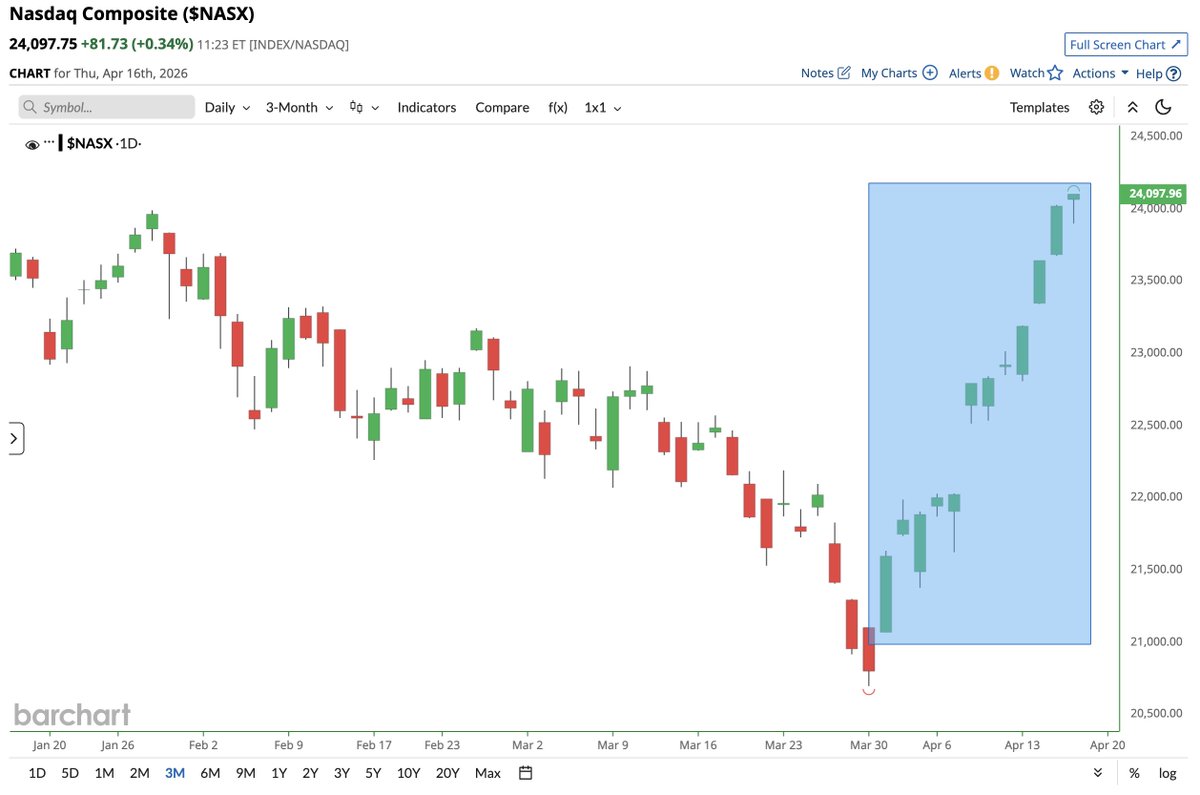
$SPX is up for a 7th consecutive day, up more than 7% over that period Historically, similar streaks saw $SPX higher every time, 2 weeks later Average 2 week gain was 2.5%
The Market Stats tweet media
English
7
41
280
82.1K
The Market Stats
The Market Stats@TheMarketStats·
Is Market Breadth getting overbought? NYSE McClellan Oscillator jumped above 57 for the first time in 9 months Similar readings saw $SPX lower 6 of 8 times, 2-6 months later. Average 6 month max drawdown was -15.9%
The Market Stats tweet media
English
7
19
157
12.5K
The Market Stats
The Market Stats@TheMarketStats·
$SPY gapped up 2.6% today while $XLE (energy sector) gapped down -5.7% This is a combination that has never occurred before Historically when $SPY gapped up at least 1% while $XLE gapped down at least 1%, $SPX was lower 3-4 days later
The Market Stats tweet media
English
19
64
479
55K
The Market Stats
The Market Stats@TheMarketStats·
Large Speculators are extremely net-long Bitcoin, the highest since 2023 Historically, this kind of extreme positioning has aligned with bottoms in $BTC
The Market Stats tweet media
English
26
86
462
68.8K
The Market Stats
The Market Stats@TheMarketStats·
$SPY put volume surged past 9 million This was the 3rd largest spike on record
The Market Stats tweet media
English
30
106
597
95.3K