Jurrien Timmer

15.3K posts

Jurrien Timmer banner
Jurrien Timmer

Jurrien Timmer

@TimmerFidelity

Dir. of Global Macro @Fidelity. Student of history, chart maker, cyclist, cook. Helping investors break thru the clutter. Views are mine. https://t.co/9Pn7wGwMzp

Boston Katılım Aralık 2014
1.4K Takip Edilen211.1K Takipçiler
Sabitlenmiş Tweet
Jurrien Timmer
Jurrien Timmer@TimmerFidelity·
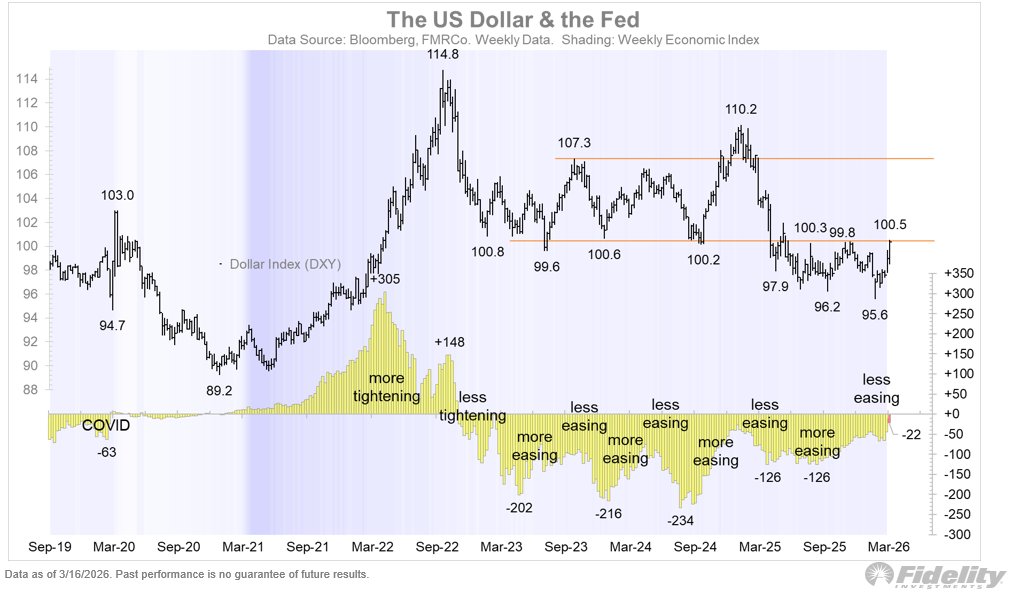
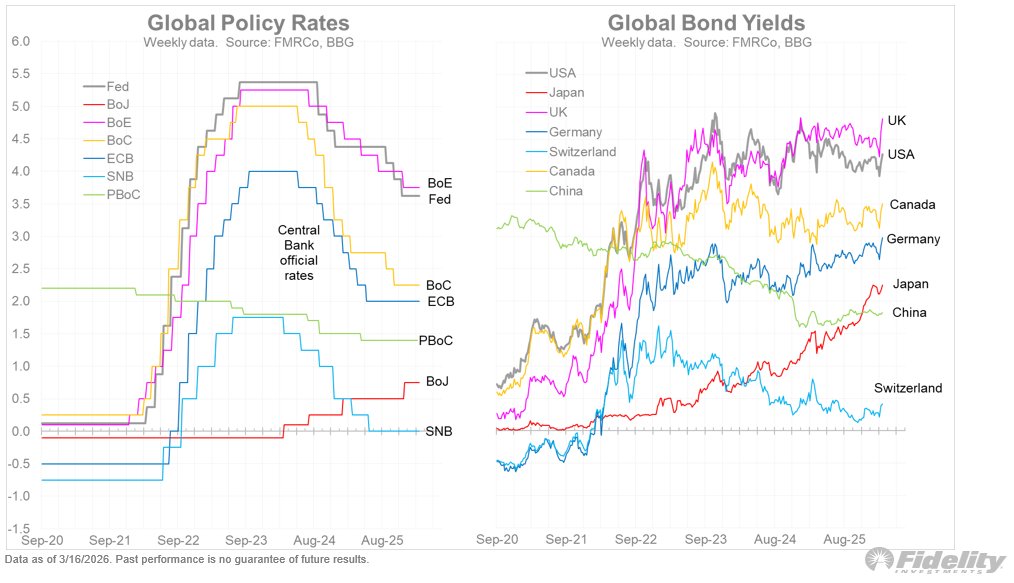
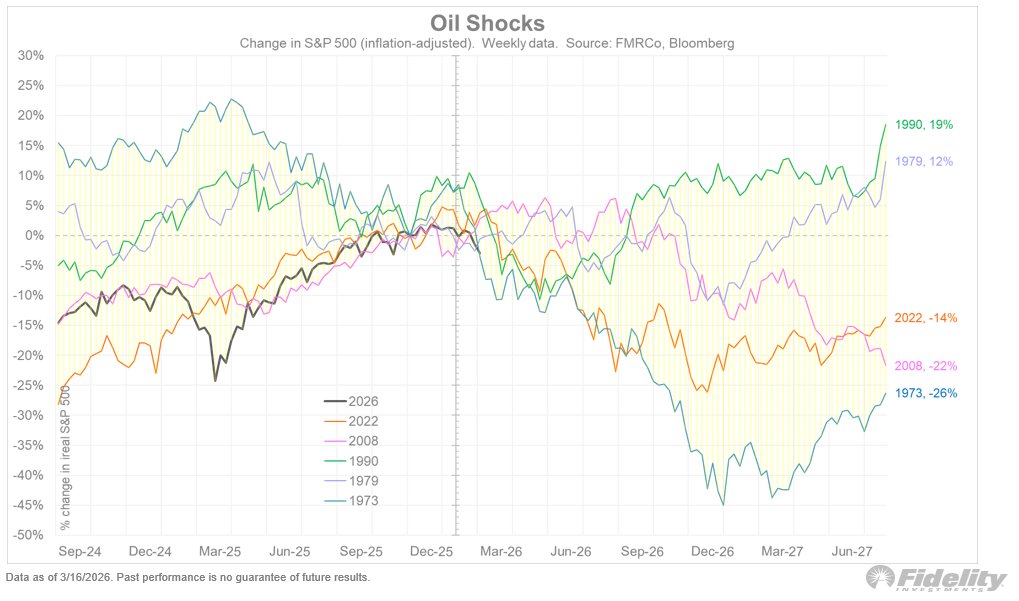
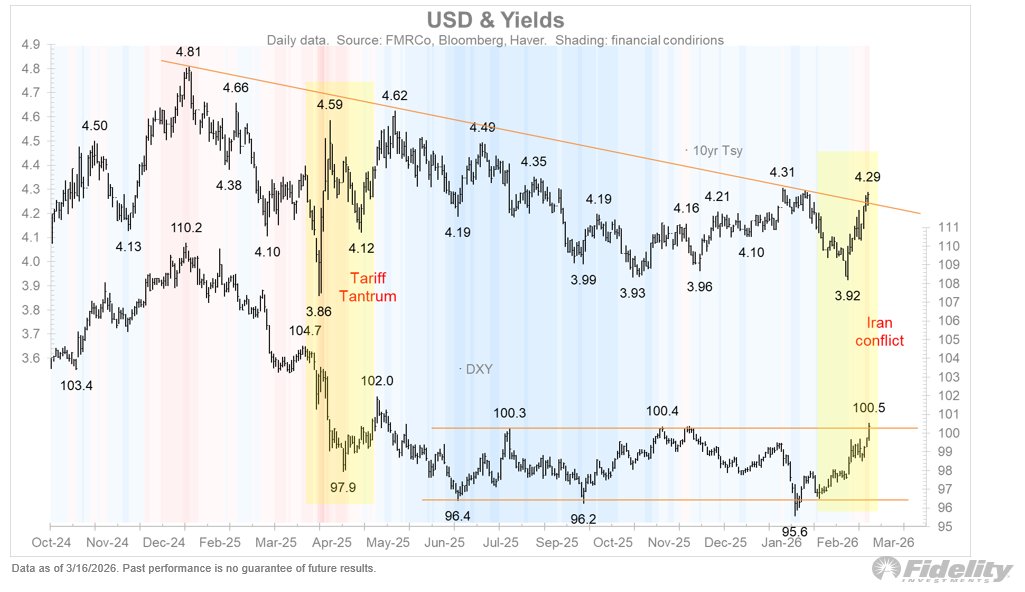
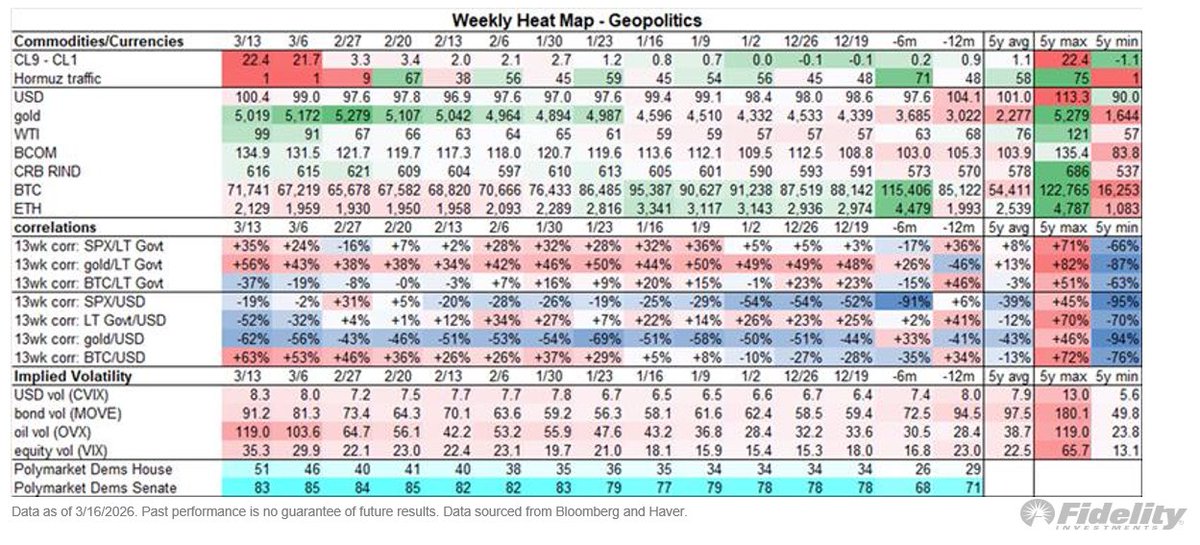
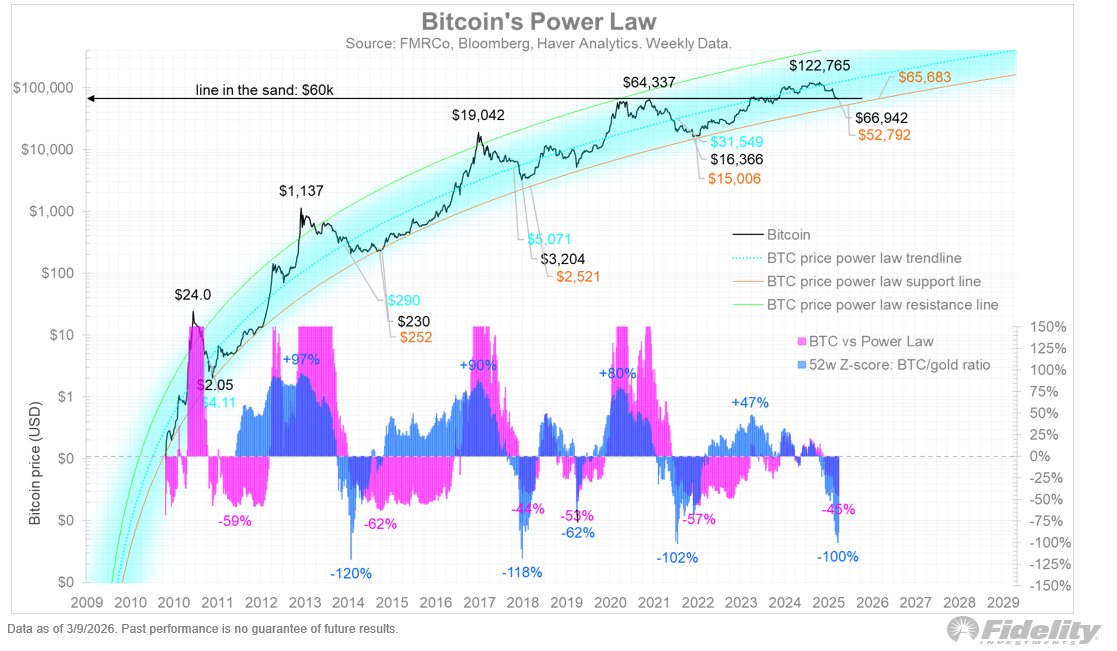
Week 3 is about to get underway for the conflict in Iran, and while we track the traffic through the Straits of Hormuz, we can see some interesting patterns emerging. Some are predictable, like spiking oil prices, rising vols, and downward pressure on risk assets, but others are less expected. Bond yields are up and so is Bitcoin. What does this tell us? We technicians know that when something is supposed to happen but isn’t (or vice versa), there might be a story there. If an oil shock leads to demand destruction, yields should fall instead of rise, while looking past the temporary hit to inflation. And Bitcoin should fall if given its “Dr. Jekyll & Mr. Hyde” personality it acts like a risk asset. But neither are happening. 
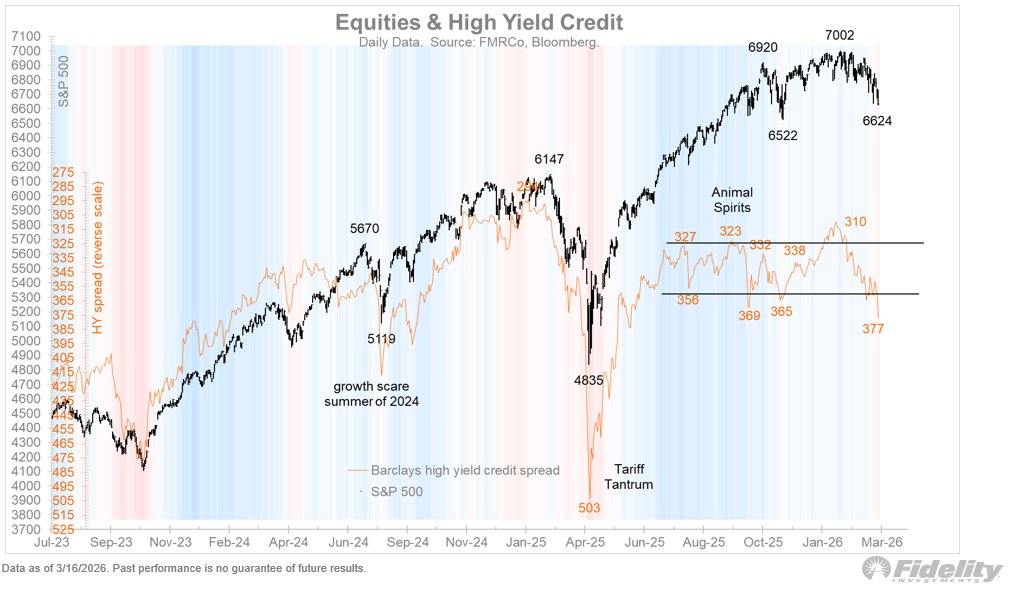
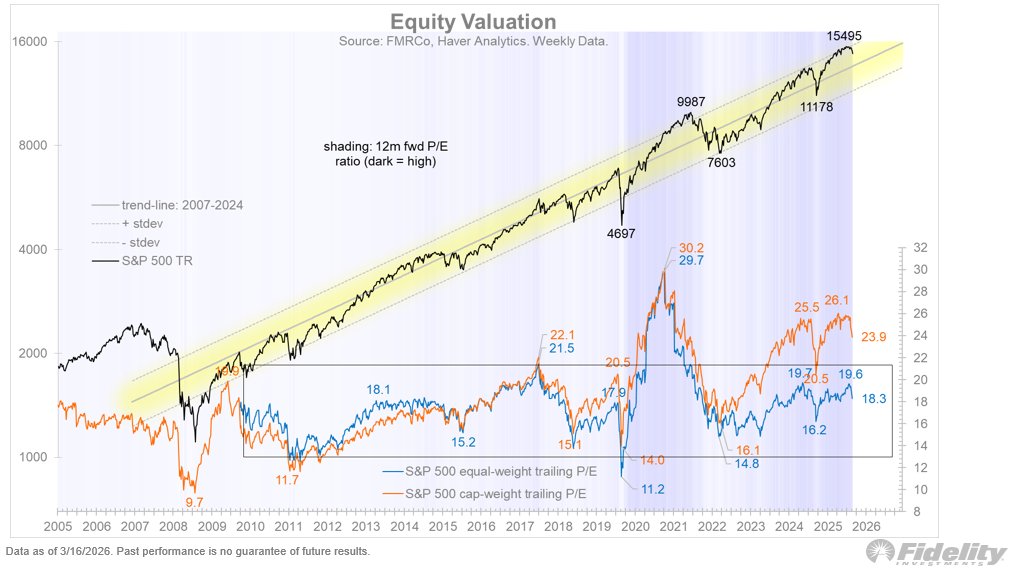
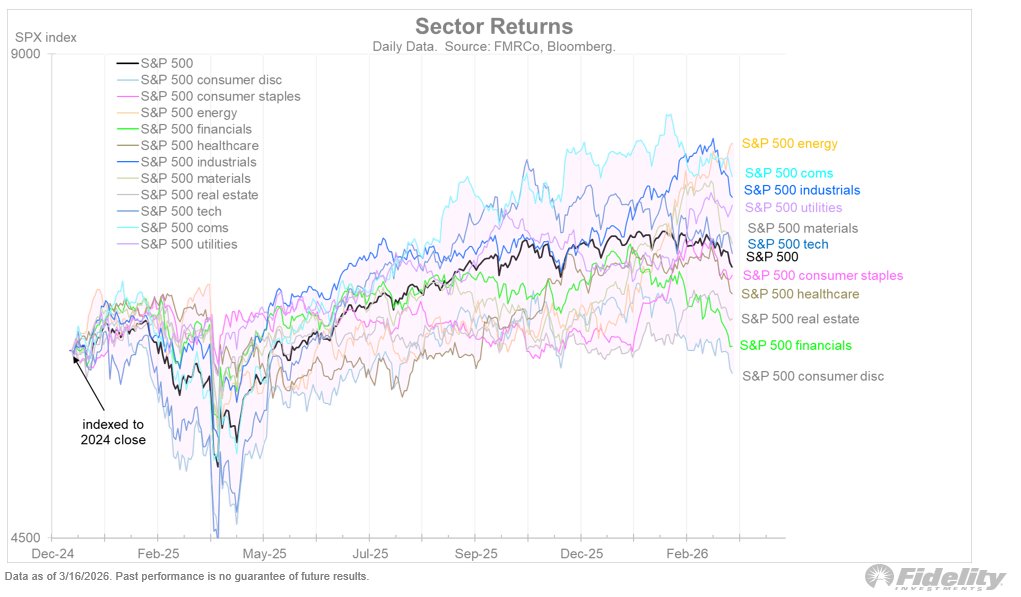
Meanwhile, credit remains under pressure as the crowded but illiquid software/SaaS space is on the hitlist for AI disruption. And while the equal-weighted S&P 500 is not extended on either a price or valuation basis, it may not matter much if the Mag 7 cannot hold support at current levels. 
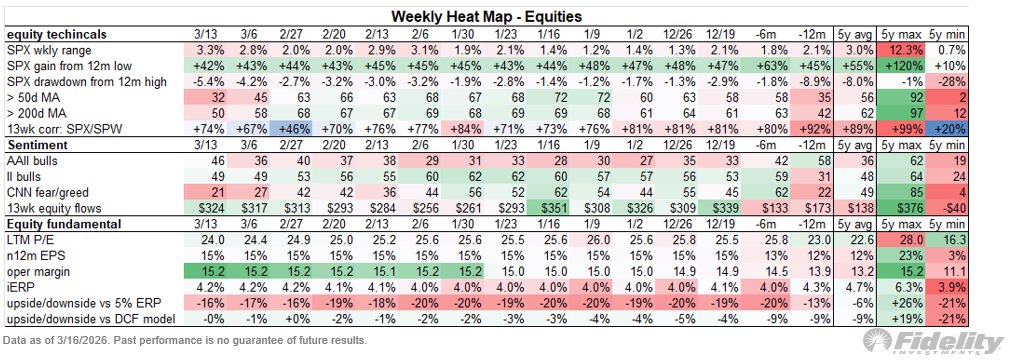
For now, the S&P 500 remains eerily well-behaved with a drawdown of only 5%, but that’s a bit of an illusion. Because earnings are so strong, the modest drawdown is masked by the fact that the P/E ratio is down 11% from the high. That’s probably a better drawdown metric than price. Let’s explore. linkedin.com/pulse/tangled-…
English
1
6
51
12.3K
Jurrien Timmer
Jurrien Timmer@TimmerFidelity·
The US dollar has also been on the move, and is testing the high end of its range since early 2025.
Jurrien Timmer tweet media
English
1
8
34
7K
Jurrien Timmer
Jurrien Timmer@TimmerFidelity·
At the back of the yield curve, yields are moving higher across the board, and the UK 10-year GILT yield is testing the cycle highs from 2022.  UK and US yields generally move in similar fashion, so this is something to watch as the US 10-year hit 4.28% on Friday.
Jurrien Timmer tweet media
English
1
4
33
6.8K
Jurrien Timmer
Jurrien Timmer@TimmerFidelity·
The chart below shows that high yield spreads appear to have broken out of its longstanding range.
Jurrien Timmer tweet media
English
4
14
89
11.2K
Jurrien Timmer
Jurrien Timmer@TimmerFidelity·
The heatmap below shows that expectations of further rate cuts have all but vanished.  Meanwhile, stress in the credit markets continues to mount with both investment grade and high yield spreads making new wides, and the private credit sensitive equities making new lows.
Jurrien Timmer tweet media
English
3
10
51
8.3K
Jurrien Timmer
Jurrien Timmer@TimmerFidelity·
For the cap-weighted index, price has remained quite elevated and well above the rising uptrend line.  While the trailing P/E ratio has contracted from 26.1x to 23.9x, it remains elevated. The equal-weighted index is far less extended against its rising trendline, and its P/E ratio (both trailing and forward) is well within its normal historical bounds.
Jurrien Timmer tweet mediaJurrien Timmer tweet media
English
1
4
43
7.2K
Jurrien Timmer
Jurrien Timmer@TimmerFidelity·
My focus continues to be on the Mag 7, which has remained in its narrow range since last October.  Should we break the lows, the broader indices will be at risk of a deeper correction.
Jurrien Timmer tweet media
English
8
17
114
15.1K
Jurrien Timmer
Jurrien Timmer@TimmerFidelity·
We know from history that correlations have converged to 1 during times of stress.  That is indeed happening within the equity markets.
Jurrien Timmer tweet media
English
4
14
79
7.8K
Jurrien Timmer
Jurrien Timmer@TimmerFidelity·
The heatmap below shows that the drawdown for the S&P 500 remains modest at -5.4%.  The market is only modestly oversold with 32% of stocks above their 50-day moving average.  Sentiment is mixed and both earnings expectations and margins remain firm.  The markets appear to be betting on a short war, and are vulnerable if that scenario doesn’t pan out.
Jurrien Timmer tweet media
English
11
10
68
8.6K
Jurrien Timmer
Jurrien Timmer@TimmerFidelity·
For bonds the pattern is mixed. During the inflationary 1970’s, yields were in an uptrend anyway (as was the case in 2022), but in 1990 and 2008 it was the opposite.  My conclusion is that the oil shocks by themselves did not really affect yields, which makes the current rise in yields that much more interesting. /3
Jurrien Timmer tweet media
English
2
4
22
6.5K
Jurrien Timmer
Jurrien Timmer@TimmerFidelity·
The next chart shows the major oil shocks, including 1973, 1979, 1990, 2008, and 2022.  Some were brief, others were not. 🧵
Jurrien Timmer tweet media
English
3
21
112
15.5K
Jurrien Timmer
Jurrien Timmer@TimmerFidelity·
For me the most interesting development of the past few weeks is the upward pressure on bond yields and the resilience of Bitcoin.  Both the 10-year yield and the dollar index are at major resistance levels. This next chart illustrates the resilience of Bitcoin as well.  It has gained ground while gold has lost some oomph.  Bitcoin has acted more like a risk asset lately, so this is noteworthy.
Jurrien Timmer tweet mediaJurrien Timmer tweet media
English
9
12
96
9.2K
Jurrien Timmer
Jurrien Timmer@TimmerFidelity·
In the US equity market, the energy sector is the only one gaining ground while everything else corrects. Consumer discretionary stocks are at the bottom, and while it’s tempting to conclude that this is because the dystopian “Citrini” scenario is underway (in which AI “eats” the labor market), our experts point to more traditional catalysts, such as dashed hopes for rate cuts, the K-shaped recovery, and pressure at AMZN and TSLA.
Jurrien Timmer tweet media
English
7
8
76
9.6K
Jurrien Timmer
Jurrien Timmer@TimmerFidelity·
The “jaws” chart below illustrates the one-two punch of an oil shock and a credit problem. When the jaws close, we can hopefully declare victory for this risk-off episode, but so far that hasn’t happened.
Jurrien Timmer tweet media
English
6
17
122
12.9K
Jurrien Timmer
Jurrien Timmer@TimmerFidelity·
The heatmap below shows that the oil futures curve remains heavily backwardated, indicating that the energy market believes that the current oil shock is a temporary supply problem that will get fixed. That’s probably correct but the question is how much damage is done before that happens. The table also shows (at bottom) that the odds of a midterm “election rejection” continue to rise. The middle of the table shows 13-week rolling correlations, and the interesting part here is that the gold-USD correlation is strongly negative (as is typical) while the BTC-USD correlation is strongly positive. This could be important, as I will explore in a bit.
Jurrien Timmer tweet media
English
6
11
101
9.9K
Jurrien Timmer
Jurrien Timmer@TimmerFidelity·
Bitcoin has continued to search for a bottom, and I still think that the $60k is a good place to look. We may well undercut it at some point, but based on the power law support line and the gold/Bitcoin ratio, I believe that level should act as a floor.
Jurrien Timmer tweet media
English
35
78
466
32.1K
Jurrien Timmer
Jurrien Timmer@TimmerFidelity·
It has been my thesis for the past 5 years that the “new” 60/40 is more like a 60/20/20. To illustrate this the chart below shows that a hypothetical 60/20/20 portfolio, allocated as noted in the chart, could have sharply outperformed the standard 60/40 index recently, mostly due to gold and non-US equities. The table is definitely not investment advice but just my personal take on what a truly diversified portfolio might look like.
Jurrien Timmer tweet media
English
22
14
162
25.2K