To Nguyen

148 posts

To Nguyen

To Nguyen

@ToNguyen90

It 's myself

Ho Chi Minh, Vietnam Katılım Aralık 2016
121 Takip Edilen125 Takipçiler
To Nguyen retweetledi
Centre to Impact AMR
Centre to Impact AMR@CentreImpactAMR·
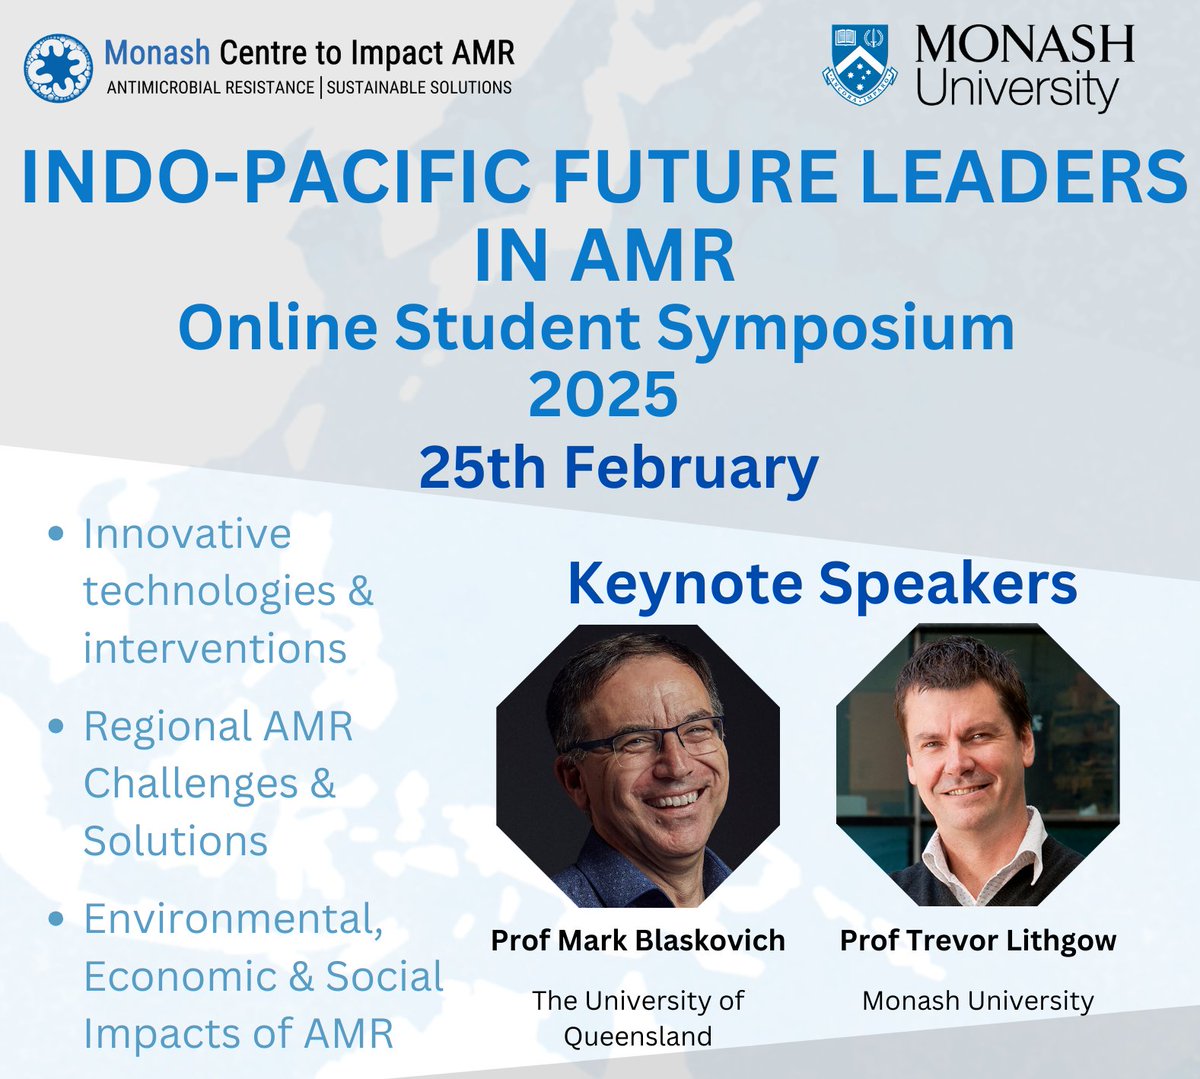
🌟Our Future Leaders in #AMR Online Student Symposium webpage is NOW LIVE! It provides a summary of the event and video recordings of each session. Thank you to everyone who made this day possible. monash.edu/impact-amr/cas…
Centre to Impact AMR tweet media
English
0
4
5
344
To Nguyen retweetledi
Pedro H Oliveira
Pedro H Oliveira@pholive81·
🚨 PhD and postdoctoral positions available. We seek candidates for the MGE Team to work on # epigenomics of # bacteria and # microbiomes. Start: Fall 2025. Please RT!
Pedro H Oliveira tweet media
English
1
82
183
19.3K
To Nguyen retweetledi
Centre to Impact AMR
Centre to Impact AMR@CentreImpactAMR·
Registrations are open to attend our #AMR online student symposium on February 25, 2025. There's still time to submit abstracts! Submissions close this Friday, January 10⌛️ Register here: eventbrite.com/e/indo-pacific… Submit abstracts here: forms.gle/r8gjCDtTsv3nMj…
Centre to Impact AMR tweet media
Centre to Impact AMR@CentreImpactAMR

📢We're excited to announce that the deadline for abstract submissions for the Indo-Pacific Future Leaders in #AMR Online Student Symposium has been extended to January 10, 2025. docs.google.com/forms/d/e/1FAI… 🚨Registrations are also open: eventbrite.com/e/indo-pacific…

English
0
4
3
621
To Nguyen retweetledi
Joachim Schork
Joachim Schork@JoachimSchork·
If you're still using raw R outputs for presentations, it's time for an upgrade! Tools like gtsummary bring your statistical results to life, making them much more digestible for non-technical audiences. While base R functions like summary(fit) work well for statisticians, they can be too complex for stakeholders who aren’t familiar with the detailed output. The tbl_regression() function from gtsummary makes it easy to present regression results clearly. In addition, gtsummary is highly versatile - it’s not just limited to linear regression. You can apply it to generalized linear models, survival analyses, and more. The package even allows you to include p-values, confidence intervals, and other important statistics directly within the tables, helping you to better communicate statistical results. Here are a few standout benefits: ✅ Simplified output that’s easier for stakeholders to understand ✅ Works seamlessly with a variety of models ✅ Customizable tables with key statistics like p-values, confidence intervals, and more The visualization included here was originally shared in a recent post by Dr. Alexander Krannich. #rstats #gtsummary #statistics #datascience
Joachim Schork tweet media
English
11
223
1.7K
120.1K
To Nguyen retweetledi
Josh Ramsay
Josh Ramsay@DrJoshRamsay·
If you are a Western Australian microbiology student interested intending the mgeaus.org meeting in Melbourne in February, apply below to Win $1,000 towards your travel and accommodation and free registration. asmwabranch.com/mge-travel-awa…
English
0
3
4
575
To Nguyen retweetledi
ASM
ASM@AUSSOCMIC·
Registration and abstract submission is now open for MGE AUS! Visit mgeaus.org to register
ASM tweet media
English
0
8
13
2.1K
To Nguyen retweetledi
AMR Action Fund
AMR Action Fund@AMRActionFund·
A team at @MonashUni is using computer modeling to describe and predict when #AMR will emerge during infection treatment, which could help optimize dosing regimens and improve patient care. @medicine-health/2024/08/08/1386905/data-modelling-breakthrough-in-the-fight-against-antimicrobial-resistance" target="_blank" rel="nofollow noopener">lens.monash.edu/@medicine-heal…
English
0
5
15
1.1K