
Trade For Opportunity
15.9K posts

Trade For Opportunity
@TradeForOpp
TradingView indicators & more👇
Katılım Mart 2021
321 Takip Edilen40K Takipçiler

@TradeForOpp Did someone say probabilities
🤣🤣🤣🤣🤣 dude hope you been doing good it’s been a minute
English
Yes - probabilities are being added in several places
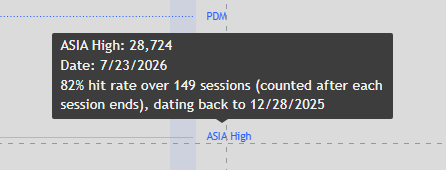
Here for example, pivot labels will get a tooltip showing how often they get hit
Vinay@VinayVeerappa
@TradeForOpp Adding probabilities to the levels could be interesting especially if it can be dynamic once the level gets hit
English
Fixing this - has been a common ask for a long time
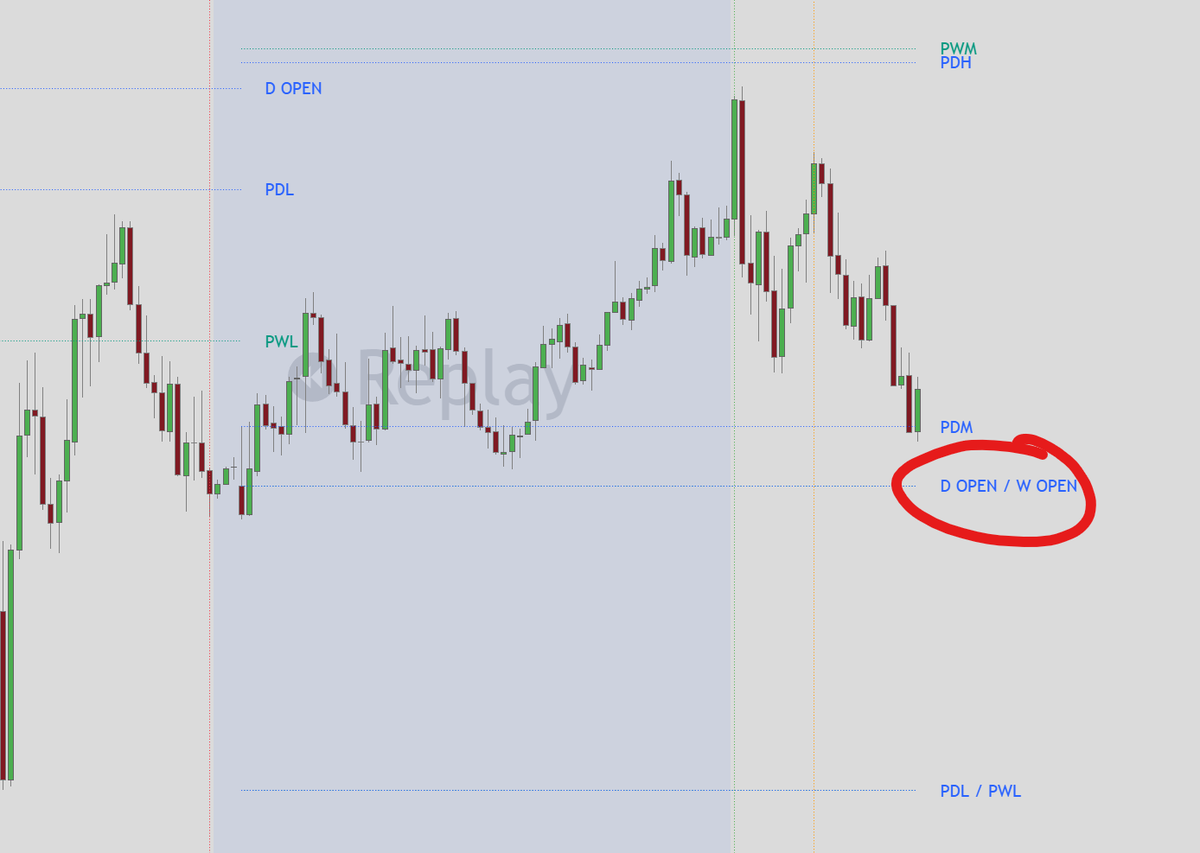
Overlapping seems most relevant to D/W/M levels (ex. NQ Sunday night weekly open = Monday daily open)
Other labels not as relevant imo (pivots, open prices), but if needed I'm sure we can make another update
Jou@joueremita
@TradeForOpp For me it's perfect as it is, I just wish labels wouldn't overlap each other when they're in the same level
English
#10 all time on TradingView
Thank you to the 50k+ who have supported this
Working on an update - I have some ideas already, but feel free to share your thoughts

English

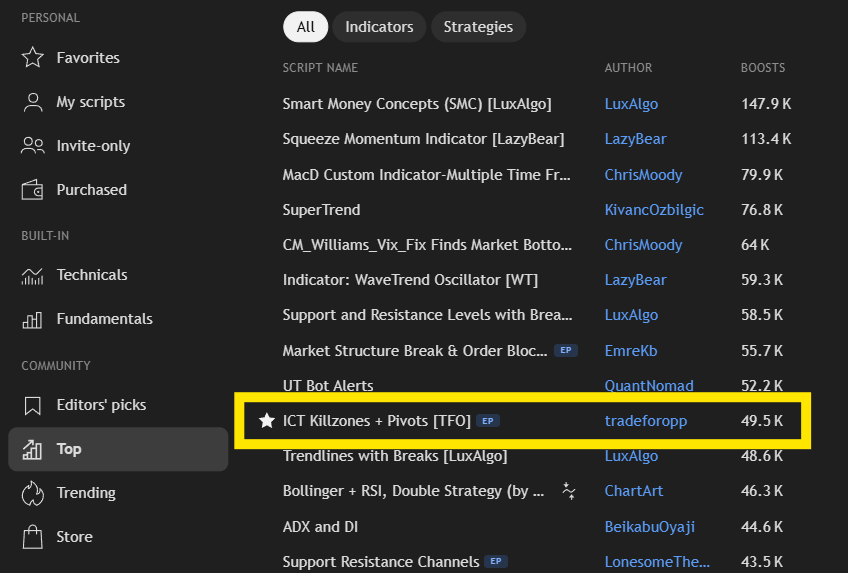
Killzones & Pivots is now the #10 most boosted indicator on TV
In anticipation of hitting 50k, what updates you would like to see most?
Thinking of adding some basic stats showing how often levels get hit (will attach an example below)
English
@imJessTwoOne hey Jess! assuming those alerts would be like "price hit the 8:00 open"? can you elaborate on the time stamp sections, not sure I follow there
English

@TradeForOpp I would love an option for alerts for opening prices or time stamps sections
English
Stats example that I built into a separate indicator: x.com/TradeForOpp/st…
Trade For Opportunity@TradeForOpp
idea to show which of the last 5 days raided a session high, low, or both 🟩 = yes, 🟥 = no ex. Asia high gets traded through 92% of the time on this NQ chart. yesterday this didn't happen (🟥), so perhaps there was a higher % chance of doing so today (🟩) 100% inspired by @Austin_Clark_YT talking about how, if there's ~70% probability of retracing to midnight open during a given time window, and it doesn't happen one day, it's even more likely to happen the next day. the numbers need to balance themselves out eventually something I'm def interested to expand on
English
Any questions about reports/timeframes etc. feel free to lmk - DMs are open, replies are on "verified only" bc of bots
Try Edgeful for free: edgeful.com/?via=tfo
English
NQ, ES, & YM: breakout days & targets
This report takes the initial balance, draws extensions from its range, and shows how often price hits those extension levels
Ex. the "+1.0" extension for a given day would be evaluated as:
ib_high + [(ib_high - ib_low) * 1.0]
Negative numbered extensions are similar but drawn from the range low, ex. "-0.5" would be:
ib_low - [(ib_high - ib_low) * 0.5]
With today being considered a breakout day on NQ, ES, and YM (confirmed with price only trading above the IB high, never below the IB low), here are the probabilities of a few extensions from these IB ranges
NQ (3 year lookback):
+0.2: 87.54%🔵🔵🔵🔵🔵
+0.4: 70.29%🔵🔵🔵🔵
+0.6: 52.08%🔵🔵🔵
+0.8: 36.1%🔵🔵
+1.0: 25.24%🔵
ES (3 year lookback):
+0.2: 92.2%🔵🔵🔵🔵🔵
+0.4: 77.66%🔵🔵🔵🔵
+0.6: 60.64%🔵🔵🔵
+0.8: 52.42%🔵🔵
+1.0: 39.36%🔵
YM (3 year lookback):
+0.2: 86.25%🔵🔵🔵🔵🔵
+0.4: 69.07%🔵🔵🔵🔵
+0.6: 51.2%🔵🔵🔵
+0.8: 40.21%🔵🔵
+1.0: 29.21%🔵
Another couple notes regarding these breakout days:
1. They are validated with a wick criteria; all price has to do is wick through the IB high to be considered a breakout day, OR wick through the IB low for a breakdown day
2. If price ever wicks through both the IB high *and* the IB low - at any point throughout RTH session (the time window I'm using for this report) - that reclassifies the breakout/breakdown day as a double break day. Double break days have completely different data attached to these levels
The attached chart is an example of how these extension targets get hit across *all* days on NQ - breakout, breakdown, and double break

English
This post expands on one I shared a few days ago on midnight open retracements: x.com/TradeForOpp/st…
Any questions about reports/timeframes etc. feel free to lmk - DMs are open, replies are on "verified only" bc of bots
Try Edgeful for free: edgeful.com/?via=tfo
Trade For Opportunity@TradeForOpp
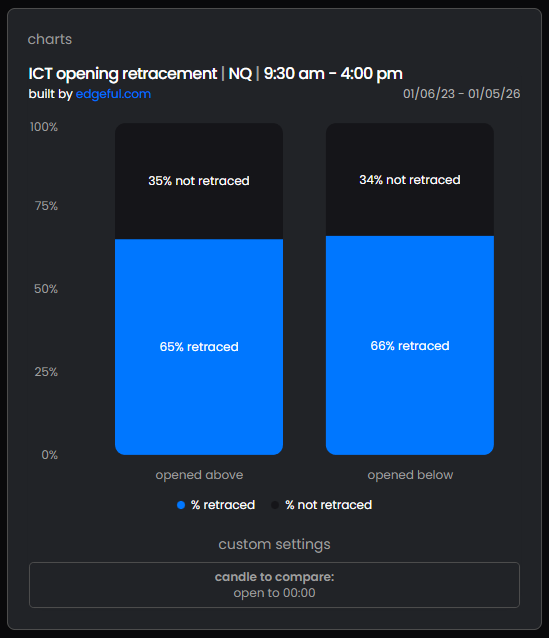
NQ: midnight opening retracements The ICT opening retracement report defaults to using the midnight open as the retracement target (but can be changed to any other time) Overall, in the last 3 years, if RTH opened above the midnight open, the retracement success rate during the RTH session was 65%, and 66% if RTH opened below the midnight open By weekday, the numbers don't vary too much, but I'll attach for completeness: [RTH opened above midnight open] Mon: 53% (46/87 days)🔵 Tue: 68% (51/75 days)🔵🔵🔵 Wed: 69% (57/83 days)🔵🔵🔵🔵🔵 Thu: 69% (60/87 days)🔵🔵🔵🔵🔵 Fri: 67% (53/79 days)🔵🔵 [RTH opened below midnight open] Mon: 71% (48/68 days)🔵🔵🔵🔵🔵 Tue: 65% (53/81 days)🔵🔵 Wed: 68% (48/71 days)🔵🔵🔵 Thu: 59% (39/66 days)🔵 Fri: 69% (51/74 days)🔵🔵🔵🔵 Now, broken down by distance/size for all days of the week (how far RTH opened from the midnight open), the results are as follows: [RTH opened above midnight open] < 0.1%: 86% (64/74 days) 0.1-0.19%: 83% (55/66 days) 0.2-0.39%: 66% (76/116 days) 0.4-0.59%: 59% (41/70 days) 0.6-0.99%: 42% (28/66 days) 1-1.49%: 14% (2/14 days) >= 1.5%: 20% (1/5 days) [RTH opened below midnight open] < 0.1%: 91% (64/70 days) 0.1-0.19%: 75% (47/63 days) 0.2-0.39%: 67% (66/98 days) 0.4-0.59%: 51% (26/51 days) 0.6-0.99%: 50% (25/50 days) 1-1.49%: 44% (8/10 days) >= 1.5%: 30% (3/10 days) As with most other reports, breaking down the success criteria by something like distance/size makes it a bit more intuitive in my opinion Practically speaking, if the RTH session opens far away from some target distance (midnight open), the chances of hitting that level are probably low, compared to days where that target is much closer by RTH open Likewise, if the target is further back in time compared to another - say you were comparing the midnight retracements vs 8:00 am EST retracements during RTH - chances are, since more time has elapsed from 12:00-9:30 compared to 8:00-9:30, allowing price more time to move until the RTH open, *on average* RTH would likely start further away from the 12:00 level and closer to the 8:00 level, and as a result offer lower retracement rates for the 12:00 open vs the 8:00 open These are just generalized examples, but imo breaking down reports in this way helps demystify the concept; it's a lot more comprehensive as opposed to just saying there's a 70% chance of X happening... okay, but how/when/why?
English
NQ: retracement probabilities of varying opening prices
I want to look at the probability of NQ hitting the following open prices (EST) during the RTH session:
> 4:00
> 6:00
> 8:00
Before looking at each retracement by size (distance from the open price to RTH open), these are the results for the entire 3 year lookback:
[4:00 - RTH opened above this price]
68% retracement probability
[4:00 - RTH opened below this price]
75% retracement probability
---
[6:00 - RTH opened above this price]
72% retracement probability
[6:00 - RTH opened below this price]
76% retracement probability
---
[8:00 - RTH opened above this price]
77% retracement probability
[8:00 - RTH opened below this price]
82% retracement probability
---
Now, broken down by size (distance from the open price to the RTH open):
[4:00 - RTH opened above this price]
< 0.1%: 86% (75/87 days)🔵🔵🔵🔵🔵
0.1-0.19%: 87% (53/61 days)🔵🔵🔵🔵🔵🔵
0.2-0.39%: 67% (82/123 days)🔵🔵🔵🔵
0.4-0.59%: 52% (33/63 days)🔵🔵🔵
0.6-0.99%: 42% (18/43 days)🔵🔵
1-1.49%: 33% (3/9 days)🔵
[4:00 - RTH opened below this price]
< 0.1%: 91% (92/101 days)🔵🔵🔵🔵🔵🔵
0.1-0.19%: 79% (64/81 days)🔵🔵🔵🔵🔵
0.2-0.39%: 75% (72/96 days)🔵🔵🔵🔵
0.4-0.59%: 57% (25/44 days)🔵🔵
0.6-0.99%: 59% (24/41 days)🔵🔵🔵
1-1.49%: 57% (8/14 days)🔵🔵
---
[6:00 - RTH opened above this price]
< 0.1%: 93% (101/109 days)🔵🔵🔵🔵🔵🔵
0.1-0.19%: 73% (69/94 days)🔵🔵🔵🔵🔵
0.2-0.39%: 70% (85/122 days)🔵🔵🔵🔵
0.4-0.59%: 57% (26/46 days)🔵🔵🔵
0.6-0.99%: 34% (10/29 days)🔵🔵
1-1.49%: 0% (0/5 days)🔵
[6:00 - RTH opened below this price]
< 0.1%: 93% (94/101 days)🔵🔵🔵🔵🔵
0.1-0.19%: 81% (64/79 days)🔵🔵🔵🔵
0.2-0.39%: 67% (71/106 days)🔵🔵🔵
0.4-0.59%: 61% (22/36 days)🔵🔵
0.6-0.99%: 67% (20/30 days)🔵🔵🔵
1-1.49%: 60% (6/10 days)🔵
---
[8:00 - RTH opened above this price]
< 0.1%: 95% (130/137 days)🔵🔵🔵🔵🔵🔵
0.1-0.19%: 74% (68/92 days)🔵🔵🔵🔵🔵
0.2-0.39%: 73% (67/92 days)🔵🔵🔵🔵
0.4-0.59%: 59% (22/37 days)🔵🔵🔵
0.6-0.99%: 32% (6/19 days)🔵🔵
1-1.49%: 14% (0/6 days)🔵
[8:00 - RTH opened below this price]
< 0.1%: 91% (145/159 days)🔵🔵🔵🔵🔵🔵
0.1-0.19%: 81% (74/91 days)🔵🔵🔵🔵🔵
0.2-0.39%: 76% (63/83 days)🔵🔵🔵🔵
0.4-0.59%: 69% (20/29 days)🔵🔵
0.6-0.99%: 60% (12/20 days)🔵
1-1.49%: 71% (5/7 days)🔵🔵🔵

English
Any questions about reports/timeframes etc. feel free to lmk - DMs are open, replies are on "verified only" bc of bots
Try Edgeful for free: edgeful.com/?via=tfo
English
NQ: midnight opening retracements
The ICT opening retracement report defaults to using the midnight open as the retracement target (but can be changed to any other time)
Overall, in the last 3 years, if RTH opened above the midnight open, the retracement success rate during the RTH session was 65%, and 66% if RTH opened below the midnight open
By weekday, the numbers don't vary too much, but I'll attach for completeness:
[RTH opened above midnight open]
Mon: 53% (46/87 days)🔵
Tue: 68% (51/75 days)🔵🔵🔵
Wed: 69% (57/83 days)🔵🔵🔵🔵🔵
Thu: 69% (60/87 days)🔵🔵🔵🔵🔵
Fri: 67% (53/79 days)🔵🔵
[RTH opened below midnight open]
Mon: 71% (48/68 days)🔵🔵🔵🔵🔵
Tue: 65% (53/81 days)🔵🔵
Wed: 68% (48/71 days)🔵🔵🔵
Thu: 59% (39/66 days)🔵
Fri: 69% (51/74 days)🔵🔵🔵🔵
Now, broken down by distance/size for all days of the week (how far RTH opened from the midnight open), the results are as follows:
[RTH opened above midnight open]
< 0.1%: 86% (64/74 days)
0.1-0.19%: 83% (55/66 days)
0.2-0.39%: 66% (76/116 days)
0.4-0.59%: 59% (41/70 days)
0.6-0.99%: 42% (28/66 days)
1-1.49%: 14% (2/14 days)
>= 1.5%: 20% (1/5 days)
[RTH opened below midnight open]
< 0.1%: 91% (64/70 days)
0.1-0.19%: 75% (47/63 days)
0.2-0.39%: 67% (66/98 days)
0.4-0.59%: 51% (26/51 days)
0.6-0.99%: 50% (25/50 days)
1-1.49%: 44% (8/10 days)
>= 1.5%: 30% (3/10 days)
As with most other reports, breaking down the success criteria by something like distance/size makes it a bit more intuitive in my opinion
Practically speaking, if the RTH session opens far away from some target distance (midnight open), the chances of hitting that level are probably low, compared to days where that target is much closer by RTH open
Likewise, if the target is further back in time compared to another - say you were comparing the midnight retracements vs 8:00 am EST retracements during RTH - chances are, since more time has elapsed from 12:00-9:30 compared to 8:00-9:30, allowing price more time to move until the RTH open, *on average* RTH would likely start further away from the 12:00 level and closer to the 8:00 level, and as a result offer lower retracement rates for the 12:00 open vs the 8:00 open
These are just generalized examples, but imo breaking down reports in this way helps demystify the concept; it's a lot more comprehensive as opposed to just saying there's a 70% chance of X happening... okay, but how/when/why?
English
Any questions about reports/timeframes etc. feel free to lmk - DMs are open, replies are on "verified only" bc of bots
Try Edgeful for free: edgeful.com/?via=tfo
English
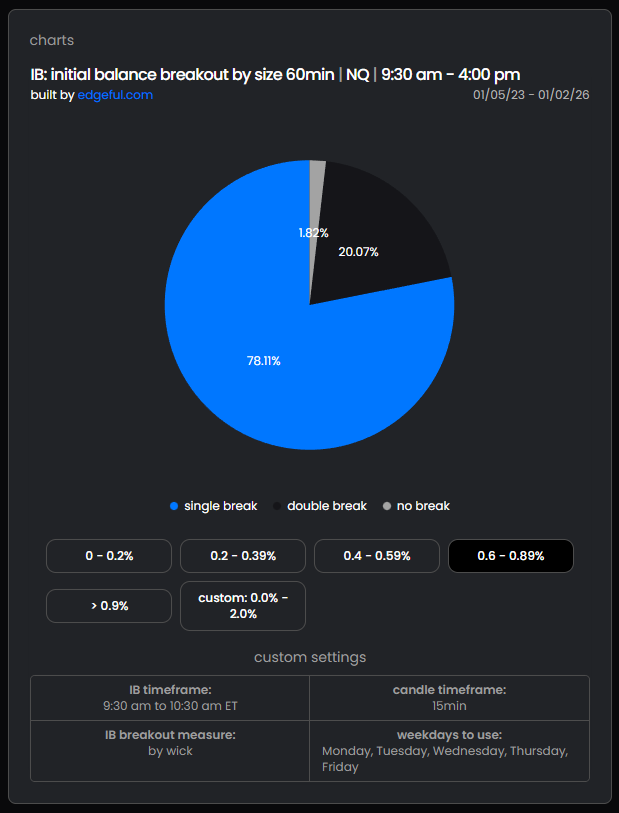
NQ: probability of a double break
I'm customizing the initial balance breakout report to see how often NQ breaks one, both, or neither side of the first 30m, 1h, 1.5h etc. of RTH
"Break" criteria is defined with a wick (not a close), and I'm using a lookback period of 3 years (772 trading days)
First 30m (9:30-10:00):
- single break: 61.92%🔵
- double break: 37.69%⚫⚫⚫⚫⚫⚫
- no break: 0.39%⚪
First 1h (9:30-10:30):
- single break: 75.78%🔵🔵🔵🔵
- double break: 21.24%⚫⚫⚫⚫⚫
- no break: 2.98%⚪⚪
First 1.5h (9:30-11:00):
- single break: 77.33%🔵🔵🔵🔵🔵🔵
- double break: 14.64%⚫⚫⚫⚫
- no break: 8.03%⚪⚪⚪
First 2h (9:30-11:30):
- single break: 77.2%🔵🔵🔵🔵🔵
- double break: 9.84%⚫⚫⚫
- no break: 12.95%⚪⚪⚪⚪
First 2.5h (9:30-12:00):
- single break: 74.35%🔵🔵🔵
- double break: 6.61%⚫⚫
- no break: 19.04%⚪⚪⚪⚪⚪
First 3h (9:30-12:30):
- single break: 70.73%🔵🔵
- double break: 5.05%⚫
- no break: 24.22%⚪⚪⚪⚪⚪
Though as you could imagine, the size of these ranges can surely be a key factor in how often they breaks
Using the first 1h range as an example, these are the probabilities when filtered by range size:
0-0.2% (14 days fit this criteria):
- single break: 92.86% 🔵🔵🔵🔵🔵
- double break: 0% ⚫
- no break: 7.14%
0.2-0.39% (78 days fit this criteria):
- single break 65.39%🔵
- double break: 33.33% ⚫⚫⚫⚫⚫
- no break: 1.28% ⚪⚪
0.4-0.59% (186 days fit this criteria):
- single break: 69.89% 🔵🔵
- double break: 30.11% ⚫⚫⚫⚫
- no break: 0% ⚪
0.6-0.89% (274 days fit this criteria):
- single break 78.11%🔵🔵🔵
- double break 20.07% ⚫⚫⚫
- no break: 1.82% ⚪⚪⚪
>0.9% (220 days fit this criteria):
- single break: 80.46% 🔵🔵🔵🔵
- double break: 12.27% ⚫⚫
- no break: 7.27% ⚪⚪⚪⚪
English
Any questions about reports/timeframes etc. feel free to lmk - DMs are open, replies are on "verified only" bc of bots
Try Edgeful for free: edgeful.com/?via=tfo
English
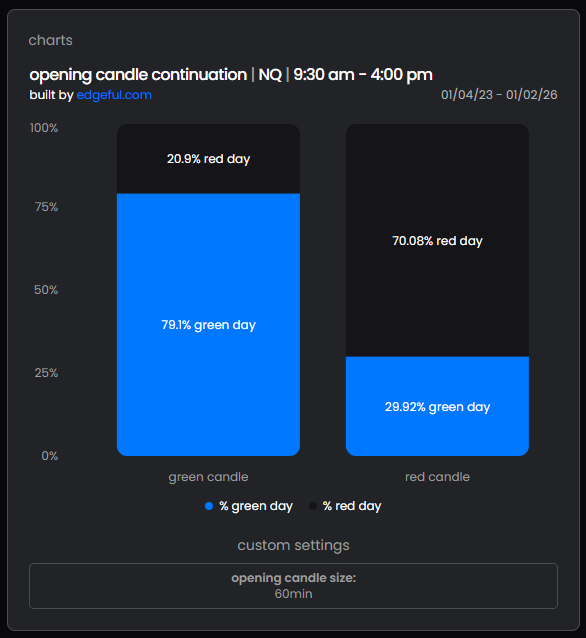
NQ: letting the first hour set the tone
The opening candle continuation report correlates the close of the first hour with the close of the daily candle (both RTH)
I prefer to break this down by size (how far 10:30 price is from 9:30 price) because, as you could imagine, the day is probably more likely to end in the same direction when the 1st hour closes further from the open
The following data shows the probability that the day closes in the same direction as the 1st hour, filtered by the size of the opening candle (measured from open to close), using a 3 year lookback
Green 🟢1st hour:
0-0.2%: 68% 🟢 day odds (98/144 times)
0.2-0.39%: 84% 🟢 day odds (73/87 times)
0.4-0.59%: 84% 🟢 day odds (73/87 times)
0.6-0.89%: 83% 🟢 day odds (49/59 times)
>0.9: 100% 🟢 day odds (25/25 times)
Red 🔴1st hour:
0-0.2%: 53% 🔴 day odds (68/127 times)
0.2-0.39%: 65% 🔴 day odds (61/94 times)
0.4-0.59%: 83% 🔴 day odds (52/63 times)
0.6-0.89%: 91% 🔴 day odds (53/58 times)
>0.9: 90% 🔴 day odds (26/29 times)
As another example, take ES, again with a 3 year lookback:
Green 🟢1st hour:
0-0.2%: 71% 🟢 day odds (154/218 times)
0.2-0.39%: 76% 🟢 day odds (86/113 times)
0.4-0.59%: 73% 🟢 day odds (40/55 times)
0.6-0.89%: 84% 🟢 day odds (16/19 times)
>0.9: 100% 🟢 day odds (7/7 times)
Red 🔴1st hour:
0-0.2%: 55% 🔴 day odds (101/182 times)
0.2-0.39%: 75% 🔴 day odds (82/110 times)
0.4-0.59%: 82% 🔴 day odds (31/38 times)
0.6-0.89%: 86% 🔴 day odds (19/22 times)
>0.9: 78% 🔴 day odds (7/9 times)
You'll see ES typically doesn't move as much %-wise compared to NQ, so the sample sizes on some of ES's larger opening candle ranges are much smaller (and therefore less significant) compared to NQ
English
Any questions about reports/timeframes etc. feel free to lmk - DMs are open, replies are on "verified only" bc of bots
Try Edgeful for free: edgeful.com/?via=tfo
English
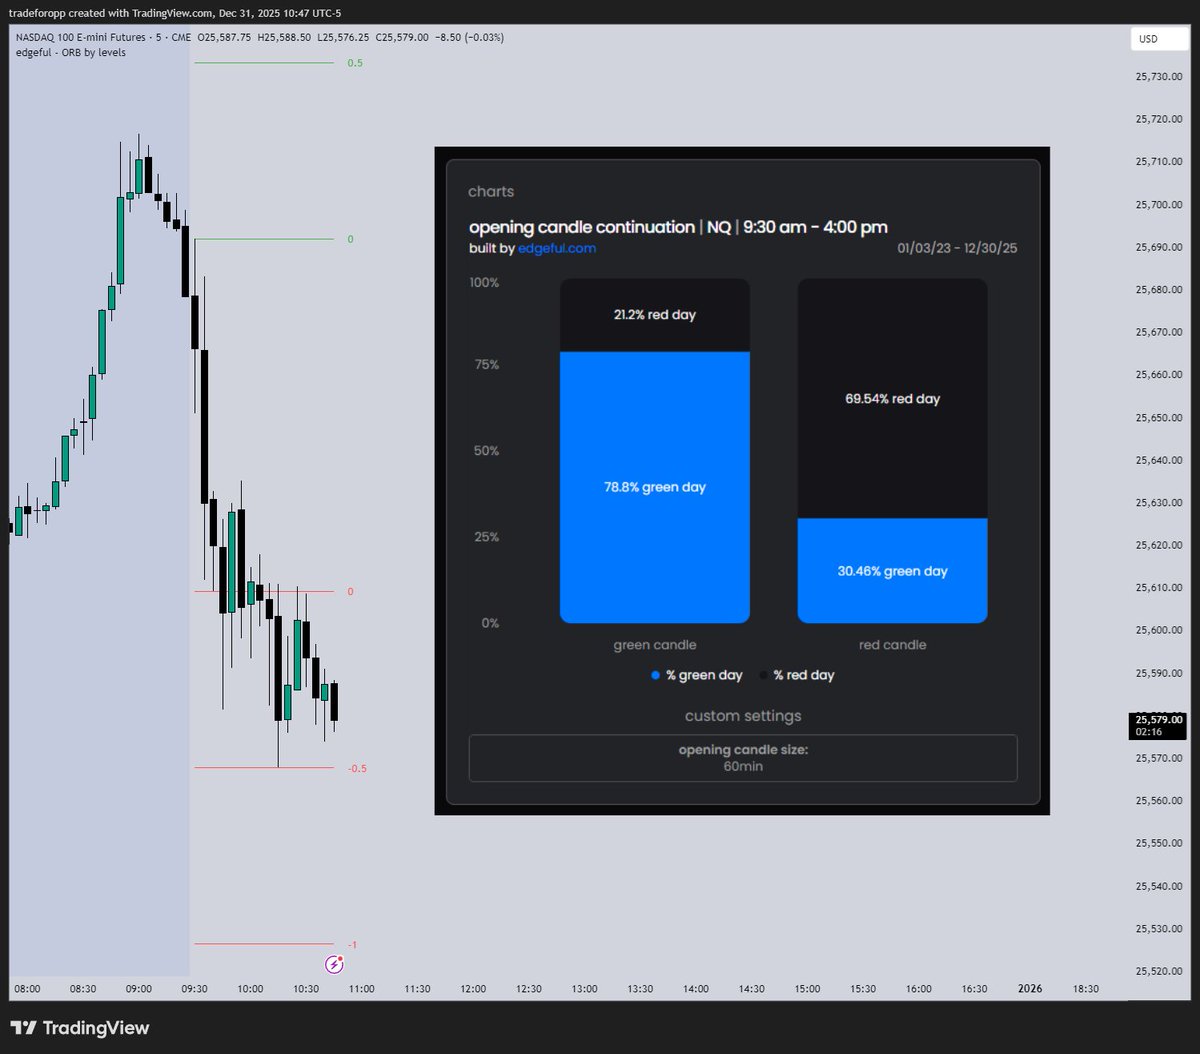
By 10:30 on NQ:
The 1st hour closed below its open:
~70% chance of a red day (RTH)
The 1st hour's low formed after the high:
~69% chance the low gets taken first
The previous day's RTH low was traded through:
~62% chance of a red day (RTH)
There was a breakdown from the 15m ORB (via a 5m close thru the low as confirmation). If the 5m does not close thru the OR high, the likelihood of a few OR extensions being reached are as follows:
> -0.5: ~94% hit rate
> -1.0: ~81% hit rate
> -1.5: ~62% hit rate
> -2.0: ~48% hit rate
Note, if the 5m *does* close above the 15m OR at any point today, then the previous stats are irrelevant; we would instead have to look at stats for double break days, which are shown here:
> +2.0: ~15% hit rate
> +1.5: ~26% hit rate
> +1.0: ~42% hit rate
> +0.5: ~69% hit rate
> -0.5: ~65% hit rate
> -1.0: ~41% hit rate
> -1.5: ~31% hit rate
> -2.0: ~20% hit rate
*All reports were generated using a 3 year lookback period on NQ
English