
Spike Spiegel
4.9K posts

Spike Spiegel
@TradeWithSpike
Just a humble bounty hunter. See you, Crypto Cowboy...
Moon Katılım Ocak 2021
87 Takip Edilen651 Takipçiler

A very unique setup with $MTBLY Moatable
55m market cap
22m cash
2 sass products. high customer retention
growing revs ~25%
Comparable sass is trading at a 4-6x rev. which would be a $320m val. at the lower end and projecting q4 25 (80m rev 25)
English

$SPX
December 2014-August 2015
This is the most similar PA I could find to what we’ve seen on daily TF. Food for thought 🤷♂️
Everyone loves to compare current tops to last top. For example everyone has been comparing this to April Tarrifs top last year and last year people were comparing it to the 2022 top when you should be looking elsewhere
It’s not a perfect example but imo best you can find, see how next couple days close up for possible relief bounce🤝

English

In essence, we'd look to work this range a bit, before its time to expand higher again.
I don't have a crystal ball, I don't know which route we take or when it will happen, but I DO know that I most likely want to be risk on, after a deviation and reclaim of range low, and consider being risk off as we approach any untapped supply or imbalances at the premium side of the range.
$BTC

English
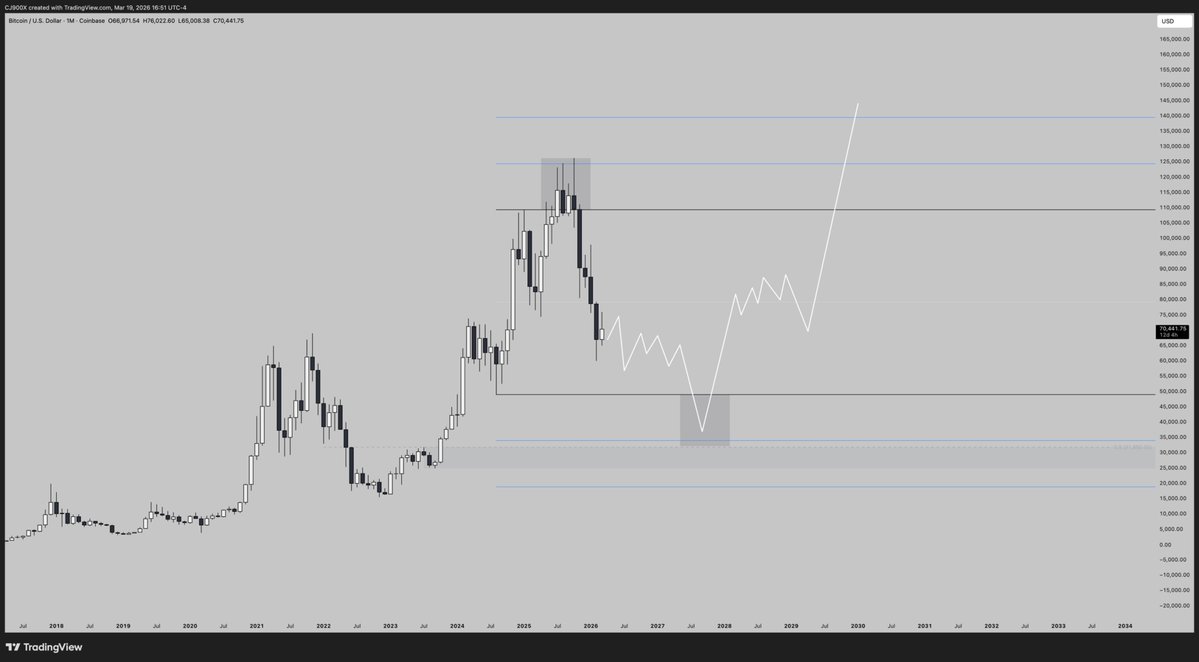
$BTC - HTF
It's either over, or we are so back. I get it. This is the way on CT.
I'm not really one for overly far out predictions, but I do like to think about potential HTF scenarios, which then ultimately helps to inform my lower timeframe trading decisions depending on which scenario I deem most probable at the time (i.e. it sets my bias / base case).
One scenario to keep in mind - there is the potential for BTC to consolidate and remain range bound for a couple of years. IF we did maintain these conditions for that time, I think it would look pretty decent from a structural pov and more than likely give us a lot more fuel for much higher prices by the end of it - as is typical in markets, the longer the consolidation, the more powerful the expansion tends to be.
I like to chalk up 1-3 potential scenarios and use the incoming data each week, month, quarter etc to try and determine which I think is most likely (again, this provides a bias / base case to work with).
For *this* particular scenario, step 1 would be a quarterly close below the green line. Meaning, we need to rally above 82.5k by end of March to lower the probability.
(side note: squiggly not drawn to scale in terms of time, I think such a scenario would take 1-2 years not 4-5)
The reason I am posting this is more for educational purposes and less to make a prediction and then wait until 2028 when there's no one left on CT to say "I told you so". If this scenario were to materialise, you want to be thinking about when to be risk on, and when to be risk off, across quarterly or yearly rotations, and not "are we in a bull market or a bear market". Technically if you zoom out far enough, we are of course in a perpetual bull market.
Cheers

English
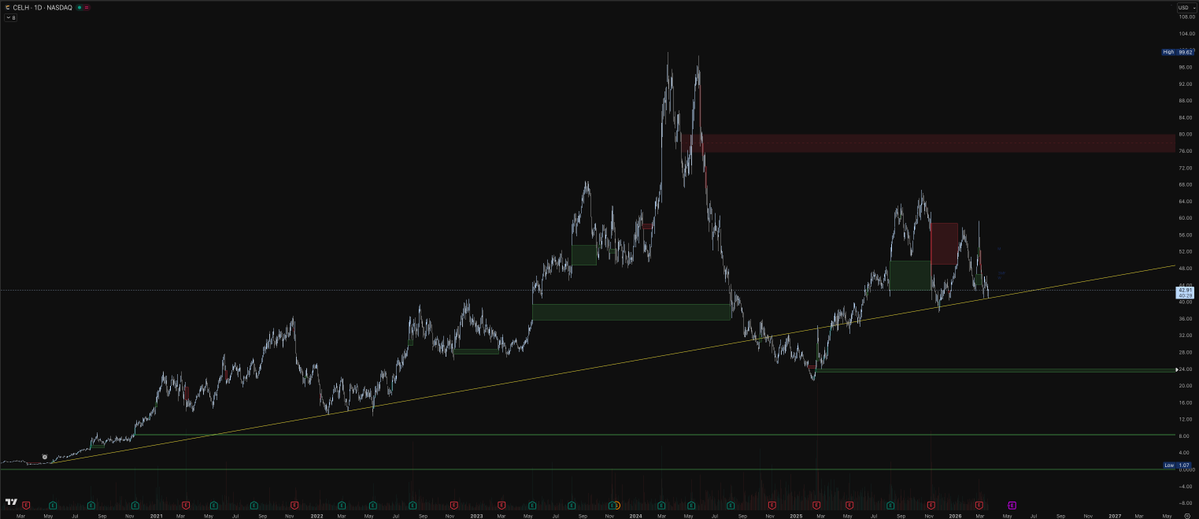
$CELH 🐂 here
Big trendline supporting, everyone guzzling this stuff on the daily.
Crazy looking chart but I actually like the fundamentals.
English
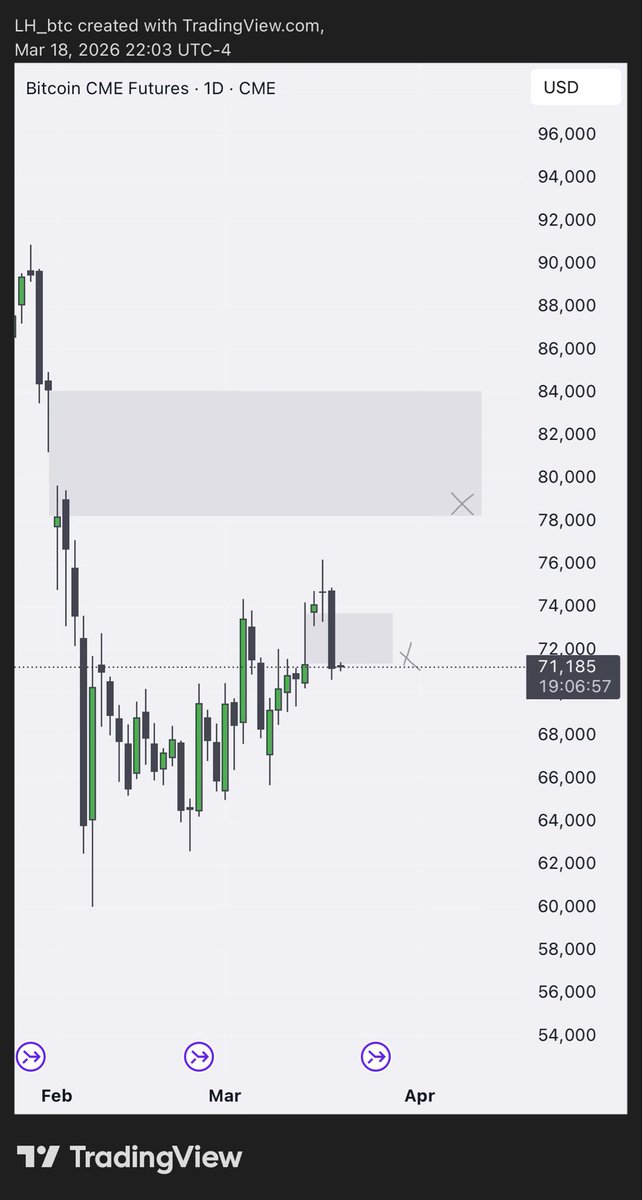

#BTC update
71-72k taken
bulls better be strong here at range highs so we can get 78k poi
LH@LH_btc
#BTC flat open taken — also FOMC later, are we ready
English
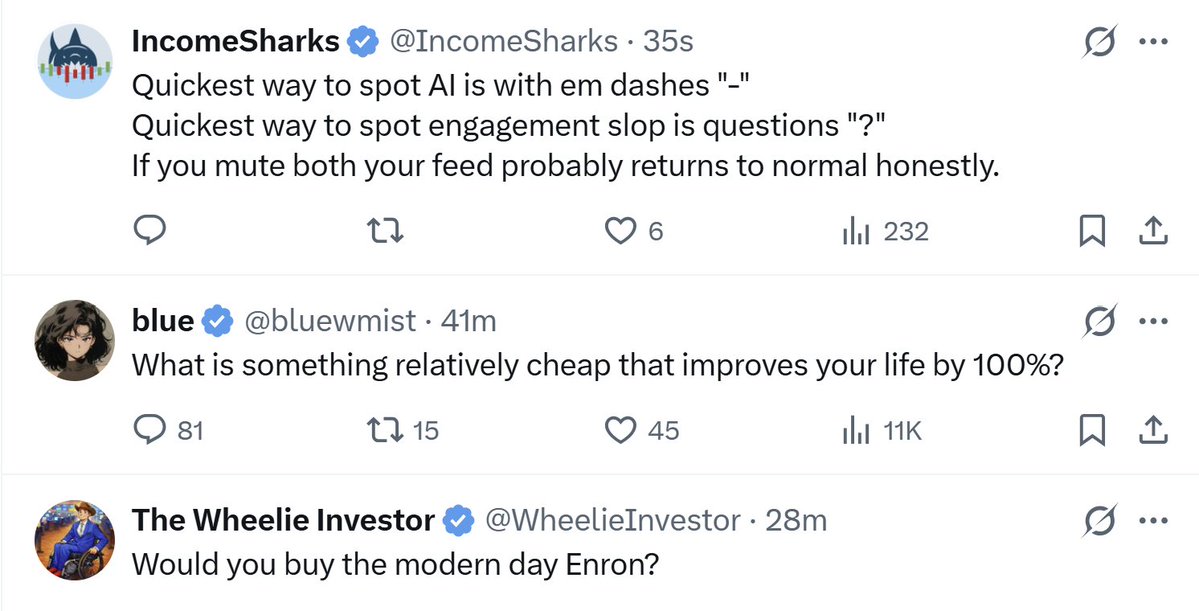
@IncomeSharks note to self, never ask shark questions with punctuation haha
English
Once you start spotting the question mark you can't unsee it. The 3 posts directly below mine all are questions lol.
English
Quickest way to spot AI is with em dashes "-"
Quickest way to spot engagement slop is questions "?"
If you mute both your feed probably returns to normal honestly.
English
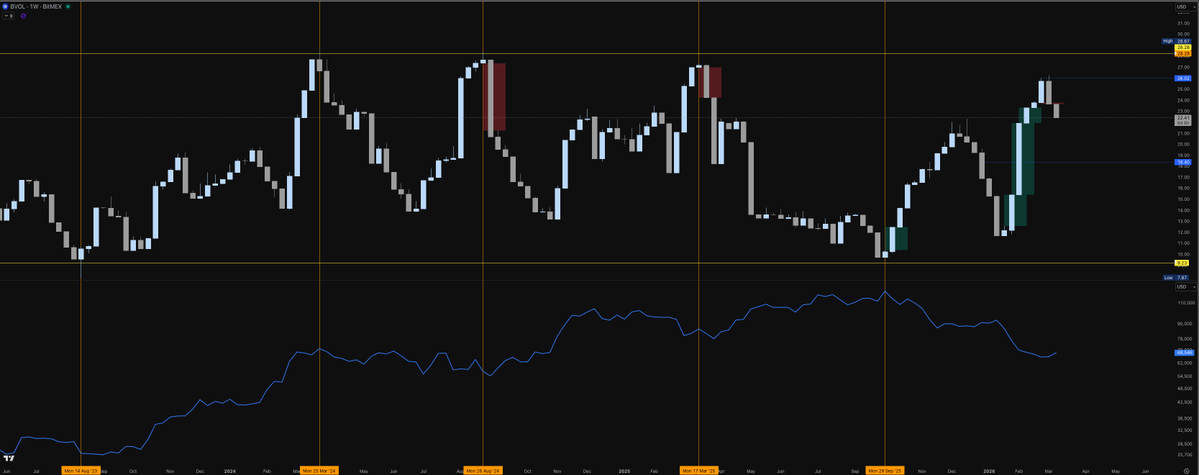
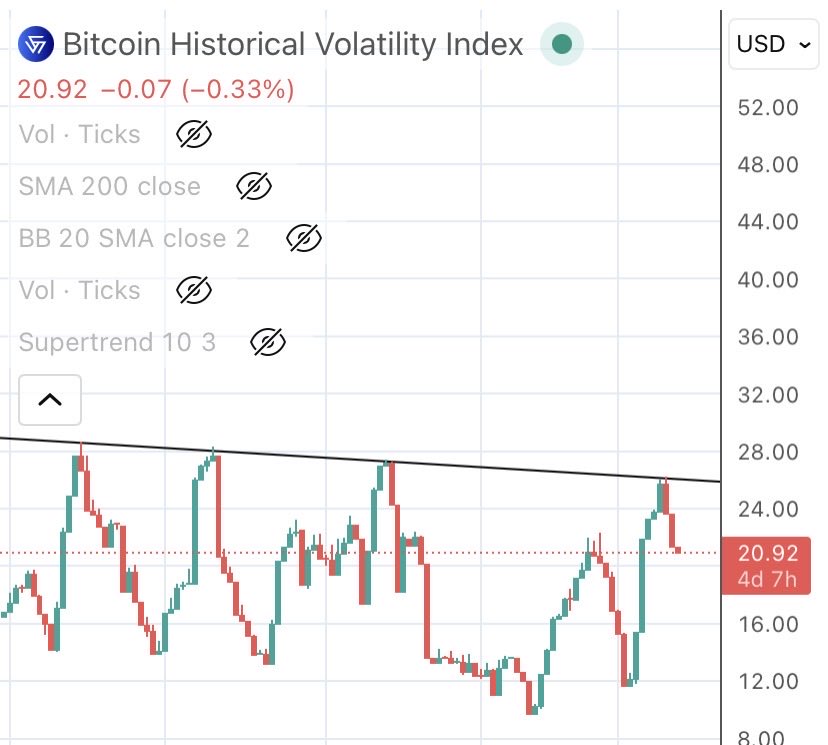
@AlexLongneck @CastilloTrading def is true, zoom out on the chart and its clear. we have a new vol regime since 2022
English

@TradeWithSpike @CastilloTrading Could also fit the narrative of lessening volatility over time
👍🏻
English
$BVOL is $BTC volatility index.
When it hits the extrme of this range, we get an infleciton, close to one now.
English
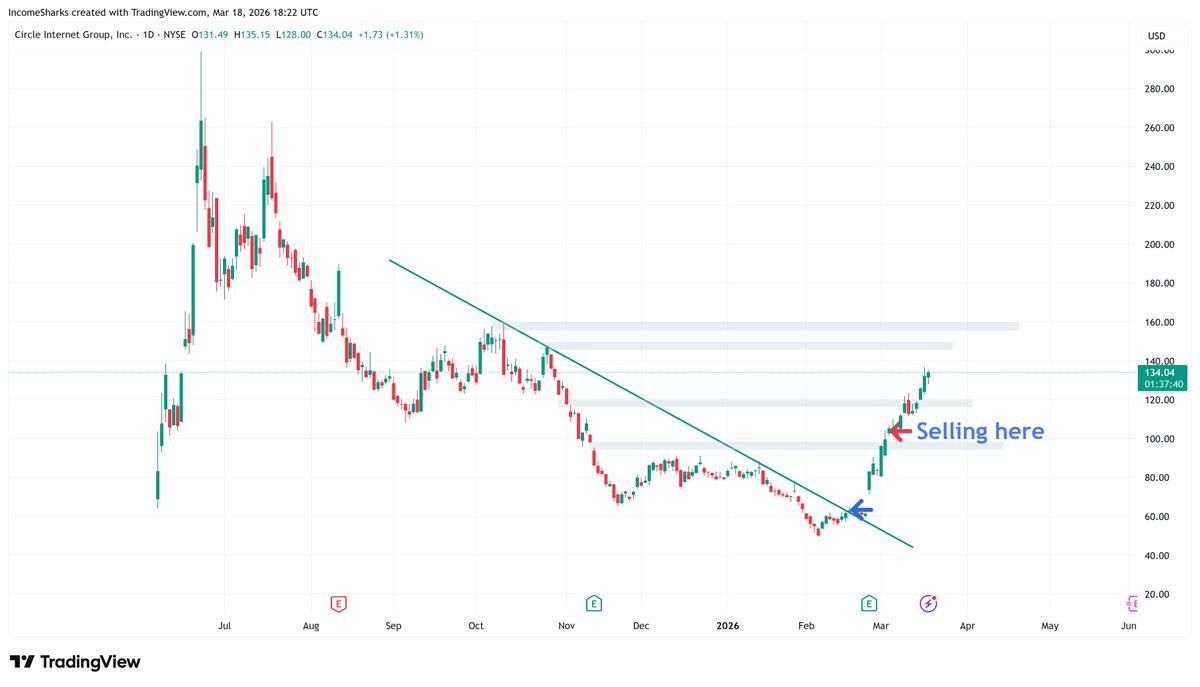
$CRCL - Stablecoins were the play. Market conditions had me feel fine locking profits in at 60% but this is now up 111%. No pullbacks either. This is the reality of trading when you actually share entries and exits, you can't and won't ever be perfect. Great entry, bad exit.
IncomeSharks@IncomeSharks
The entire 10/10 event explained in one chart. Investing in Gold is now a bet against America Investing in Bitcoin is now a bet for America Bitcoin goes up, Stablecoin demand goes up, US treasuries go up, rates come down, National Debt slows, dollar gets stronger
English
@AlexLongneck @CastilloTrading oh nice trendline find, gonna add to my chart thx
English
@TradeWithSpike @CastilloTrading What if those is what’s going on? Certainly looks plausible
English
@JTheretohelp1 @tradingview yeah exactly my point, the relative part:)
English

@TradeWithSpike @tradingview I’m bearish on NVDA, so it certainly could Spike. That said, remember with ratio charts it would imply Bitcoin outperforms on a “relative” basis.
English
NVDA Price Channel (since inception)
Know this
👇
Wall Street pundits always stick to bullish narratives until the end.
Focus on valuations, TA, & what insiders are doing. If you do this, you’ll go far. 😊
Check out my #NVDA analysis on @TradingView: tradingview.com/x/oUvcJlZ7/
English
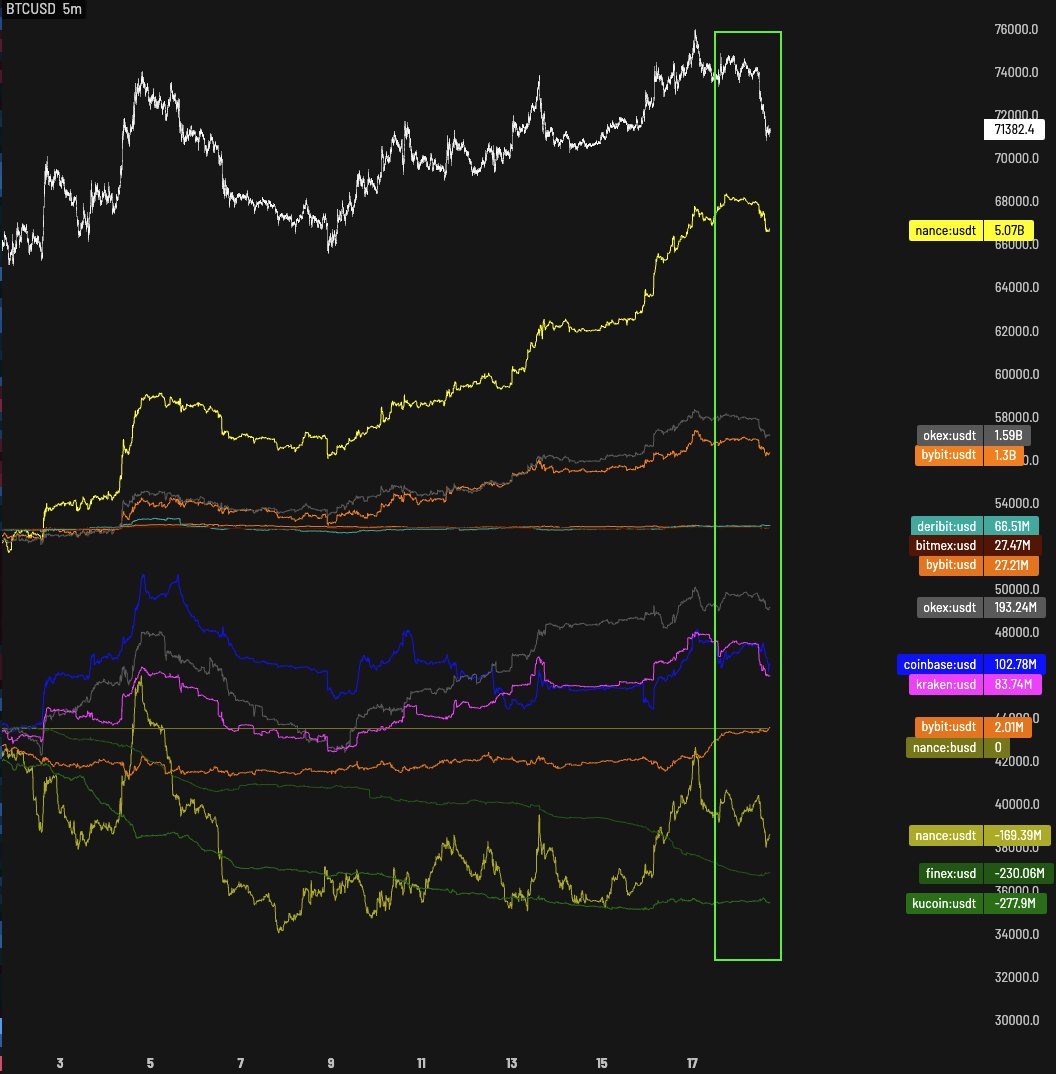
Drops like today haven't scared me like they have in the past.
Why? Well, Binance is no longer nuking Spot $BTC during them.
Prior, as $BTC selloffs happened, Binance would be leading the way with aggressive spot selling. Now, they simply just another exchange.
English
@KunnuInvests My quant says there’s a 50% chance it goes up and 50% chance it goes down 👏
You’re welcome
English

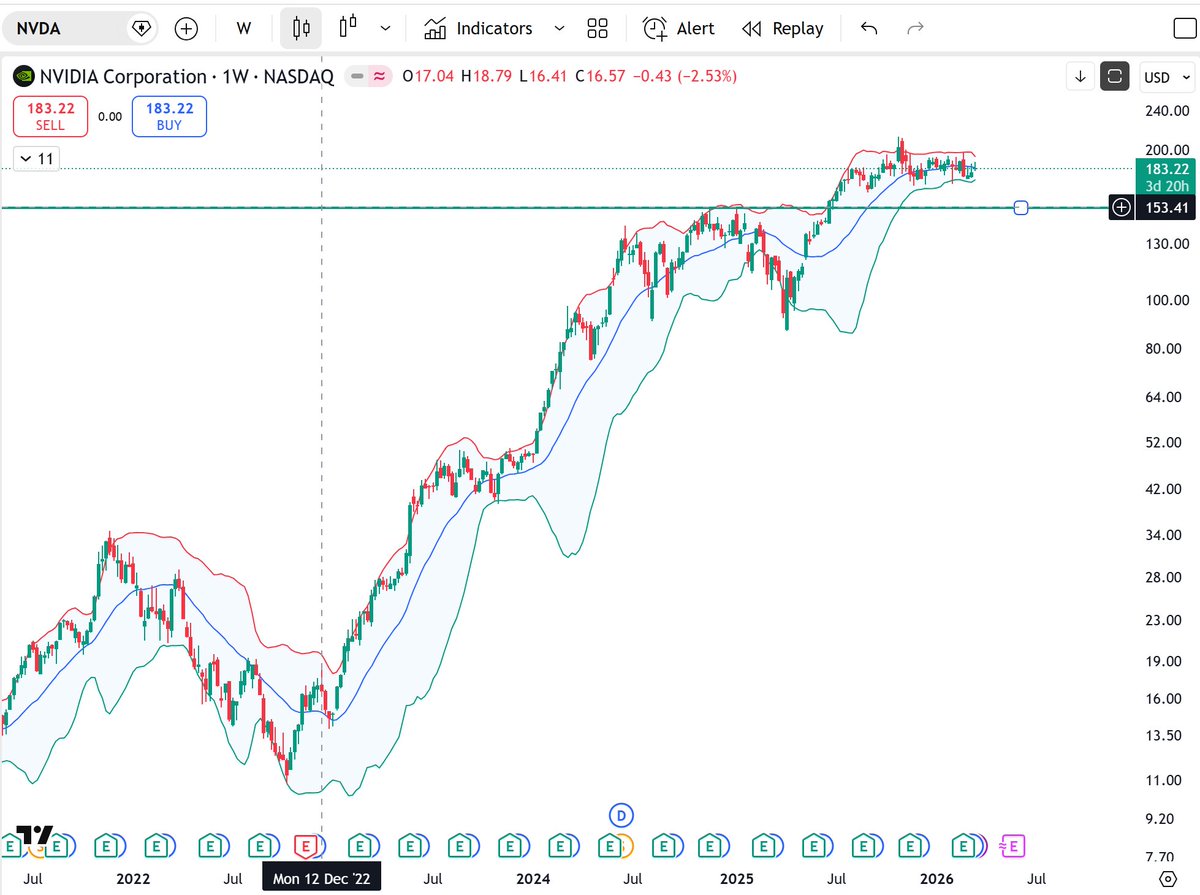
$NVDA weekly and 2-week Bollinger Bands are the tightest since 2014! A move is loading, and it will be violent in whichever direction it breaks.
This week feels decisive for $NVDA, $SPY, and $QQQ.
Two key catalysts:
- NVIDIA AI conference
- The Fed's first commentary after a significant rise in $OIL prices over the past month
Buckle up. It's about to get volatile 🍿.
English

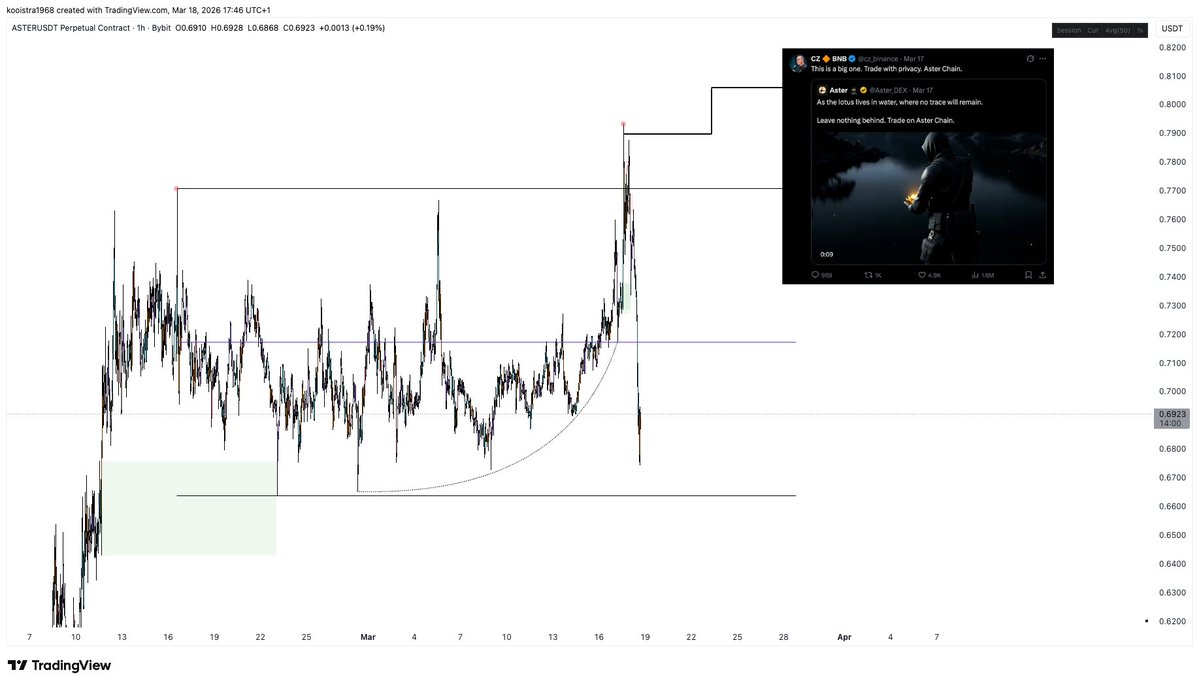
$ASTER
CZ is officialy fully back in action with his X post operating as 'bullish' catalysts, strategically timed with key pivotal distribution points on the chart.
ASTER took the range high taking out all buyside liquidity while building a textbook sellside liquidity curve. Had a LTF re-distribution at midnight and fully reversed.
I advice you compare the time of the post with the time of the reversal.
English
People will continue to be bearish on the right thing to own at the wrong time, and bullish on the wrong thing to own at the right time.
Case in point: the dollar.
Most analysts, pundits, and influencers have been—and remain—bearish.
They have been and will remain wrong.

JTheretohelp1@JTheretohelp1
DXY Monthly Some will have to learn the hard way... - Called the 2022 Top - Calling the 2026 Bottom Meanwhile, MOST are incredibly bearish on the buck! Watch and learn, dear friends! Check out my #DXY analysis on @TradingView: tradingview.com/x/Sdsc2WzU/
English

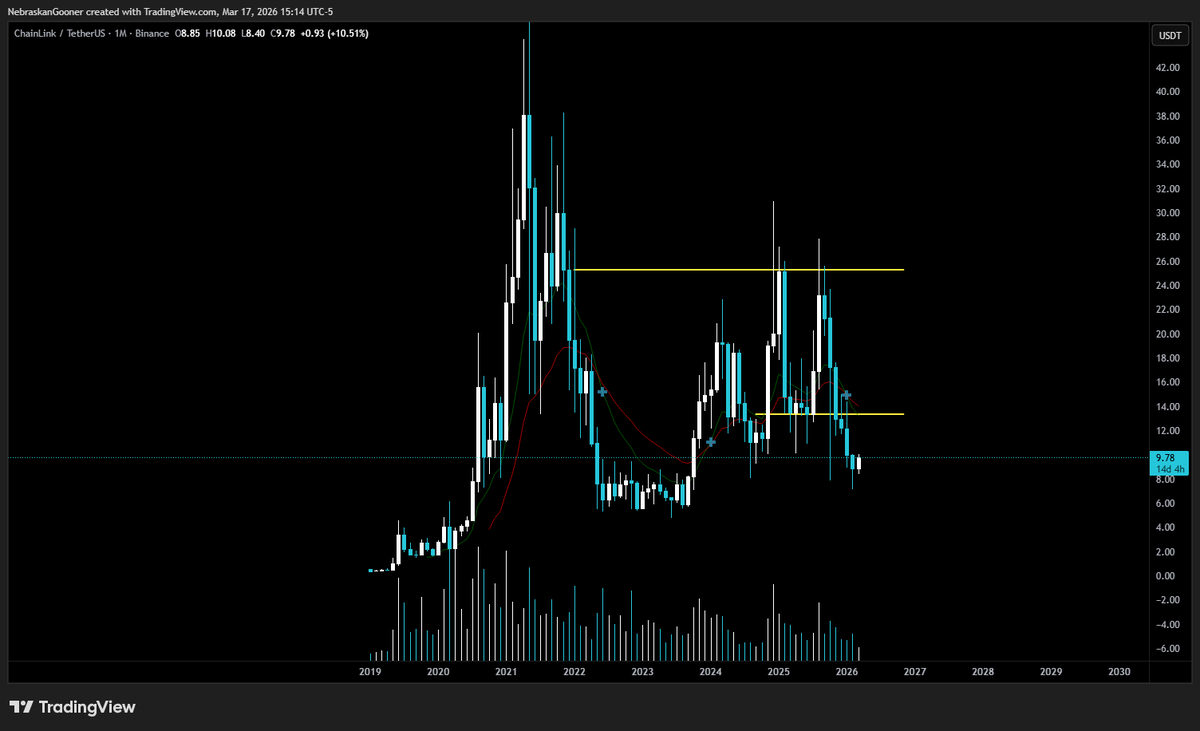
$LINK (per request)
I've been pretty adamant about not being interested in this one unless it broke that upper resistance and it's dropped a lot since then.
Still has a lot of work to do for me to be interested again. Maybe $13 area I would pay attention on HTF.
English

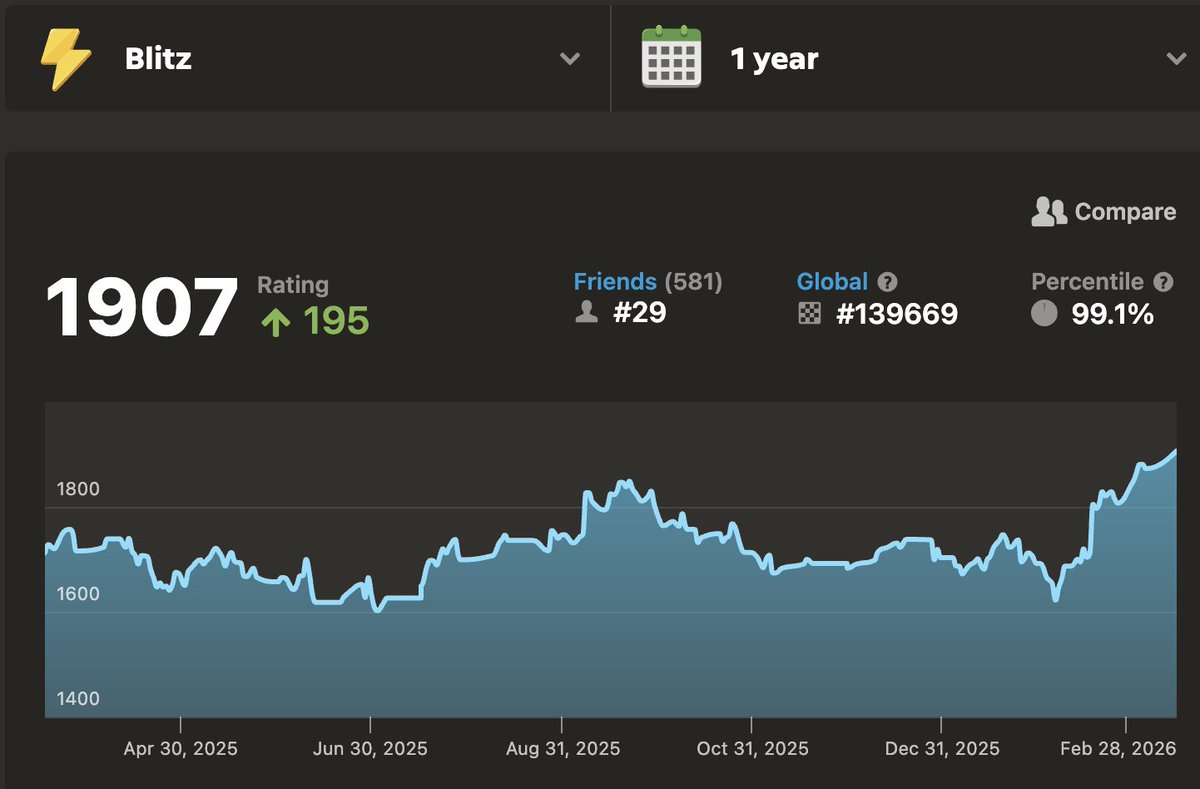
feels good to hit 1900 in blitz, not that anyone cares
English