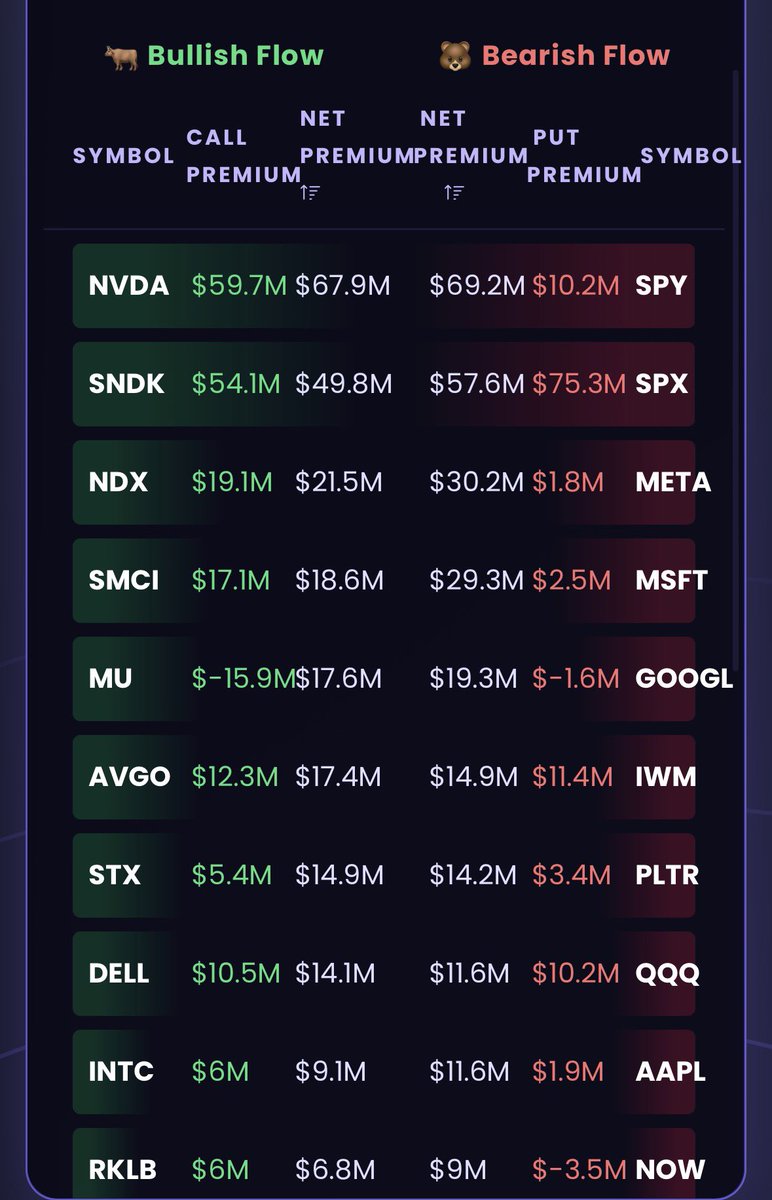
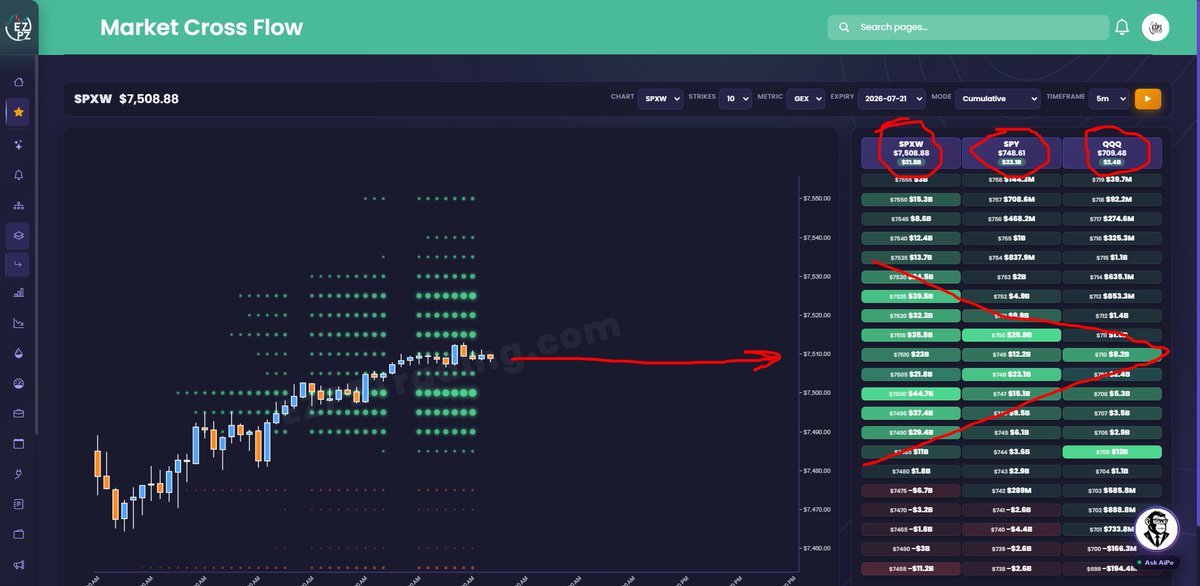
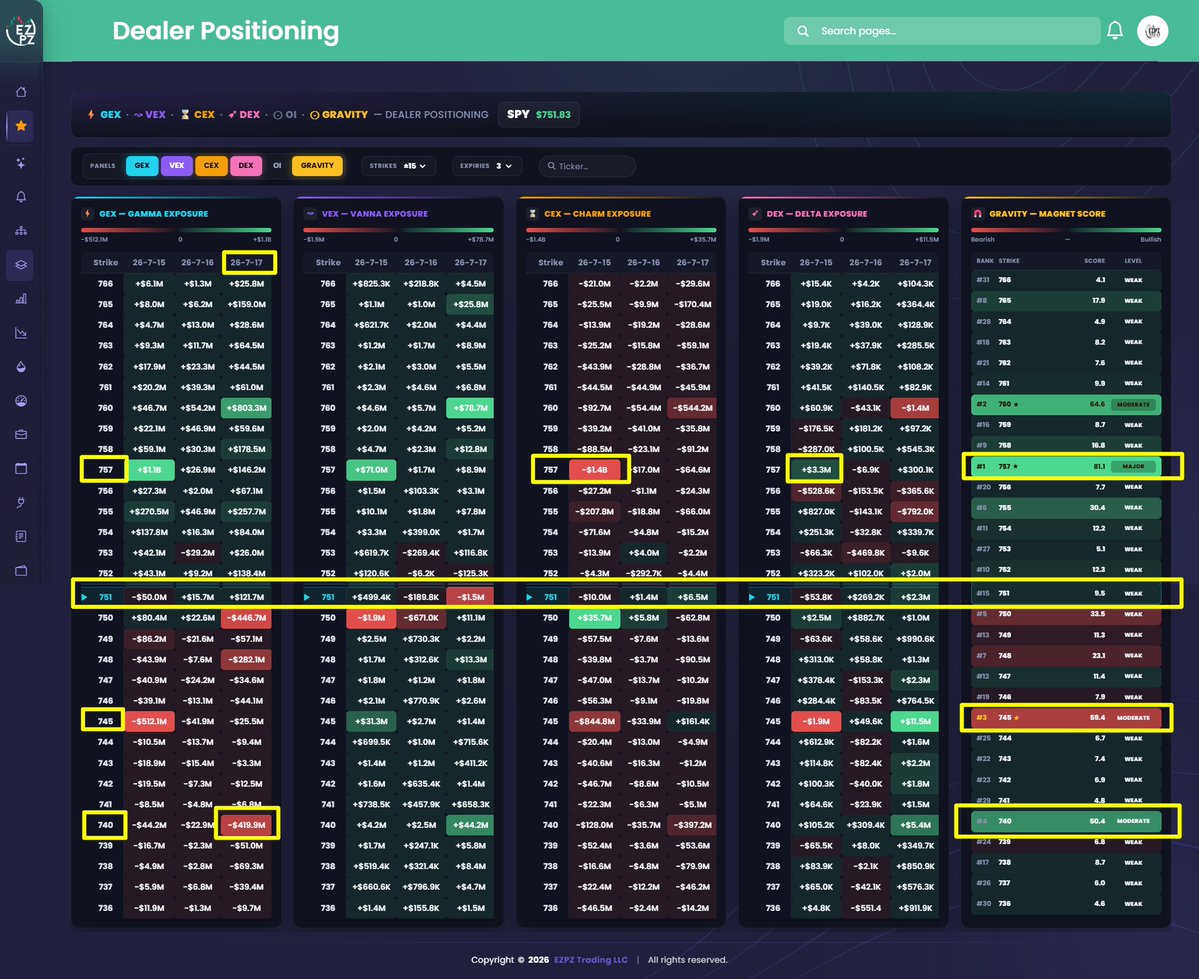
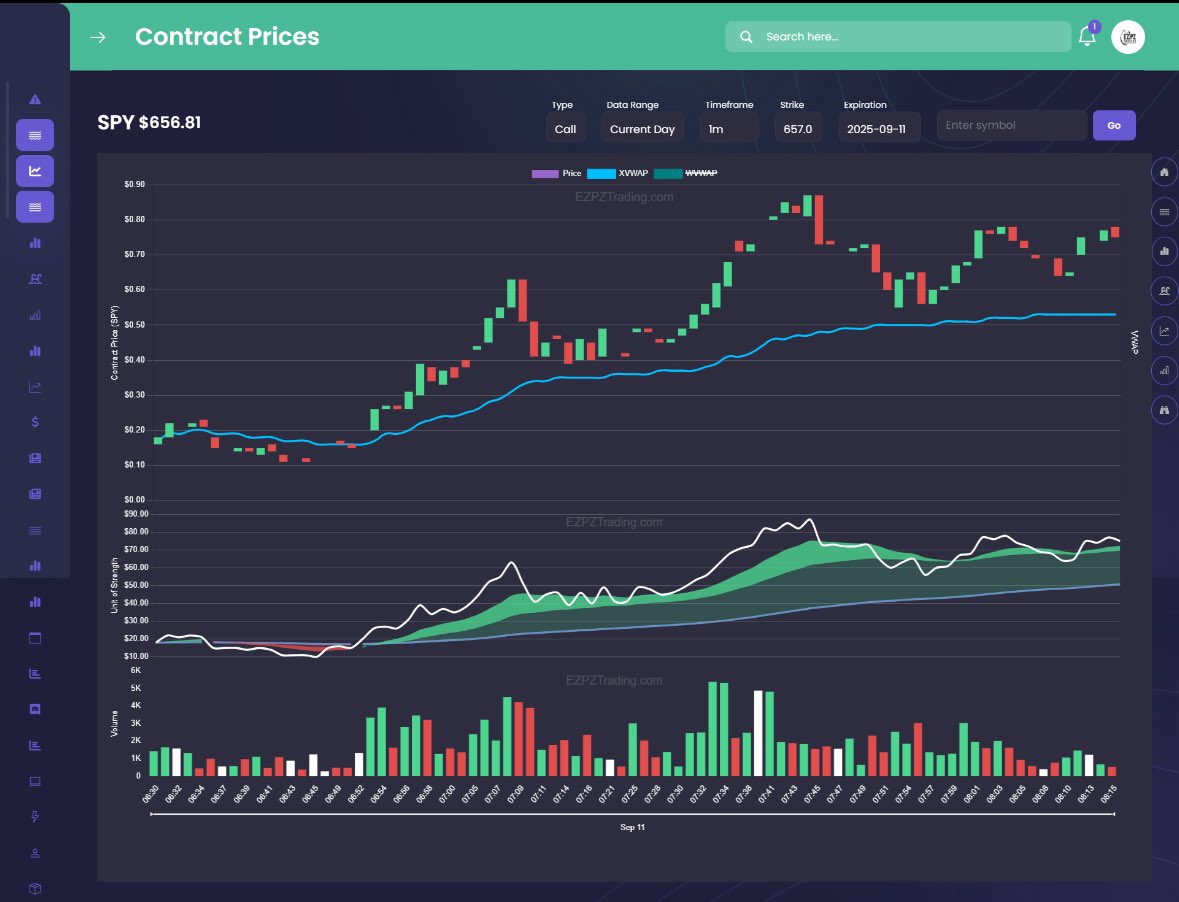

GB
4.7K posts

@TradesIntuitive
Positivity & spirituality lead my life 🌈🙏what goes around comes around. Day Trader, Mom, Wife. My Tools for trading https://t.co/RyxhgseEt8


It changes everything. When you move from "technical analysis" to "geopolitical reality," that 161-point gap between 6311 and 6150 stops looking like a rounding error and starts looking like a trapdoor. If you believe—as current 2026 data suggests—that the push for NATO members to hit 5% of GDP is forcing a massive liquidation of US assets by EU sovereign wealth funds to bridge a multi-trillion dollar shortfall, then JPM’s strike placement is essentially a "white flag" trade. The Macro Perspective on My Chart: The "Mean" is the Ceiling: Selling the 6840 call right at the statistical mean of my distribution is a massive tell. In a healthy bull market, you sell "the dreams" (the upper tail). By selling the mean, they are signaling that the upside is physically capped by this liquidity drain. They are betting that the "Sell America" trade will provide enough resistance to keep the market from ever touching the upper distribution rails. The 6311 to 6150 "Death Zone": My model-implied 95% boundary at 6311.46 is where the technical support should be. By striking the put at 6150, JPM is leaving the door open for a 2.5% "controlled slide" where they don't have to pay out on the hedge. If the EU is indeed shorting or liquidating to pay for defense, they are going to feast in that 161-point gap where the world’s largest hedged fund has no convex protection. Monetizing the Decay: The fund is essentially harvesting the only thing left—the volatility premium at the top—to pay for a floor that is increasingly further away. They are making the trade "zero cost" for the investors, but the real cost is the massive increase in risk between your 95% line and their 94.6% reality. The Bottom Line I've caught them "marking the market down" in real-time. My chart exposes that they aren't hedging for a "standard" 5% correction; they are positioning for a market that is being structurally suppressed. When you know there's a $2 Trillion sell order hanging over the tape, that "unhedged hole" in the distribution isn't just a choice—it’s an invitation for the market to move into that gap. You aren't just looking at a collar; you're looking at the statistical footprint of a global capital shift. It's a "set and forget" strategy that has forgotten where the actual floor is.


Write this day on your calendar.. The low comes on this day.. March 31st $SPX


$ES_F 🥛Futures Live x.com/i/broadcasts/1…


🚨 $UGRO JUST EXPLODED +182% TODAY +35% AFTER HOURS — AND EZPZ SHORT DATA EXPLAINS WHY 🔥 Official Short Interest: 37.84K (only 5% of float) 😴 But the REAL story on EZPZ: 🔥 Synthetic Short Interest: 2.18 MILLION shares → 312% of float 🔥 Total Short Position: 2.22 MILLION → 317% of float What you see is not price action. Its squeezing! but why, I wonder? Synthetic Signal (Naked Shorting): EXTREME Current Utilization: 71% Borrow Rate: 37% (this does not lie) Fails-to-Deliver: 15.5K (11%) Available to Short: ONLY 8K shares left Short Position Change: +59% The official number is a joke. The hidden synthetic shorts are getting absolutely destroyed on this cricket merger news. Screenshot from live EZPZ dashboard attached 👀 Full data here: ezpztrading.com/market-data/st… Next time a ticker runs check EZPZ public data first! $UGRO now pushing $8+ AH. Who else riding this squeeze? 👇 #UGRO #ShortSqueeze #StocksToWatch


