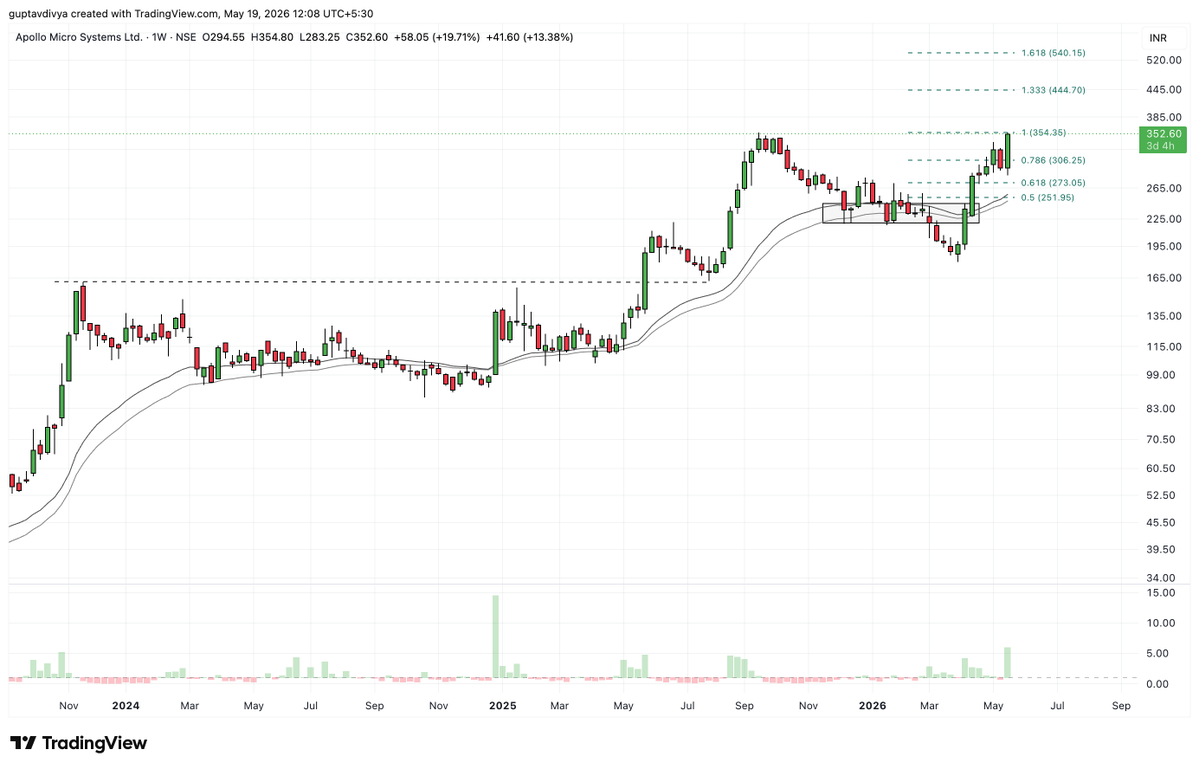
Tradetalkss

2.6K posts

Tradetalkss banner
Tradetalkss

Tradetalkss

@Tradetalkss

Investor-Trader. Lets grow & glow together. Tweets are for educational purpose only. We are NOT sebi registered

Mumbai, India Katılım Eylül 2022
309 Takip Edilen7.5K Takipçiler
Tradetalkss
Tradetalkss@Tradetalkss·
#Arkade If this moves well in the anticipated direction, then this will be a completion of head and shoulder pattern! Once the head & shoulder is made and stock starts trading above the 30-40 weekly moving averages, this wont wait and give us time to enter chat.whatsapp.com/I8kqnuQtPjcCBy…
Tradetalkss tweet media
English
0
0
13
1.3K
Tradetalkss
Tradetalkss@Tradetalkss·
#NIFTY Once again nifty tried moving below the cloud, and yet again it has moved up and closed in the cloud This is what we discussed the last time as well - that market looks range bound unless a very positive / negative news comes in our way! chat.whatsapp.com/I8kqnuQtPjcCBy…
Tradetalkss tweet media
Tradetalkss@Tradetalkss

#NIFTY50 The index is currently trading *inside the Ichimoku Cloud*, which generally signals a phase of *sideways price action*. When price remains within the cloud, it usually indicates that neither bulls nor bears have complete control of the trend yet. What makes the current setup interesting is: * Price is oscillating within a defined range instead of showing directional momentum * The cloud ahead is relatively broad, suggesting multiple support and resistance zones nearby * Every dip is finding support, but upside follow-through is also getting sold into * This creates a classic *time-wise correction* rather than a deep price-wise correction As long as Nifty continues to remain inside this cloud structure, expect: * More choppy sessions * Range-bound movement * Sudden intraday reversals * Stock-specific action instead of broad index momentum The market may require *more days of consolidation* before a decisive breakout emerges. A sustained move: - Above the cloud can trigger fresh bullish momentum - Below the cloud may invite another corrective phase Till then, the market structure suggests patience over aggression. Focus should remain on selective opportunities while the index continues building a base within the cloud zone. chat.whatsapp.com/I8kqnuQtPjcCBy…

English
0
2
6
666
Tradetalkss
Tradetalkss@Tradetalkss·
Inflation Rising? Most investors panic when inflation rises. But portfolio managers look at it differently. Because inflation does NOT impact every sector equally. The real question is: Which companies can make MORE money when prices rise? Here’s how smart money usually looks at inflation 👇 1. BANKING & FINANCIALS - When inflation rises, interest rates usually move higher. This helps banks because: -Loan yields improve -Margins expand -Profitability improves That’s why strong banks often outperform in early inflation cycles. 2. ENERGY & OIL- Inflation is often driven by rising commodity prices. Higher crude oil prices can benefit: -Oil producers -Refiners -Energy companies 3. METALS & MINING - When inflation rises: Steel, Copper and Aluminium often become expensive. Commodity producers benefit because selling prices rise faster than costs. 4. FMCG WITH STRONG BRANDS - Not all companies can survive inflation easily. But businesses with strong brands can simply increase prices. That is called “Pricing Power” -Customers still buy their products even after price hikes. -That’s real business strength. Best Long-Term Strategy is to build a portfolio with: -Compounders with pricing power -Some commodity exposure -Strong financials -Real assets -Limited weak-margin businesses This gives both: growth, inflation protection without depending on macro predictions every quarter. #StockMarket #Investing #Inflation #PortfolioManagement #WealthCreation
English
0
0
2
311
Tradetalkss
Tradetalkss@Tradetalkss·
#WAAREEENER The stock is currently at a very important technical zone. After the earlier breakout, price is now revisiting the same breakout area — a classic breakout retest structure. If the stock manages to hold this zone, it can set up for the next leg of upmove. As long as 2950–3000 holds, the broader structure remains constructive. chat.whatsapp.com/I8kqnuQtPjcCBy…
Tradetalkss tweet media
English
0
2
9
785
Tradetalkss
Tradetalkss@Tradetalkss·
#GODFRYPHLP Blockbuster results + price structure reversal starting to align together. After a long correction phase, the stock is now showing signs of bottom formation with a possible rounding base developing on the weekly chart. chat.whatsapp.com/I8kqnuQtPjcCBy…
Tradetalkss tweet media
English
0
2
8
497
Tradetalkss
Tradetalkss@Tradetalkss·
#IIFLCAPS – Weekly Chart The stock has spent almost a year consolidating after a strong rally, and is now again approaching a crucial resistance zone near 345–350. Key observations: -Strong base formation visible above 280 =Price has reclaimed key moving averages -Higher low structure remains intact -Repeated resistance tests near 350 suggest supply absorption The current setup looks like a classic consolidation before a potential expansion move. Volume participation has also improved during recent recovery candles, indicating renewed interest in the stock. Overall structure remains constructive as long as the stock sustains above the breakout support zones. chat.whatsapp.com/I8kqnuQtPjcCBy…
Tradetalkss tweet media
English
0
3
14
787
Tradetalkss
Tradetalkss@Tradetalkss·
#CRUDEOIL #CRUDE #BRENT #WTI Crude Oil is one of the toughest assets to analyse purely technically because price is heavily influenced by: -Geopolitical tensions -OPEC production decisions -Dollar movement -Inflation expectations -Global growth outlook -But technically, crude is now trading inside a narrowing triangle formation after a massive rally from the $70 zone. Current observations: -Higher lows are visible from recent swing bottoms -Lower highs are compressing price action near $100–102 -Moving averages are gradually catching up with price -Volatility contraction usually precedes expansion This means the market is waiting for a major trigger. -A breakout above the falling trendline can quickly push crude updwards of $108 / $115+ -While breakdown below the rising support trendline can bring $95 / $90 zone Technically + macros both suggest: ⚠️ A large directional move may be approaching soon. chat.whatsapp.com/I8kqnuQtPjcCBy…
Tradetalkss tweet media
English
1
2
9
1.9K
Tradetalkss
Tradetalkss@Tradetalkss·
#NIFTYIT – Monthly Chart Nifty IT has been consolidating inside a broad range after a strong multi-year rally. The recent correction has brought the index back near the lower end of this long-term consolidation zone. What makes this level important: ? - Historical support zone is being tested again - Price is near key long-term moving averages - Previous consolidation breakout zone is acting as support - Monthly structure still remains higher-high, higher-low on a broader timeframe Most importantly, there is strong Ichimoku confluence near current levels: - Price is approaching the monthly cloud support - Conversion & base line support zone is nearby - Multiple technical indicators are aligning around the same area This suggests the sector is entering a high-probability demand zone rather than a breakdown phase. As long as the index holds the highlighted support range, this could turn into a strong accumulation area for the next structural move in IT stocks. chat.whatsapp.com/I8kqnuQtPjcCBy…
Tradetalkss tweet mediaTradetalkss tweet media
English
0
3
15
1.9K
Tradetalkss
Tradetalkss@Tradetalkss·
#oil #OILINDIA – Weekly Chart After correcting nearly 30–35% from the highs, the stock has spent months building a strong base between 400–520. Now price is once again testing the crucial 520–530 resistance zone while holding above key moving averages — a sign of strength. What looks positive: - Higher low formation intact - Strong support near 470–480 - Repeated resistance tests usually weaken supply - Volume improving on up moves A decisive weekly breakout above 525 can open upside towards - if this is supported by good volumes Till then, expect consolidation near resistance before the next major move. chat.whatsapp.com/I8kqnuQtPjcCBy…
Tradetalkss tweet media
English
0
8
31
2.4K
Tradetalkss
Tradetalkss@Tradetalkss·
#NIFTY50 The index is currently trading *inside the Ichimoku Cloud*, which generally signals a phase of *sideways price action*. When price remains within the cloud, it usually indicates that neither bulls nor bears have complete control of the trend yet. What makes the current setup interesting is: * Price is oscillating within a defined range instead of showing directional momentum * The cloud ahead is relatively broad, suggesting multiple support and resistance zones nearby * Every dip is finding support, but upside follow-through is also getting sold into * This creates a classic *time-wise correction* rather than a deep price-wise correction As long as Nifty continues to remain inside this cloud structure, expect: * More choppy sessions * Range-bound movement * Sudden intraday reversals * Stock-specific action instead of broad index momentum The market may require *more days of consolidation* before a decisive breakout emerges. A sustained move: - Above the cloud can trigger fresh bullish momentum - Below the cloud may invite another corrective phase Till then, the market structure suggests patience over aggression. Focus should remain on selective opportunities while the index continues building a base within the cloud zone. chat.whatsapp.com/I8kqnuQtPjcCBy…
Tradetalkss tweet media
English
0
5
31
4.6K
Tradetalkss
Tradetalkss@Tradetalkss·
#BHARTIAIRTEL After spending multiple weeks in consolidation, the stock is finally showing signs of strength again. What makes this setup interesting is that despite market volatility, the stock refused to break down meaningfully. Instead, it kept absorbing supply in a tight range near support levels. Now we are seeing: ✅ Strong bullish weekly candle ✅ Breakout from the consolidation zone ✅ Price reclaiming important moving averages ✅ Signs of fresh momentum building up This kind of structure is important because strong stocks usually don’t correct deeply — they spend time consolidating, shaking out weak hands, and then continue the primary trend. The longer the base, the stronger the potential move after breakout. And in Airtel’s case, the consolidation lasted for weeks, which makes this breakout worth tracking closely. A clean follow-through from here can open the doors for a fresh trending move in coming weeks. 📈 chat.whatsapp.com/I8kqnuQtPjcCBy…
Tradetalkss tweet media
English
0
1
11
744
Tradetalkss
Tradetalkss@Tradetalkss·
#BEL is showing one of the strongest bullish characteristics a stock can have: Tight consolidation near lifetime highs. -This is NOT weakness. -This is supply absorption. What makes this structure attractive? • Every correction is shallow • Every dip is getting bought earlier • Clear Higher Low formation • Rounded consolidations instead of sharp breakdowns • Weekly trend structure still intact Strong stocks don’t fall easily after rallies. They consolidate near highs, frustrate participants, absorb supply, and then prepare for the next expansion move. Price is spending TIME correcting, not PRICE correcting. This usually indicates: -Institutional accumulation -Strong hands holding positions As long as higher lows remain intact, the broader bullish structure remains constructive. A sustained breakout above the current resistance zone can open the path toward higher Fibonacci extension levels in the coming weeks/months. The tighter the base near highs, the stronger the potential expansion move can become. 🔥 #BEL #Nifty #StocksToWatch #IndianStockMarket #TechnicalAnalysis #Investing #SwingTrading chat.whatsapp.com/I8kqnuQtPjcCBy…
Tradetalkss tweet media
English
1
6
38
3.3K
Tradetalkss
Tradetalkss@Tradetalkss·
I will share a few charts that are at the Ichimoko cloud support 1.⁠ ⁠Eternal - We can see the end of cloud turning into Green . 2.⁠ ⁠Nifty - Even Nifty is around the cloud support, but the trend has not fully turned positive as the cloud further is still red chat.whatsapp.com/I8kqnuQtPjcCBy…
Tradetalkss tweet mediaTradetalkss tweet media
English
0
0
3
676
Tradetalkss
Tradetalkss@Tradetalkss·
#Vodafoneidea #voda #idea - It took a small hiccup around 12.8 - It never closed above 10.62 on weekly basis - If this week it closes above 10.62, we can expect more upside here - This looks like a good set up as it looks like a start of Wave 3 chat.whatsapp.com/I8kqnuQtPjcCBy…
Tradetalkss tweet media
Tradetalkss@Tradetalkss

Right now, this stock is in a sideways trend with a making of higher lows I have always stayed out of a script that has shown such a strong down trend. Right now, this stock is in a sideways trend with a making of higher lows & higher highs What do you think about this stock and trading here? #IDEA

English
0
2
13
1.8K