David F

13.8K posts

David F banner
David F

David F

@TradingHurst

Market cycle detection via novel signal processing techniques. If a cycle exists, we will detect it! Learn about this approach: https://t.co/jTRQrdxKpp

Cambridge Katılım Ocak 2015
26 Takip Edilen6.2K Takipçiler
David F
David F@TradingHurst·
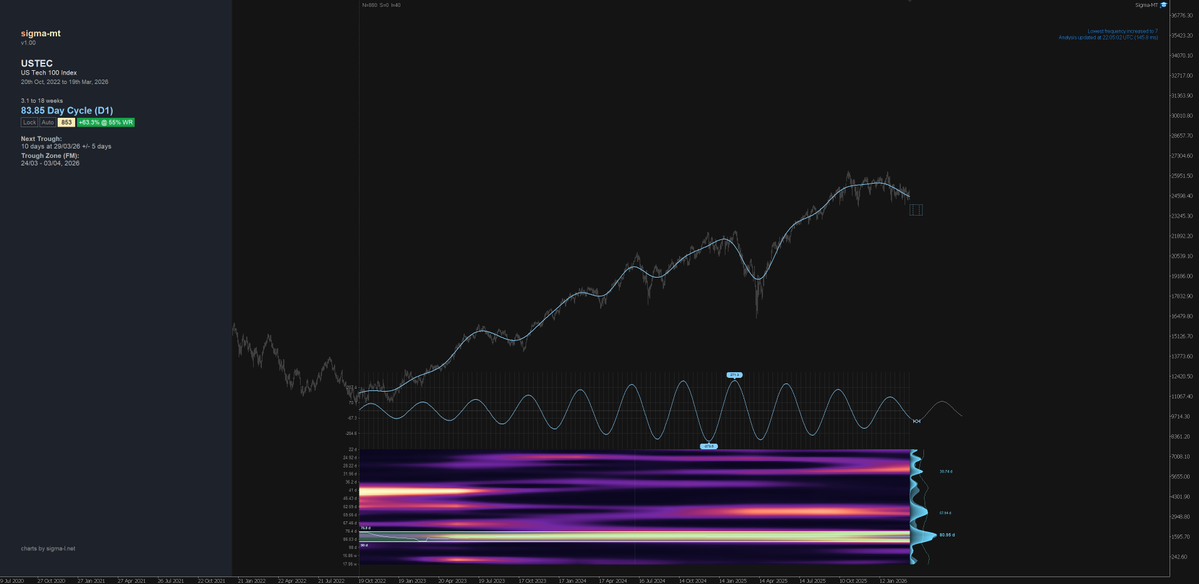
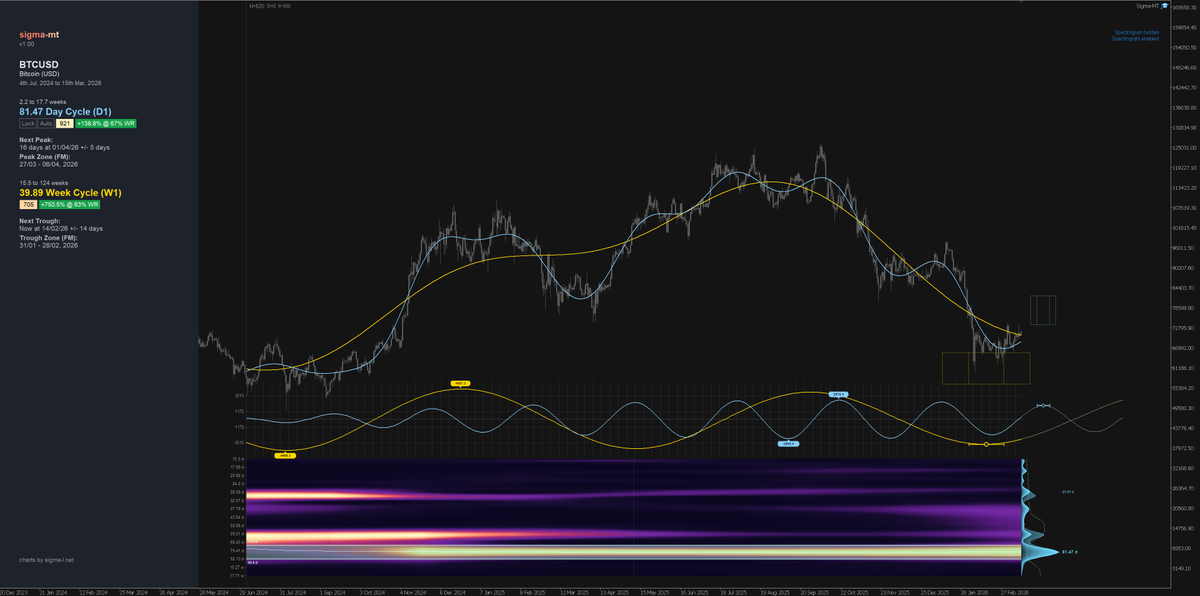
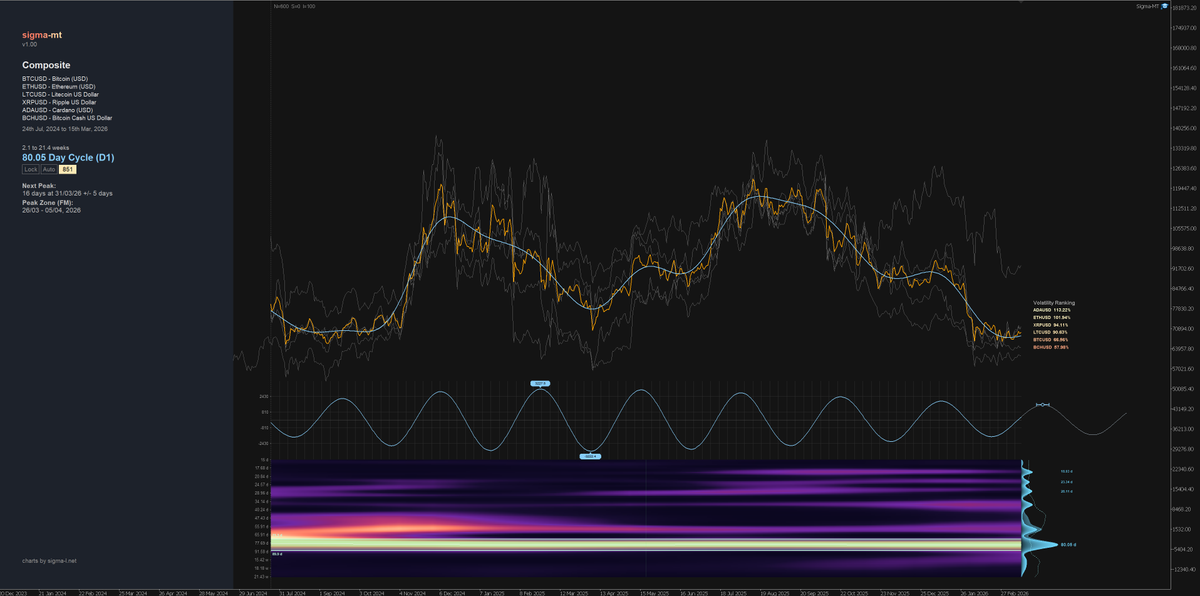
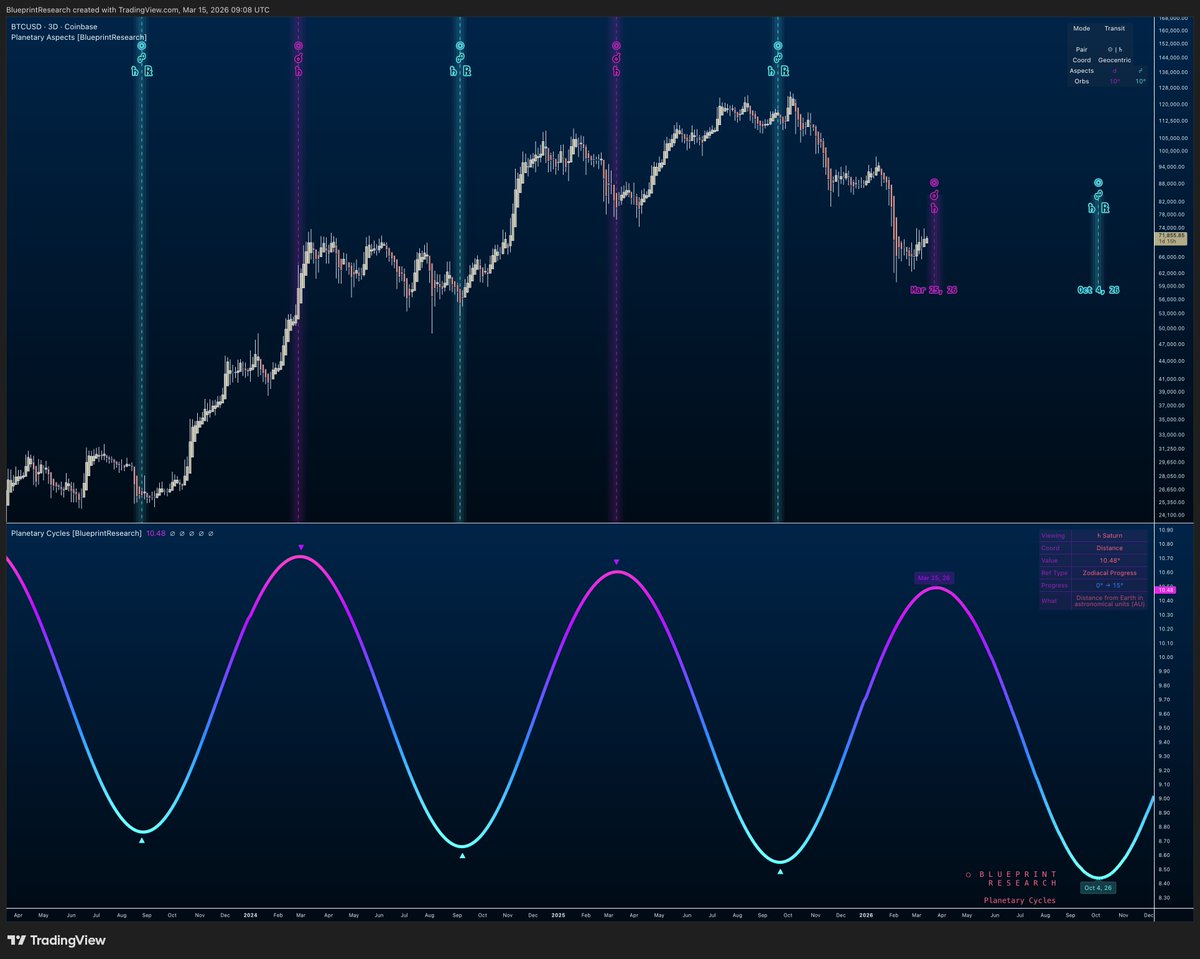
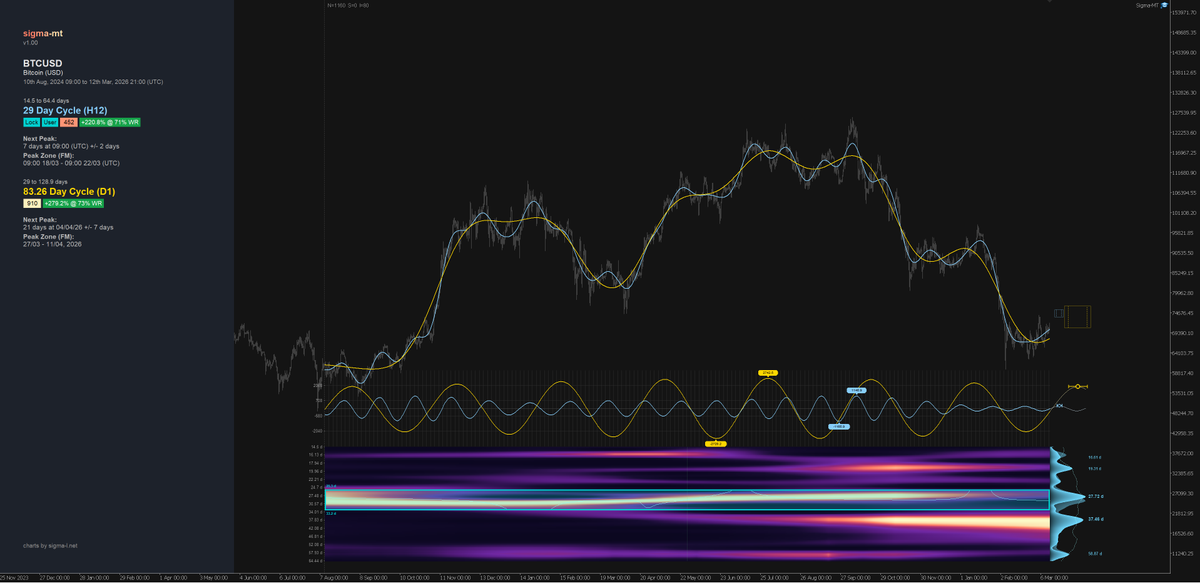
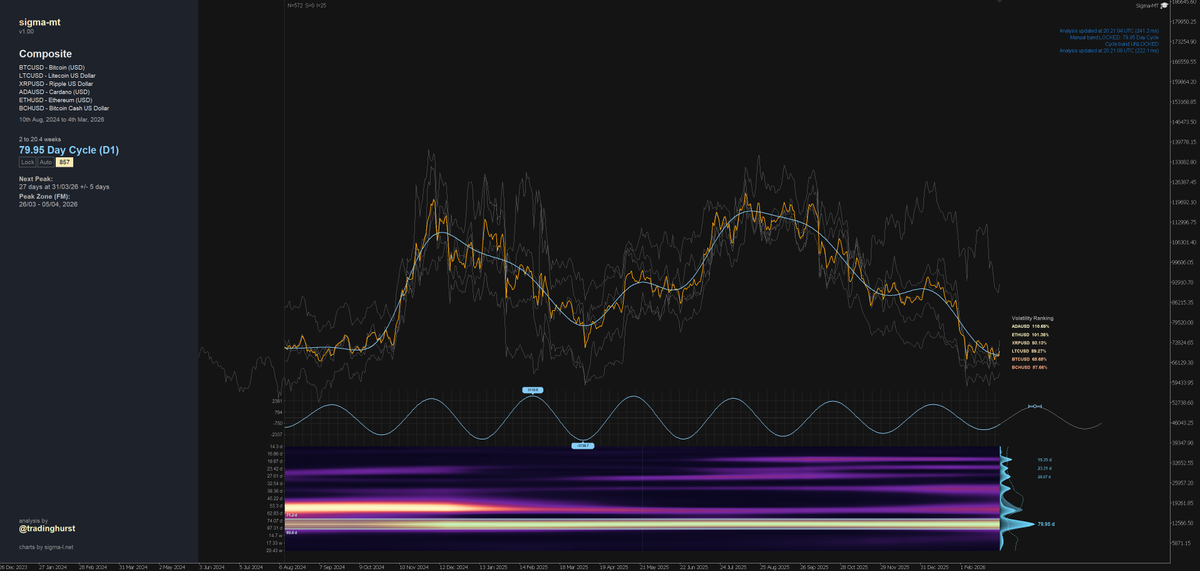
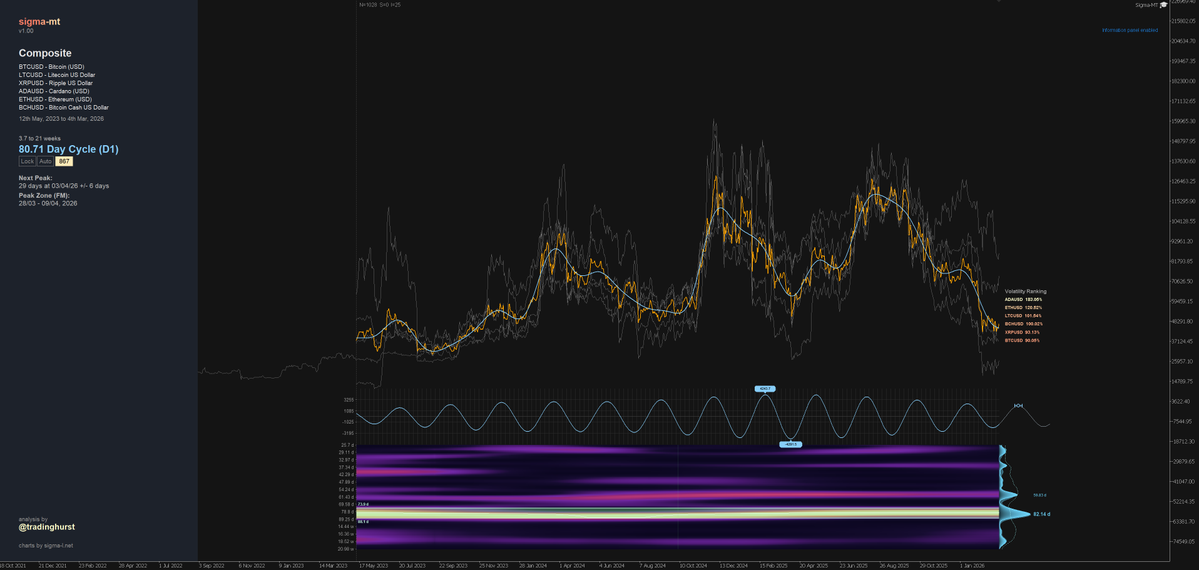
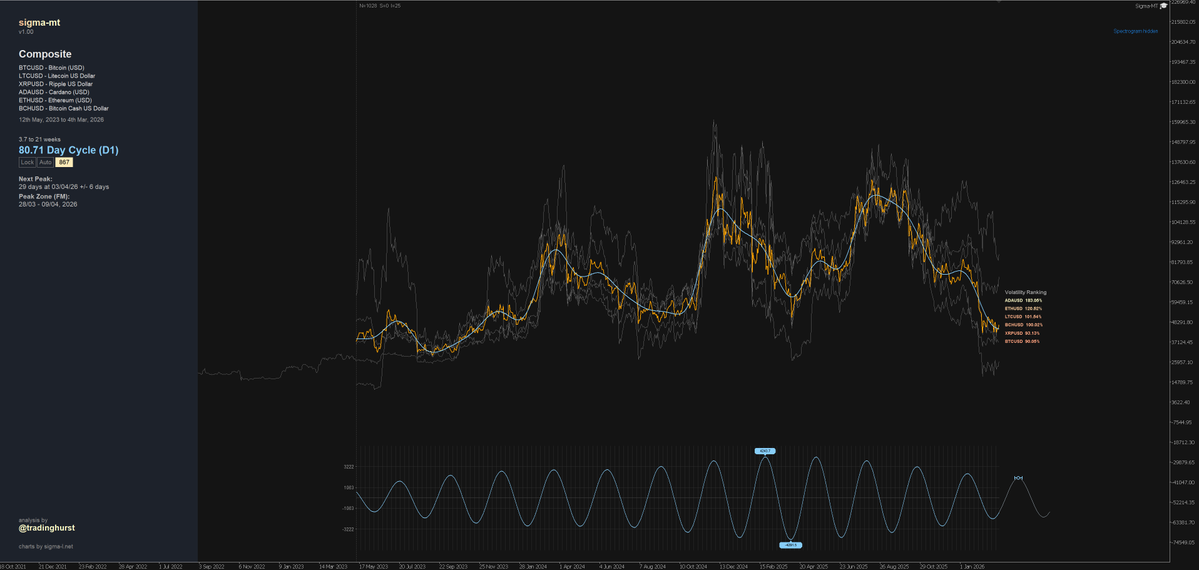
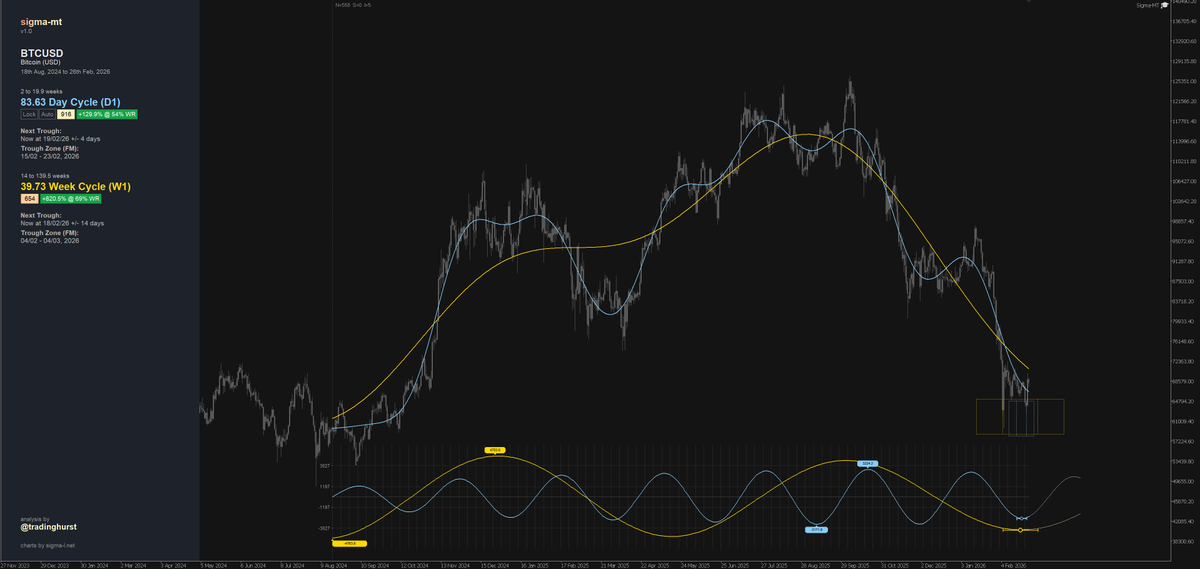
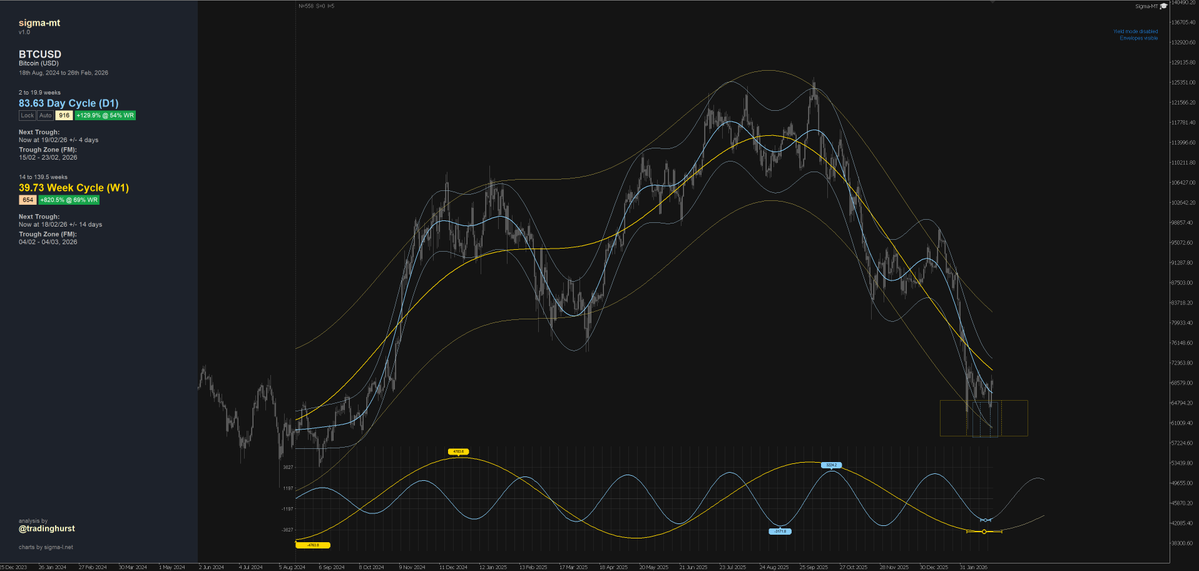
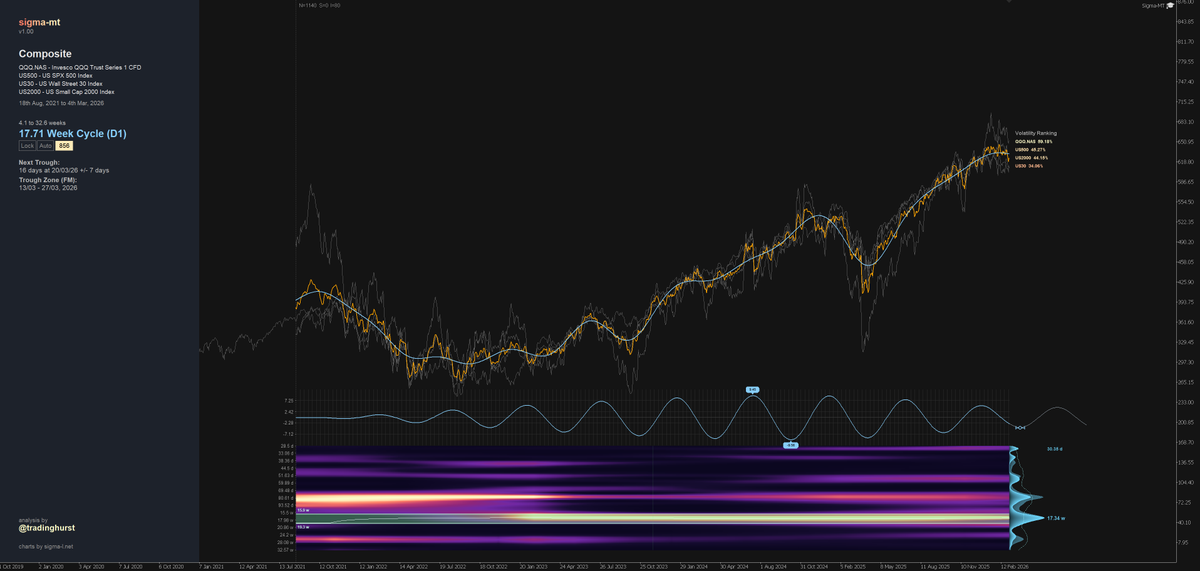
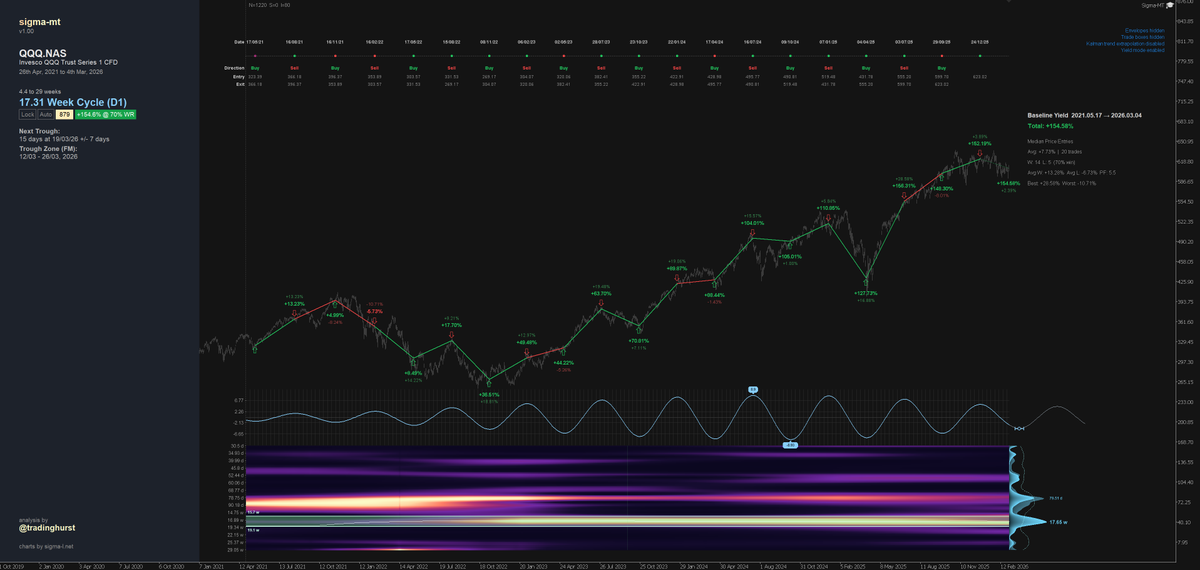
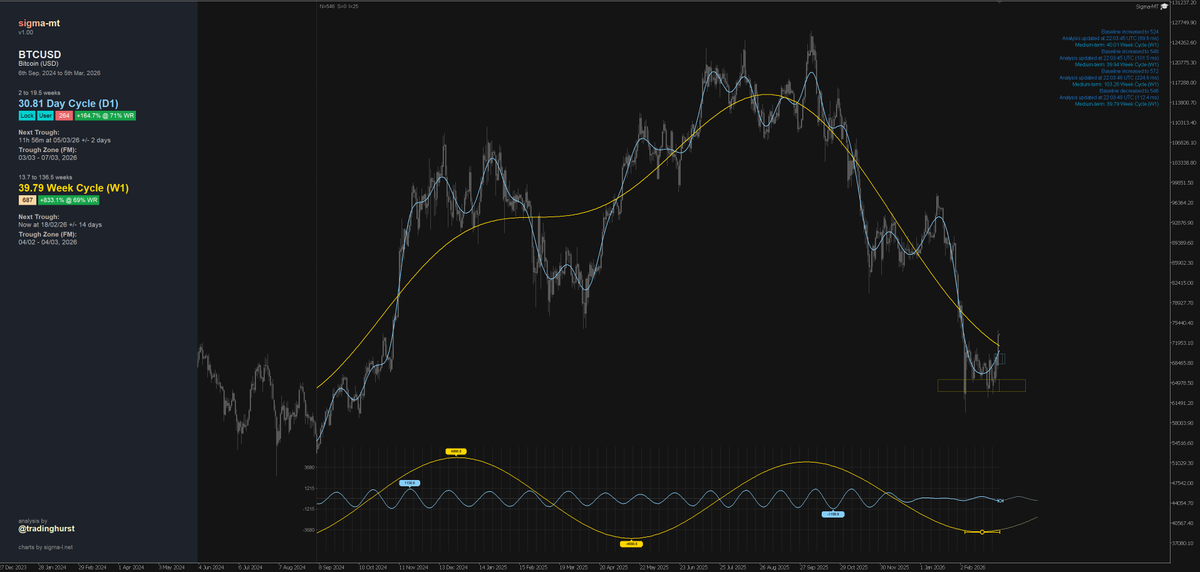
@AGratefulApe @stooninvestor @RyansMethod It is unknown AFAIK. I have heard rationalisations from herd mentality clustering to automated rhythms to planetary influence...! It's a fascinating area for speculation and great for marketing. Personally, I just measure.
English
1
0
1
41
Saad Ghazi
Saad Ghazi@AGratefulApe·
@stooninvestor @RyansMethod @TradingHurst I know and I like him a lot I'm just curious what the explanation is to why the Hurst frequencies. Normally it's just claimed that the frequencies exist but we don't know why. Ryan specifically claimed to know why in a vid.
English
1
0
1
26
Ryan Hogue
Ryan Hogue@RyansMethod·
Bitcoin/Gold has a habit… Backtest support → go parabolic We may be setting up for the next one📈
Ryan Hogue tweet media
English
10
17
138
5.2K
David F
David F@TradingHurst·
~ 80 day cycle in US stock market indices, troughing shortly. Below a composite of #spx, #djia, #russell2000 and #nasdaq (equivalents). Since 2022 -> bandwidth from ~ 3 to 20 weeks. Also Russell 2000 and Nasdaq in isolation.
David F tweet mediaDavid F tweet mediaDavid F tweet mediaDavid F tweet media
English
2
2
44
1.9K
David F
David F@TradingHurst·
@sanjayP25719358 It's not with my current broker unfortunately, you can run when you have the EA. I suspect it will be similar.
English
1
0
1
43
David F
David F@TradingHurst·
@xGremlin Possibly, give it another 8 years or so to avoid being fooled by randomness on this feature.
English
0
0
3
330
Xremlin
Xremlin@xGremlin·
You can call it a conspiracy, but... From 2017 high to 2021 high: 1430 days From 2021 high to 2025 high: 1431 days From 2017 high to bottom: 365 days From 2021 high to bottom: 365 days New cycle bottom: in 205 days New cycle high: in 1276 days Whether you like it or not, we still follow the $BTC 4-year cycle
English
56
102
735
155.6K
David F
David F@TradingHurst·
Current phase of the $BTC ~ 80 day cycle alongside the ~ 40 week feature. 80 day phase hard up and the 40 week starting to exert bullish influence. A quick look at the previously influential ~ 30 day (MOOOON) feature in the video. Now with almost no price correlation. Finally a selection of crypto across the 80 day cycle reveals a turgid move this far in the wider sector.
David F tweet media
David F tweet media
David F@TradingHurst

Bitcoin, such a thing of beauty at the moment. ~ 80 day cycle (blue) ~ 40 week cycle (yellow/gold) Also a video showing the emergence and modulation of the ~ 80 day cycle. Watch for the striking move to around 60 days and then back again! #timefrequency #bitcoincycles

English
1
1
41
3.9K
Blueprint Research
Blueprint Research@Blueprint_So9·
$BTC 3D Sun ☌ Saturn. Saturn's distance from Earth peaks March 25. ~10.49 AU. 🔭 Blueprint Ephemeris.
Blueprint Research tweet media
English
8
6
60
4.5K
David F
David F@TradingHurst·
@DeepJ__J I don't think you will. That dash is huge!
English
0
0
0
12
DeepJ_J
DeepJ_J@DeepJ__J·
@TradingHurst Got it, thanks for the chat — catch you next time! 😊
English
1
0
0
17
David F
David F@TradingHurst·
$BTCUSD at the 12 hour resolution and the death of the ~ 30 day cycle (blue) which began late last year. This feature, a mainstay of the price action over 2025 was beautiful for 20+ iterations since late 2024. Power modulation since then to a feature around 40 days. Spectra shown below at both early 2025 and late 2025 to compare. Ubiquitous ~ 80 day cycle also shown, in yellow. #bitcoincycles
David F tweet mediaDavid F tweet mediaDavid F tweet mediaDavid F tweet media
English
1
1
38
2K
David F
David F@TradingHurst·
@DeepJ__J I don't like it at all no, let it flow like Bitcoin's 80 day, resplendent and organic
English
1
0
0
18
DeepJ_J
DeepJ_J@DeepJ__J·
@TradingHurst BTC 12H cycles — 30 day blue killed off, power moving to 40 day feature. Early/late 2025 spectra show the transition. 80 day yellow persistent. Watching new dominant cycle. Key invalid if 30 day bounces back?
English
1
0
1
51
alezy_KCEX
alezy_KCEX@alezy_KCEX·
@TradingHurst Hey bro, would you be interested in a promotional collaboration with KCEX Exchange?
English
1
0
0
9
David F
David F@TradingHurst·
@leah_crypto The main advantage is the objective microscope it gives you into wide bands of frequencies across the market and how they change over time. Take the human guesswork out somewhat.
English
1
0
1
47
Leah
Leah@leah_crypto·
@TradingHurst Also when trading any of these Sigma generated cycles, this scanner is invaluable I bet as you may trade a few loosing trades due to lag but you'll see pretty quick when they cycle is weakening
English
1
0
1
26
David F
David F@TradingHurst·
Bitcoin, such a thing of beauty at the moment. ~ 80 day cycle (blue) ~ 40 week cycle (yellow/gold) Also a video showing the emergence and modulation of the ~ 80 day cycle. Watch for the striking move to around 60 days and then back again! #timefrequency #bitcoincycles
David F tweet mediaDavid F tweet media
English
13
8
121
11.9K
David F
David F@TradingHurst·
Ye olde #bitcoin holding steady with the influence from both the ~ 80 day and ~ 280 day (~ 40 week) cycle features pushing up. What is unknown (or at least uncertain to a degree approaching randomness) is larger features > 40 week and their influence. That said, the amplitude of the most recent 80 day leg was still quite handsome. A return up leg of similar amplitude with the additional bullish power of the 40 week would not be surprising to see. We roll on.
David F tweet mediaDavid F tweet mediaDavid F tweet media
English
3
2
48
1.9K
David F
David F@TradingHurst·
@loneharmonic Just gotta finish off a few bits then I'll think about it
English
1
0
0
16
Loneharmonic
Loneharmonic@loneharmonic·
@TradingHurst This looks awesome man. Is there any update on its release date?
English
1
0
1
15
David F
David F@TradingHurst·
An examination of the quite stationary ~ 160 day cycle (circa 15-16 weeks) in $TSLA over the last 7 years or so. Maintaining a tight bandwidth over this period, this cycle is a striking feature of this stock. Indicator/EA is Sigma-MT, soon to be available for Metatrader 5.
David F@TradingHurst

Eyes on $TSLA over the next few weeks as we approach the next trough of Elon's secret signal around 160 days wavelength. The current down leg has been flat, implying power from a larger component is pushing up, preventing any significant downturn. When combined with this smaller feature, we get happy bulls.

English
2
0
12
2.4K
David F
David F@TradingHurst·
@PocoyoBTC Assuming you have been through my timeline where I have posted hundreds of analyses and on the site sigma-l.net, then shortly I will be releasing an MT5 EA with all this bespoke detection goodness within. A little wait, therefore, for that.
English
1
0
1
22
David F
David F@TradingHurst·
In the US stock markets the cycle feature around 18 weeks (notionally the Hurst 20 week nominal wave) is one to watch with the most dominance across the band spanning 4 - 32 weeks. Also $QQQ yield shown in isolation over a similar period.
David F tweet mediaDavid F tweet media
English
3
0
30
1.7K
David F
David F@TradingHurst·
@D2Dubs I'm afraid the favourite amongst celestial fanciers has been crushed by the beastly 80 and 40 week cycles of late. So no, it has no power on the evidence, at the moment.
David F tweet media
English
0
0
0
168