The Trading Marvel®

21.5K posts

The Trading Marvel® banner
The Trading Marvel®

The Trading Marvel®

@TradingMarvel

Jai shree Balaji 🚩 Trader | Educator |MBA Helping traders become consistently profitable. • Price Action • Risk Management • No hype. No signals. Real edge.

india Katılım Eylül 2022
7 Takip Edilen73.8K Takipçiler
Sabitlenmiş Tweet
The Trading Marvel®
The Trading Marvel®@TradingMarvel·
11th Day of learning:- 📚 Stock Market Learning Series:- 🔍 Interest Coverage Ratio (ICR) Formula: Interest Coverage Ratio = EBIT ÷ Interest Expense What does it tell you? It measures how easily a company can pay the interest on its debt using its operating profit. Quick Guide: 🟢 > 5 → Excellent financial strength 🟢 3–5 → Healthy & comfortable 🟡 1.5–3 → Needs monitoring 🔴 < 1.5 → High financial risk Example: EBIT = ₹500 Cr Interest Expense = ₹100 Cr ➡️ ICR = 5 This means the company earns 5 times its annual interest obligation, indicating a strong ability to service its debt. 💡 Investor Tip: Never judge a company only by profit. A business with high debt and a low Interest Coverage Ratio can face financial stress during tough economic periods. #LearnWithTTM
The Trading Marvel®@TradingMarvel

10th day of learning:- 📚 Stock Market Learning Series – EV/EBITDA EV/EBITDA is one of the best ratios to judge whether a company is cheap or expensive by considering both its debt and cash. Formula: EV/EBITDA = Enterprise Value ÷ EBITDA Where: ✅ EV (Enterprise Value) = Market Cap + Total Debt − Cash ✅ EBITDA = Earnings Before Interest, Taxes, Depreciation & Amortization How to Interpret: 🟢 Below 10 → Generally Attractive / Undervalued 🟡 10–15 → Fairly Valued 🔴 Above 15 → Expensive (analyze carefully) Example: EV = ₹10,000 Cr EBITDA = ₹1,000 Cr EV/EBITDA = 10 💡 Golden Rule: Use EV/EBITDA to compare companies within the same industry. Never rely on a single ratio—combine it with ROE, ROCE, D/E, PEG, and Revenue & Profit Growth for better investment decisions. #TheTradingMarvel

English
0
0
42
11.5K
The Trading Marvel®
The Trading Marvel®@TradingMarvel·
Can’t ignore the last two candles in #IEX suggesting a potential upside. SL below this month’s low.
The Trading Marvel® tweet media
English
4
7
147
19.7K
Mayank Gala
Mayank Gala@Galamayank17·
@TradingMarvel Boss ...shall addup avantel for averaging...or hold with existing quantity..if free will be greatful for ur rly
English
1
0
0
32
The Trading Marvel®
The Trading Marvel®@TradingMarvel·
10th day of learning:- 📚 Stock Market Learning Series – EV/EBITDA EV/EBITDA is one of the best ratios to judge whether a company is cheap or expensive by considering both its debt and cash. Formula: EV/EBITDA = Enterprise Value ÷ EBITDA Where: ✅ EV (Enterprise Value) = Market Cap + Total Debt − Cash ✅ EBITDA = Earnings Before Interest, Taxes, Depreciation & Amortization How to Interpret: 🟢 Below 10 → Generally Attractive / Undervalued 🟡 10–15 → Fairly Valued 🔴 Above 15 → Expensive (analyze carefully) Example: EV = ₹10,000 Cr EBITDA = ₹1,000 Cr EV/EBITDA = 10 💡 Golden Rule: Use EV/EBITDA to compare companies within the same industry. Never rely on a single ratio—combine it with ROE, ROCE, D/E, PEG, and Revenue & Profit Growth for better investment decisions. #TheTradingMarvel
The Trading Marvel®@TradingMarvel

9th day of learning:- 📚 Stock Market Learning Series – PEG Ratio PEG Ratio (Price/Earnings to Growth) helps you know whether a stock’s valuation is justified by its future growth. Formula: PEG = P/E Ratio ÷ EPS Growth Rate (%) ✅ PEG < 1 → Potentially Undervalued ✅ PEG = 1–1.5 → Fairly Valued 👍 ⚠️ PEG > 2 → May be Overvalued Example: P/E = 20 | EPS Growth = 25% PEG = 0.8 ✅ Golden Rule: Never buy a stock based only on P/E. Always check PEG + ROE + ROCE + D/E + Sales & Profit Growth before investing.

English
1
1
51
20.4K
The Trading Marvel®
The Trading Marvel®@TradingMarvel·
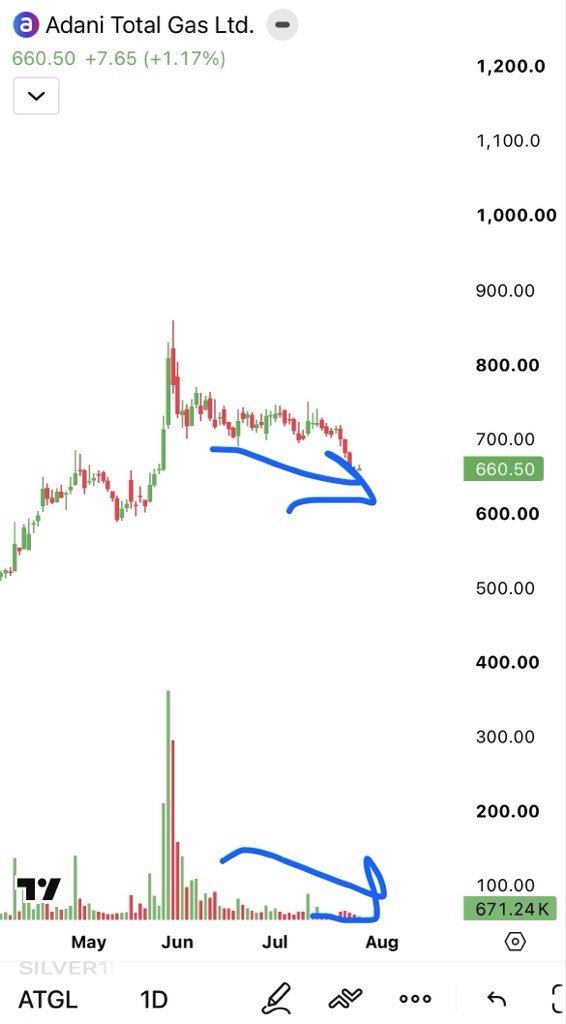
Adani total gas low selling volume with fall indicating reversal soon…” Must hold … Cmp—660
The Trading Marvel® tweet media
English
9
7
176
23.4K
The Trading Marvel®
The Trading Marvel®@TradingMarvel·
9th day of learning:- 📚 Stock Market Learning Series – PEG Ratio PEG Ratio (Price/Earnings to Growth) helps you know whether a stock’s valuation is justified by its future growth. Formula: PEG = P/E Ratio ÷ EPS Growth Rate (%) ✅ PEG < 1 → Potentially Undervalued ✅ PEG = 1–1.5 → Fairly Valued 👍 ⚠️ PEG > 2 → May be Overvalued Example: P/E = 20 | EPS Growth = 25% PEG = 0.8 ✅ Golden Rule: Never buy a stock based only on P/E. Always check PEG + ROE + ROCE + D/E + Sales & Profit Growth before investing.
The Trading Marvel®@TradingMarvel

8th Day of Learning:- Current Ratio The Current Ratio measures a company’s ability to pay its short-term liabilities using its short-term assets. Definition:- Current Ratio = Current Assets ÷ Current Liabilities Easy example:- * Current Assets = ₹200 crore * Current Liabilities = ₹100 crore Current Ratio = 200 ÷ 100 = 2.0 This means the company has ₹2 of current assets to pay every ₹1 of short-term liabilities. Why is the Current Ratio important? * Shows the company’s short-term financial strength. * Indicates whether it can pay bills, suppliers, and other obligations due within one year. * A healthy current ratio reduces the risk of liquidity problems. What is a good Current Ratio? * 1.5 – 2.5 → Excellent ⭐⭐⭐⭐⭐ * 1.2 – 1.5 → Good ⭐⭐⭐⭐ * 1.0 – 1.2 → Acceptable ⭐⭐⭐ * Below 1.0 → Warning sign ⚠️ (the company may struggle to meet short-term obligations) Important point:- A very high Current Ratio (above 3) isn’t always a good sign. It can indicate the company is holding too much idle cash or inventory instead of using its assets efficiently. Rule for long-term investing Look for companies with: * ✅ Current Ratio above 1.5 * ✅ Low Debt-to-Equity (D/E) Ratio * ✅ Strong ROE and ROCE * ✅ Consistent sales and profit growth Simple way to remember:- * Current Ratio > 1 = Company can generally pay its short-term debts. * Current Ratio < 1 = Company may face short-term liquidity issues. * Current Ratio around 2 = Often considered a healthy balance.

English
2
0
68
23K
The Trading Marvel®
The Trading Marvel®@TradingMarvel·
Nifty Outlook for Today 📈 We opened on a positive note. However, remember the old-school market saying: "The first jump is usually sold into." So don't get carried away by the opening strength. Expect an initial sell-off or profit booking, and once that phase is absorbed, the market is likely to resume its move higher towards 25,000. Stay patient. Let the opening volatility settle before judging the day's trend.
English
6
1
90
10.2K
The Trading Marvel®
The Trading Marvel®@TradingMarvel·
🪔 DIWALI STOCK PICKS 2026✨ This fall is a big opportunity; don’t miss or hesitate… it’s the market’s way. Potential Upside by Deepawali 2026 & Deepawali 2027 (Expected Scenario) 🟢 Jindal Drilling 🎯 Up to 20% (Deepawali 2026) | 60% (2027) 🟢 Anant Raj Ltd. 🎯 Up to 15% (Deepawali 2026) | 90% (2027) 🟢 Vimta Labs 🎯 Up to 20% (Deepawali 2026) | 70% (2027) 🟢 Nitin Castings 🎯 Up to 30% (Deepawali 2026) | 60% (2027) 🟢 Indian Energy Exchange (IEX) 🎯 Up to 80% (2027) 🟢 Graphite India 🎯 Up to 80% (2027) 🟢 C.E. Info Systems (MapmyIndia) 🎯 Up to 70% (2027) 🟢 Gravita India 🎯 Up to 20% (Deepawali 2026) | 70% (2027) Bookmark this!
English
28
66
635
79.3K
The Trading Marvel®
The Trading Marvel®@TradingMarvel·
NIFTY Outlook for Tomorrow (27 July 2026) Bias: Neutral to mildly bullish at the open, but expect volatility through the session. Support: 23,800–23,850 Resistance: 24,000–24,100 Strong breakout: Sustaining above 24,100 could trigger a move toward 24,250–24,350. Breakdown: A close below 23,800 may increase selling pressure toward 23,650–23,500.
English
6
5
149
19.6K