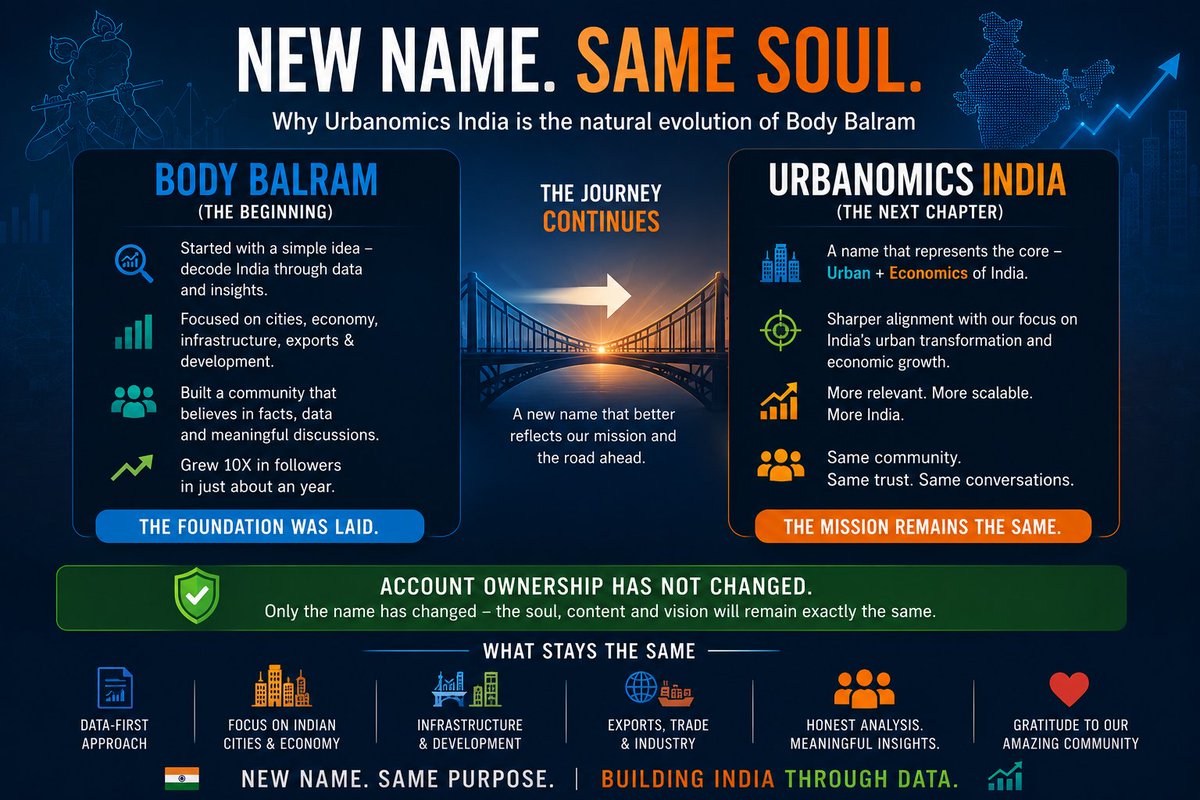
Sabitlenmiş Tweet
Urbanomics India
8.8K posts

Urbanomics India
@Urbanomics_IN
Formerly Body Balram. Cities • Economy • Infrastructure • Growth Independent analysis of India's urban economy. Not affiliated with any Urbanomics companies
India Katılım Ocak 2019
661 Takip Edilen3.7K Takipçiler

@InspireeMilions That tweet is applicable for only for Chennai.
English

@Urbanomics_IN Again who told you that STPI is usually preferred by startups, mid-sized firms or domestic firms??Many office parks in localities of Balewadi, Baner, Viman Nagar, Yerwada, KP, Kalyani Nagar, Wakad, Shivaji Nagar in Pune are outside SEZ and leased for Global & Fortune 500 firms.
English

@Urbanomics_IN Can we get total IT exports for top 20 indian cities ? Sez + stpi
English


@john_prabhakar Pune STPI centre is the parent stpi of all stpi sub-centres located in Maharashtra just like Chennai in Tamil Nadu.
English

@Urbanomics_IN Tier 2 cities are not child cities of tier 1 cities. Pune started off as a Tier 2 city, but now is Tier 1 city. The software exports from Pune are more than Mumbai fyi.
English

@Urbanomics_IN West TN has such a m8x of all three sectors that result in diversified economy. There are urban hubs plus scenic villages.
One question, do Ooty figures include Coonoor too? If it's only Ooty municipality, can assume >90% of the figure correspond to tourism sector.
English

West Tamil Nadu’s strength lies in its balanced urban network.
Coimbatore, Tiruppur, Erode, Salem, Namakkal, Karur, Rasipuram and other towns together create one of India’s most diversified regional economies with strong industrial depth, trade strength and economic resilience.

Urbanomics India@Urbanomics_IN
North Tamil Nadu’s economy appears less diversified mainly due to Chennai’s overwhelming scale. The megacity alone contributes over 30% of Tamil Nadu’s GDP, overshadowing strong secondary hubs like Hosur, Vellore, Ranipet, Ambur, Krishnagiri & Tiruvannamalai.
English

How much does population estimation change district prosperity rankings?
@Urbanomics_IN estimates reduce KTCC per capita GDP from ₹6.59L-govt to ₹5.80L due to higher suburban population estimates.
Despite debate over Chennai & Nilgiris, most districts align with ground reality.

Urbanomics India@Urbanomics_IN
What is the true population of Chennai? Govt implied KTCC population is 12.9M, while @Urbanomics_IN estimates 14.7M, broadly aligning with CUMTA projections. Despite debate over Chennai & Nilgiris, most fast-growing districts appear closer to ground reality amid census absence.
English

What is the true population of Chennai? Govt implied KTCC population is 12.9M, while @Urbanomics_IN estimates 14.7M, broadly aligning with CUMTA projections. Despite debate over Chennai & Nilgiris, most fast-growing districts appear closer to ground reality amid census absence.

English

@Urbanomics_IN Very true. DDP is the only officially available data. Again city level estimate is difficult as many cities have huge urban agglomeration outside their LSGD boundaries. Also there will be many contiguous LSGDs. In many cases the official UA limit maynot cover the entire area.
English

@Urbanomics_IN Best wishes bro
Just now saw this post. Big fan of your work ❤️
English


