Sabitlenmiş Tweet

VWAP, rolling VWAP 🔴 long BUT useful.
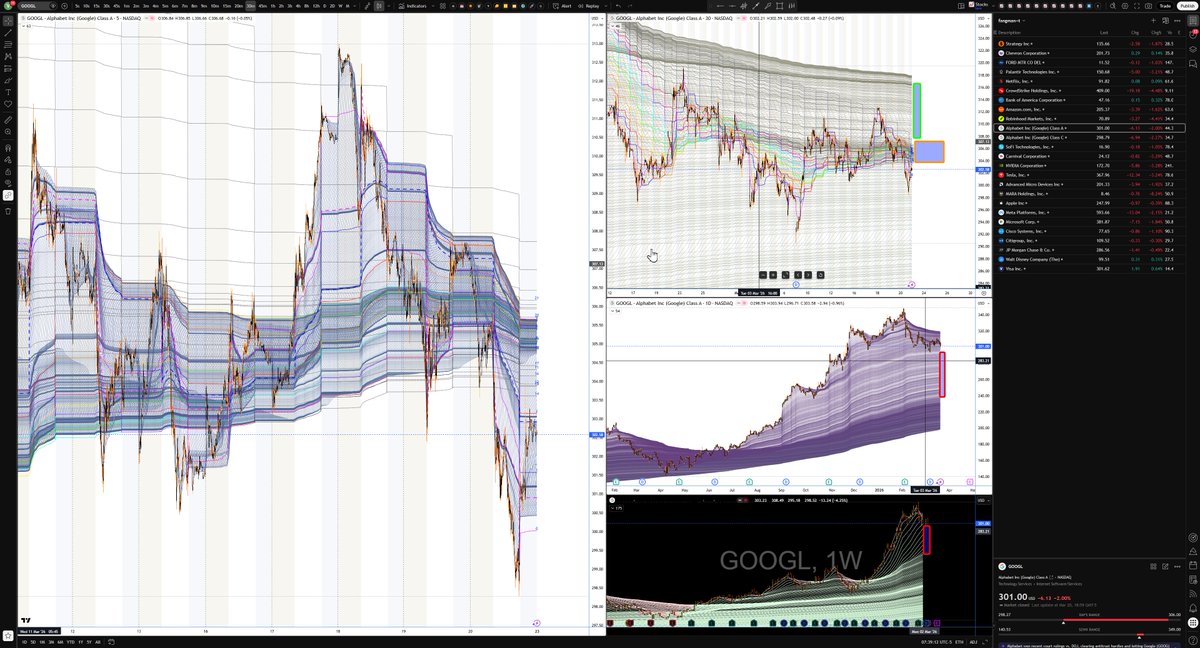
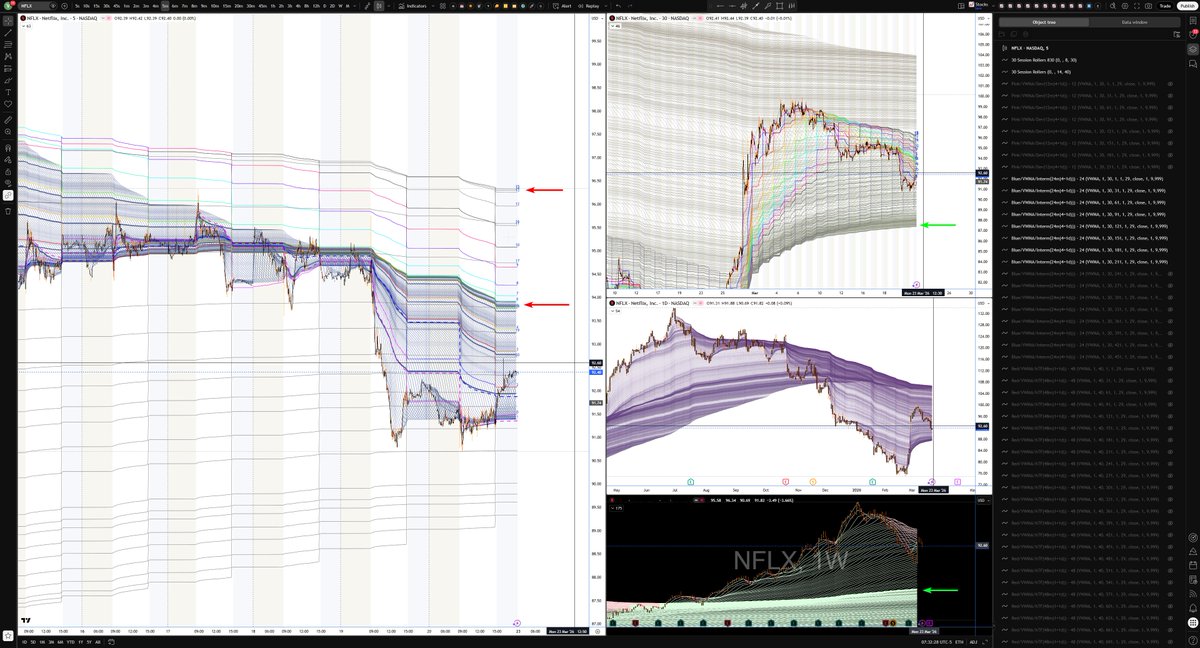
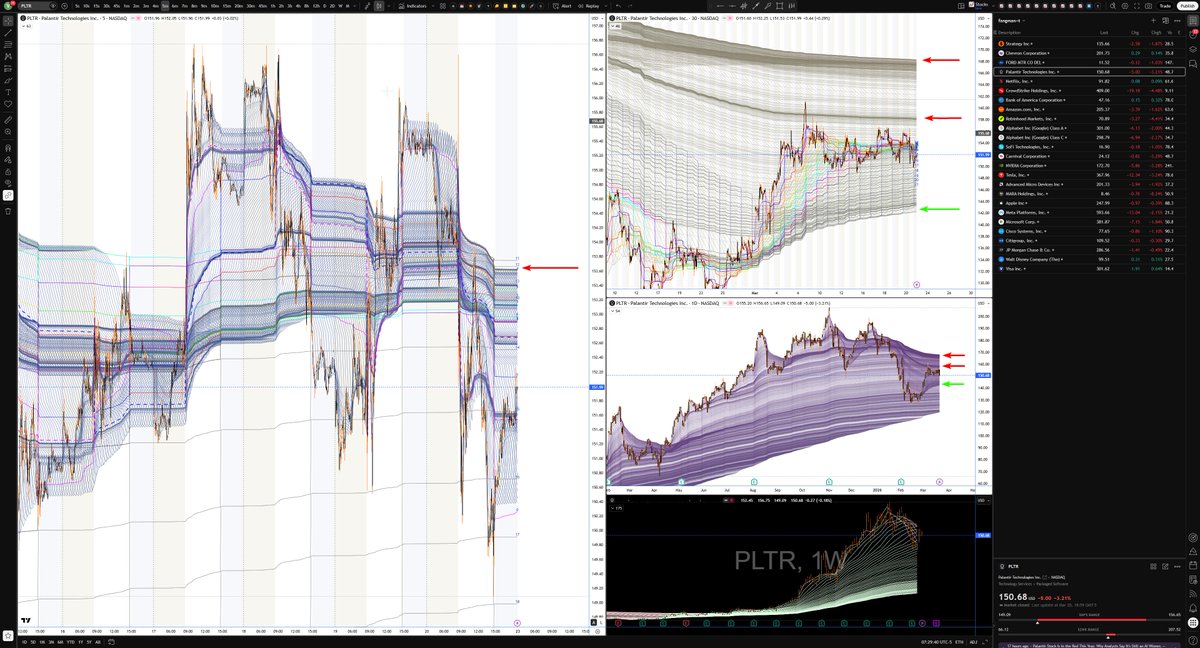
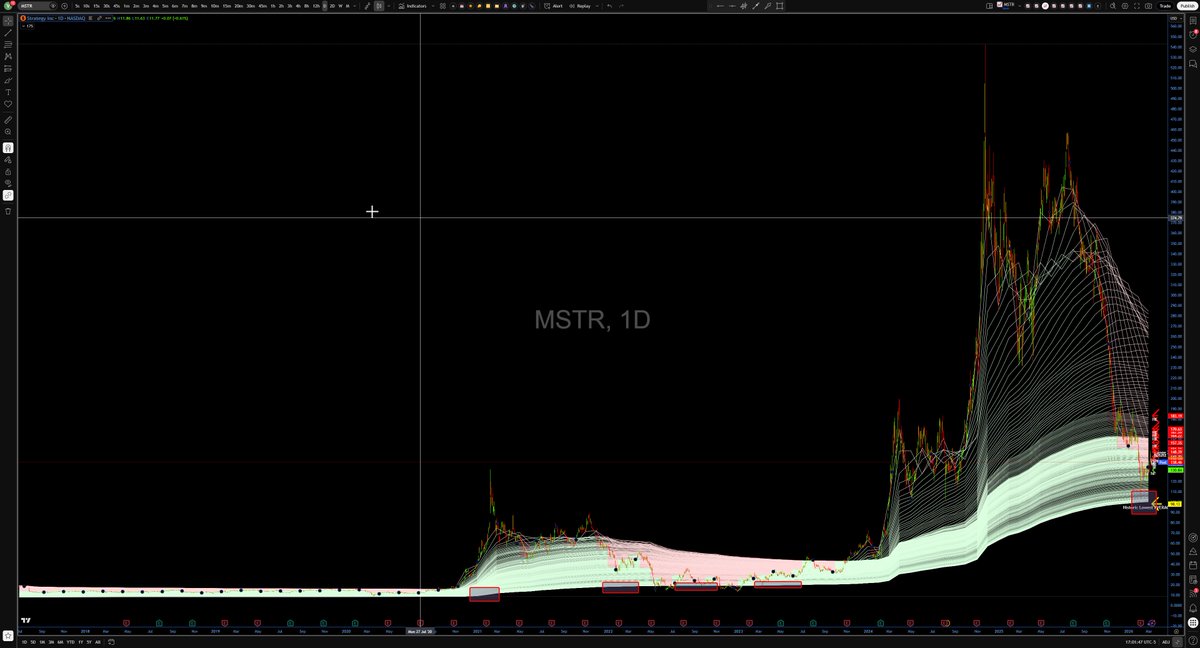
🔴Each of the grey lines is a a session vwap from a previous day. They consolidate in sideways price action (red rectangles) and spread out in trending markets. The consolidations become upside and downside targets for new price exploration. The numbers on the right margin are the number of days back the vwap originated.
We can see that a lower edge has been built out and tested 6 times nearly to the penny the last 3 times.
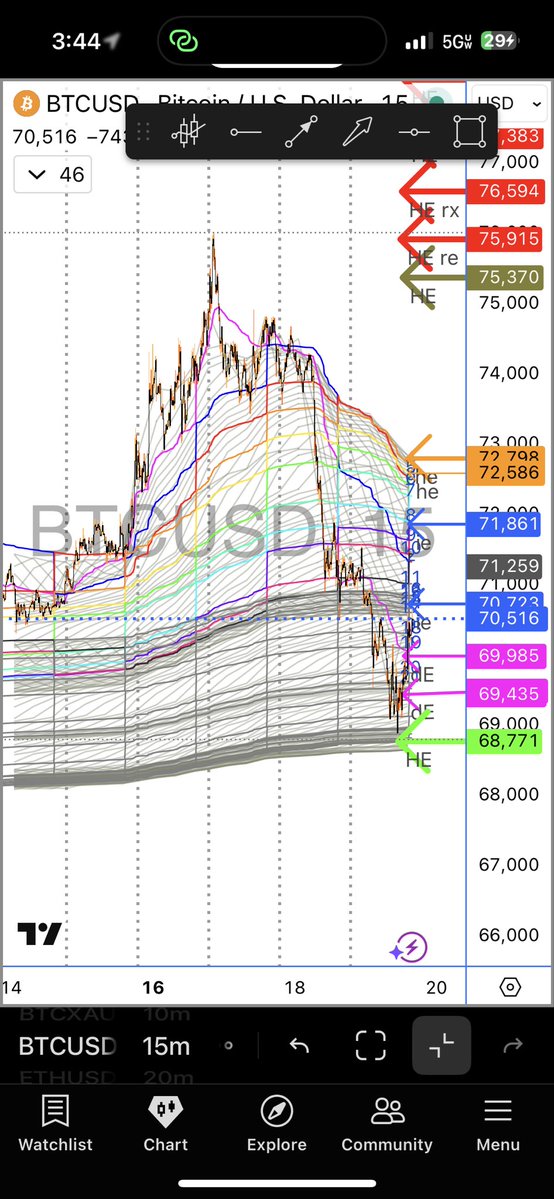
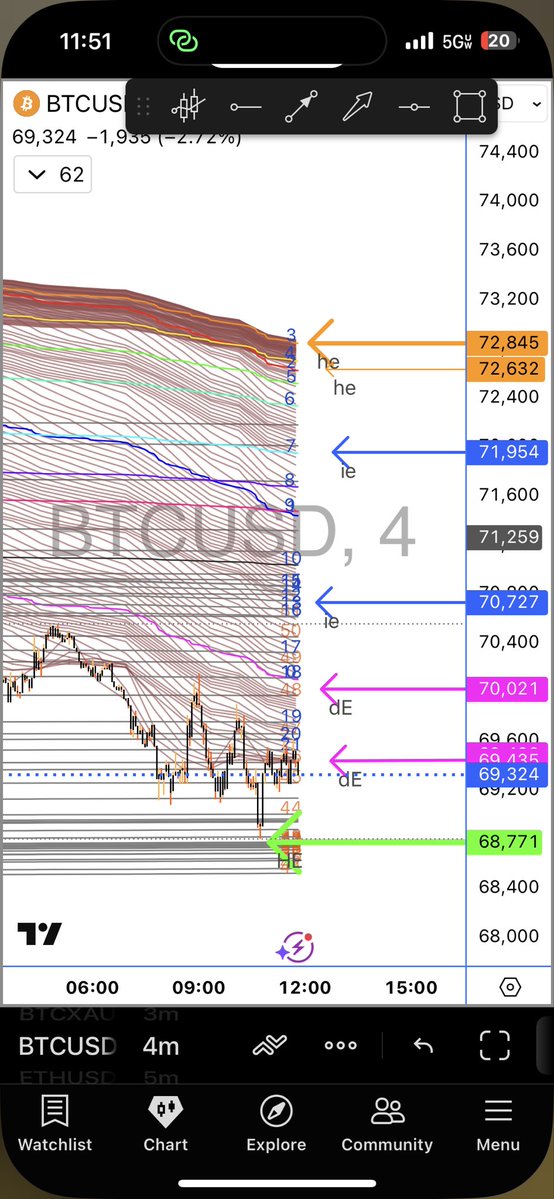
The pink and blue shaded vwaps are rolling vwaps of intraday price action. They create intraday entry and exit opportunities in the context of the higher time frames. In the historic time frame they are irrelevant but they are excellent for alignment in higher time frames if timing is your goal.
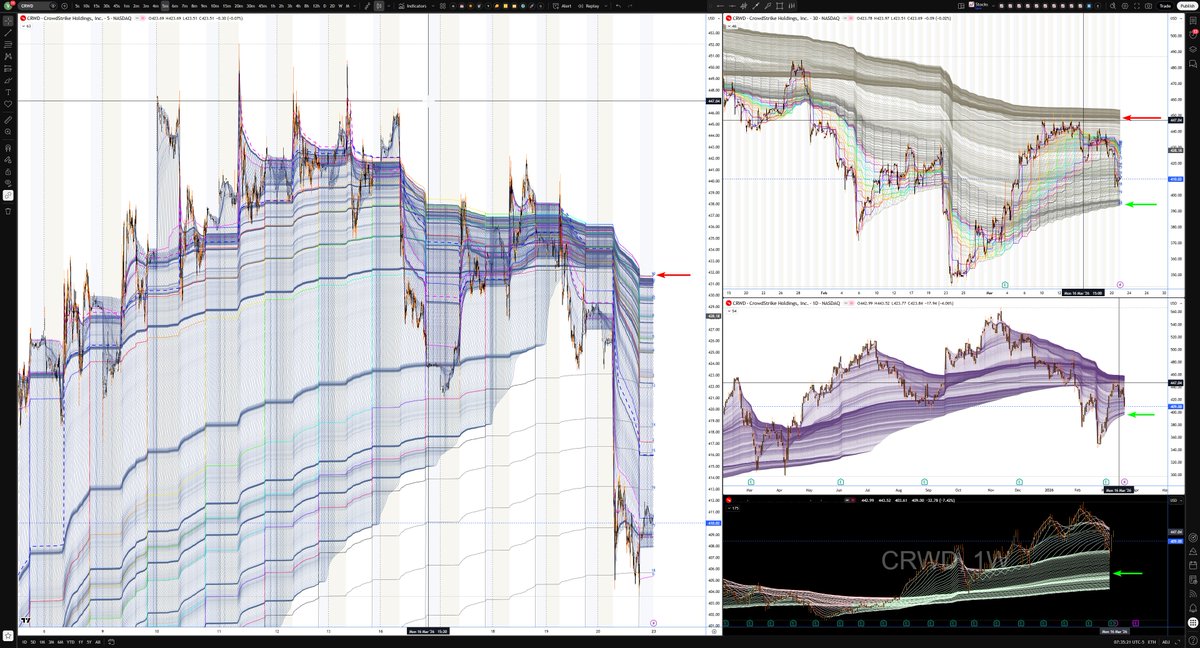
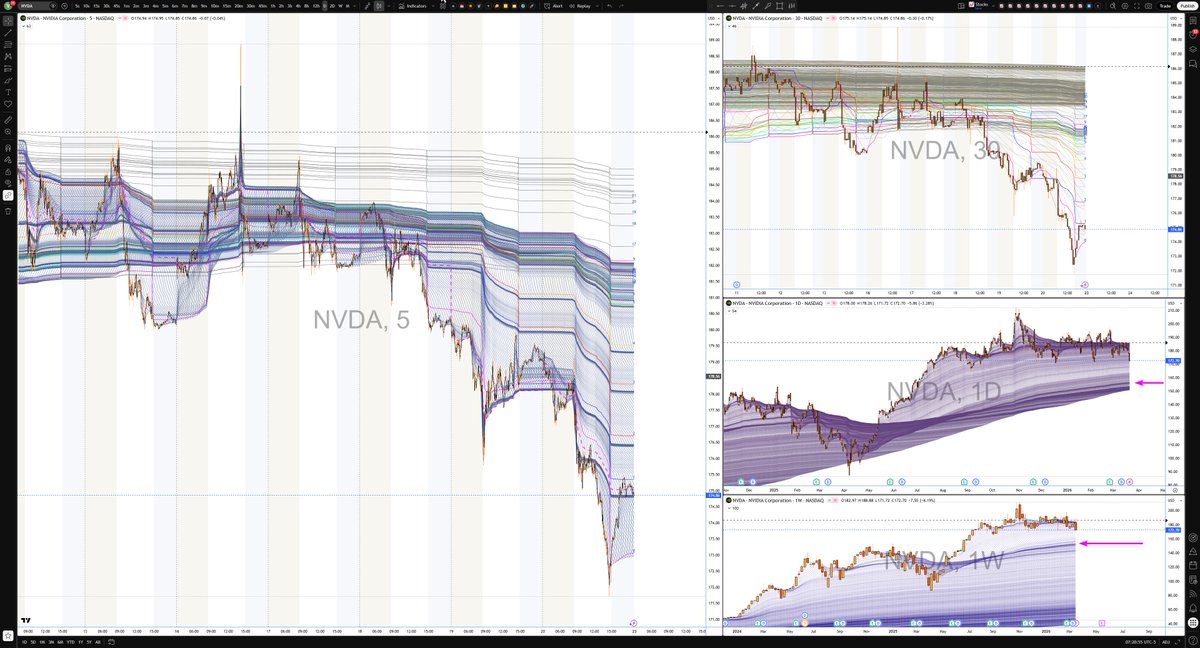
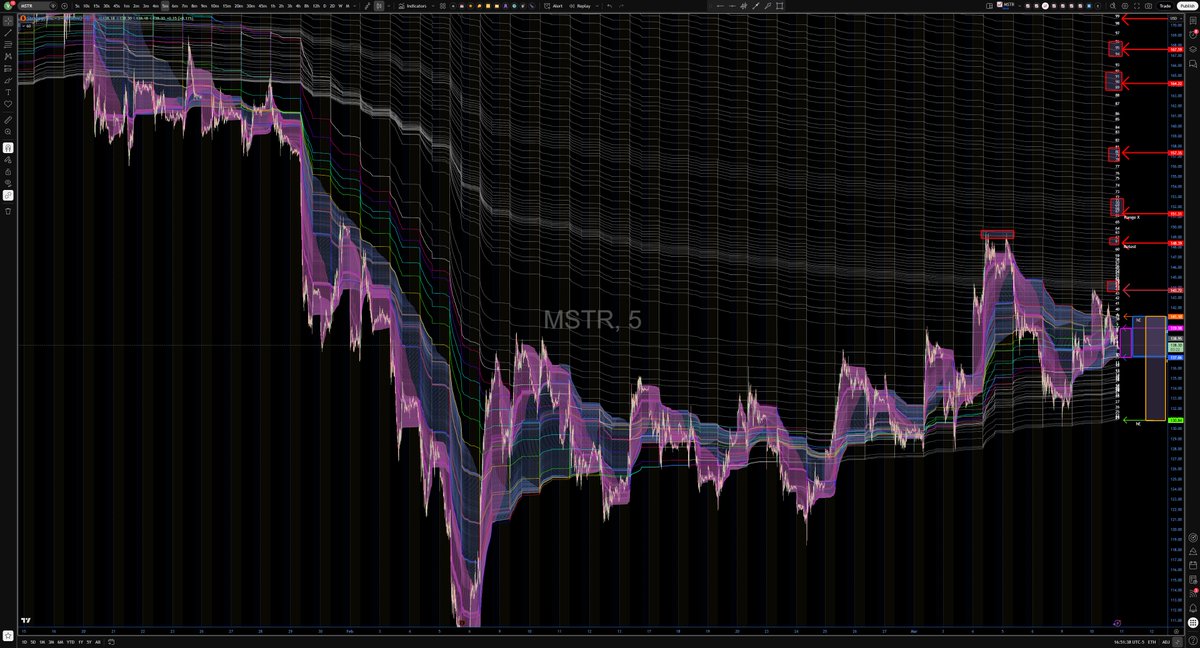
🔴The next screen shot is a set of rolling vwap (green and red), each 1 week in time. We have here a coarse history of all price action. What I find useful here is that the market has come back to the lowest average pride of all participants in all of MSTRs history. Think, the market has gobbled up all the low hanging fruit (liquidity). Below where there are no vwaps, there is very little liquidity. When the market came down to the 100 level many traders thought whole number blah blah blah, I knew that the market being efficient, simply force capitulation and ate the liquidity.
🔴So what we have seen here is the market cleaning out all the stops and low hanging liquidity in the historic time frame and if you go back to the previous screen shot, in the near time frame ie, back to about 24 days. New longs that came in without conviction were cleaned out and the money took advantage of new buyers stops to add to their positions.
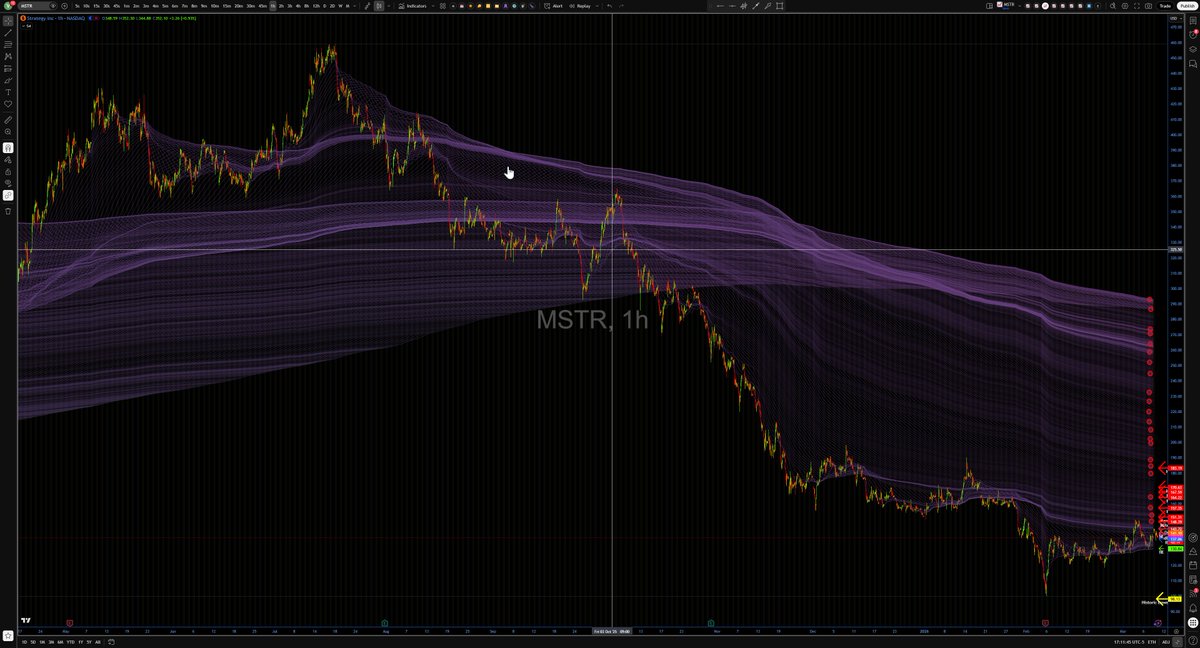
🔴 this last screen shot is of the purple vwaps. Each vwap here is a rolling vwap of 1 day. The areas where vwaps are seperated by black space are days where the market trended and the areas where there is consolidation of closely spaced or intertwined vwaps are are was a battle of buyers and sellers. Each vwap individually shows the average position from that day, but each consolidation shows the average position from a period of days or even weeks. When the market is trending, weaker hands pile in and push the market, the black spaces will be moved through quickly and the consodiations will be more challenging. At the top of the chart there is an edge at 290-. this is the average position of all participants in the market since prior to ATHs. In the same way that the edge in the green and red chart is relevant, so is this 290 edge. If the market is going to go down, an efficient market will clear out all the weak shorts, gobble of the liquidity before heading back south.
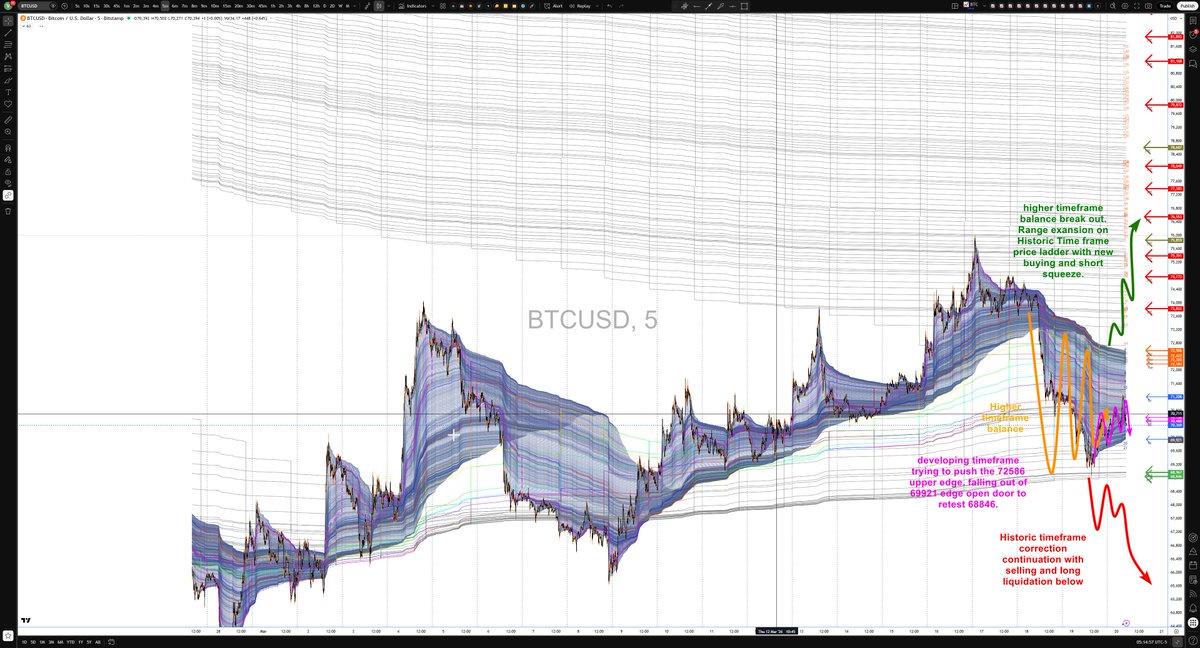
🔴THESE edges are what I call sandboxes. there are infinite sandboxes but I try to stay aware of the extremes. IMO buying the 100 edge of the week rolling vwaps was a generational buy opportunity. In the very least it should try to push the 290 edge, fill the sandbox. If you believe in bitcoin and I do, then it should pop the top off of that edge where we will see a massive short squeeze. This can take weeks months or years but it is IMO done going down and transitioned to a sideways to up market unless we fall out of the 100 edge below.
🔴 This is not theory. VWAPs as I use them are effective in any market with liquidity, any time frame down to the micro. If you made it this far, go back and re read my post, check out the screen shots and fire away you questions. If you have ticker you want to look at let me know and id happily share my thoughts.
Peace and happy trading.
English