VividCharts

517 posts

VividCharts banner
VividCharts

VividCharts

@vividcharts

VividCharts works in #ServiceNow to visualize and present real-time data for easy reporting. ServiceNow Elite Technology Partner | 2019 CreatorCon Champions

Lexington, KY Katılım Eylül 2017
317 Takip Edilen355 Takipçiler
VividCharts
VividCharts@vividcharts·
The perfect reporting storm is upon us: end of month, end of quarter and the 4th of July holiday. Make this the last holiday weekend you spend manually reporting. 
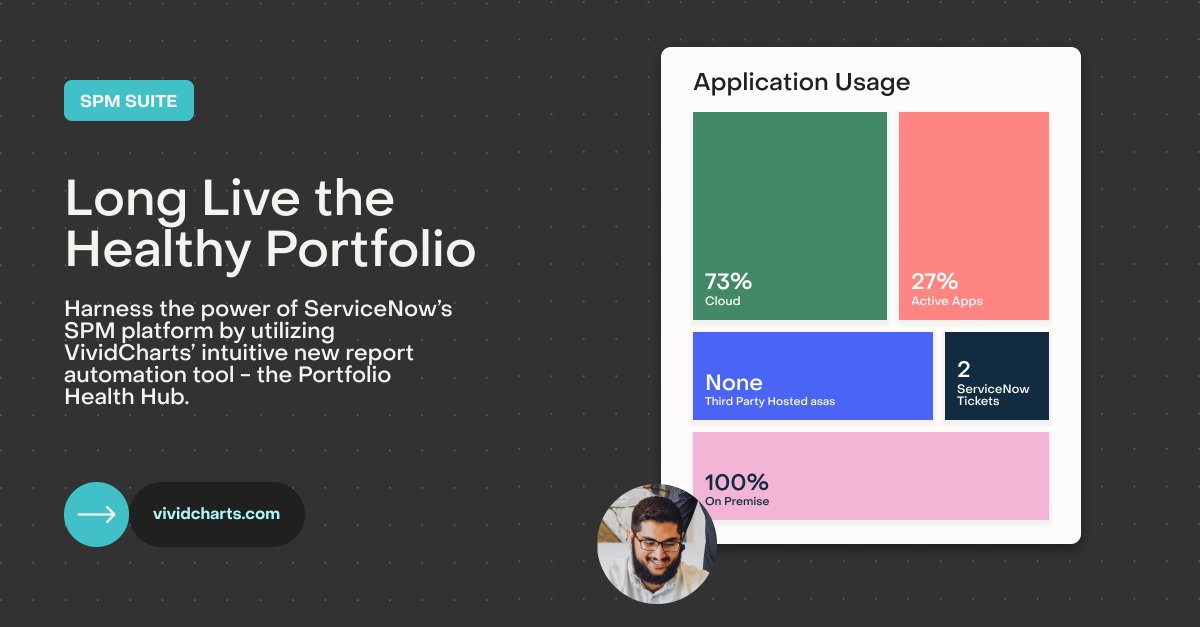
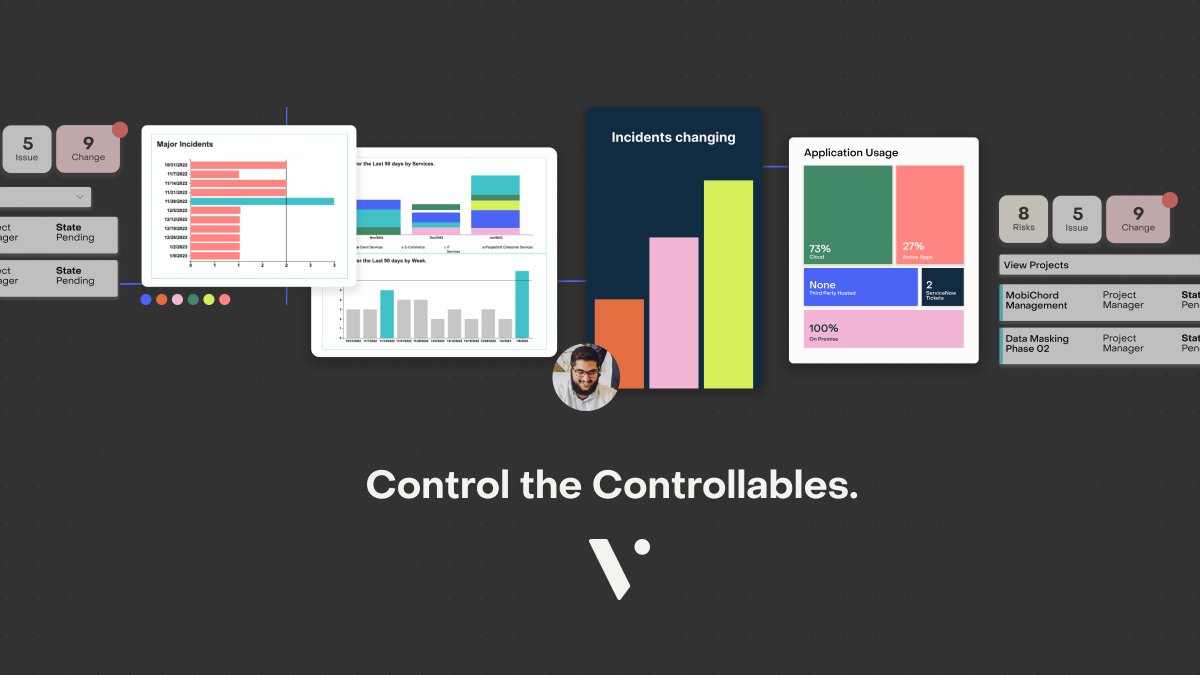
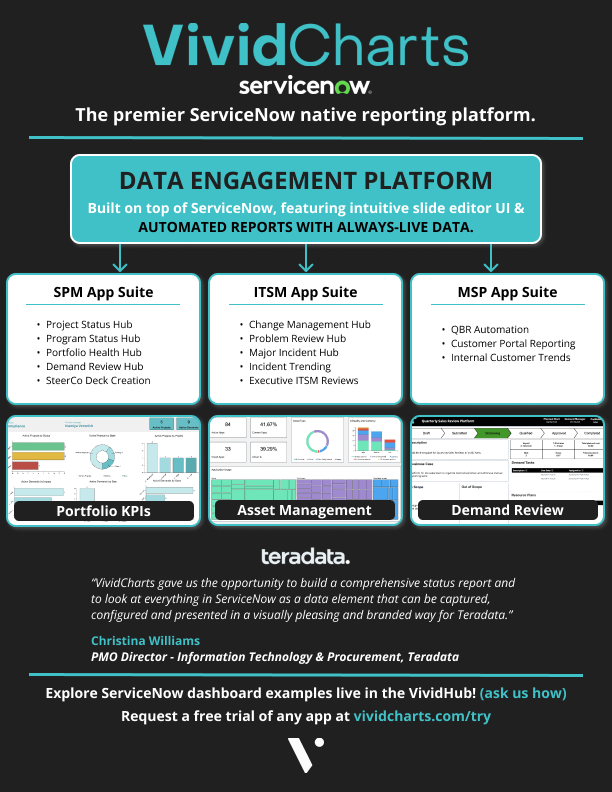
@vividcharts automates operational @ServiceNow reporting. Give us a call anytime, we are here for you! #AOR
VividCharts tweet media
English
0
0
0
118
VividCharts
VividCharts@vividcharts·
STOP making @ServiceNow operational reporting harder than it should be. Join @vividcharts tomorrow for our Automated Operational Reporting workshop and learn how enterprise customers are maximizing the tools in their data operations architecture. hubs.ly/Q01ThF_n0
VividCharts tweet media
English
0
1
1
95
VividCharts
VividCharts@vividcharts·
LIVE @vividcharts WORKSHOP NEXT WEEK! If you want to learn how to automate your @ServiceNow manual reports, join us on Wednesday June 14th at 11am ET, 9am PT for our Automated Operational Reporting playbook. Register here: hubs.la/Q01SkKpr0
VividCharts tweet media
English
0
0
0
70
VividCharts
VividCharts@vividcharts·
Are you done with busy work? Let @vividcharts take @ServiceNow reporting off your plate - automate your operational reports live, in-platform and eliminate excessive resource costs spent on manual reporting. Connect with us at Knowledge next week for a live demo! Booth #502
VividCharts tweet media
English
0
0
0
70
VividCharts
VividCharts@vividcharts·
Would you use your grandfather's projector to give an important presentation? Then how is PowerPoint still deemed the best tool to create status reporting with ServiceNow data? If you're coming to Knowledge, come see us at booth #502! #know23 #ServiceNow #VividCharts
VividCharts tweet media
English
0
1
1
76
VividCharts
VividCharts@vividcharts·
Are you fed up with the amount of prep time it takes to report on your @ServiceNow project portfolio? @vividcharts can help with automating your operational reporting. And providing more cat memes, if that is what will help. Catch us at Knowledge next week! Booth #502 #know23
VividCharts tweet media
English
0
0
1
61
VividCharts
VividCharts@vividcharts·
Are you fed up with the amount of prep time it takes to report on your @ServiceNow project portfolio? An example calculation looks like this: - 115 projects - Weekly status reports (52x/yr) - 1 hour spent per report - $100/hr in cost ~6,000 HOURS, $600K in ANNUAL WASTE
VividCharts tweet media
English
0
0
0
63
VividCharts
VividCharts@vividcharts·
Come burn the house down at Knowledge with us! #know23 If you work in @ServiceNow and like to have fun (i.e. your idea of a good time is not building manual reports all day), come see us at Booth #502 on the expo floor to play a game! Are you ready? #vividcharts #AOR
VividCharts tweet media
English
0
0
1
69
VividCharts
VividCharts@vividcharts·
Let the games begin. What kind of game can you play without cards, tickets or poker chips? Come see us at booth #502 on the expo floor at @ServiceNow's Knowledge conference to play an eco-friendly game and a chance to win some amazing prizes! #servicenow #know23 #vividcharts
VividCharts tweet media
English
0
0
1
102
VividCharts
VividCharts@vividcharts·
Control the controllables. @ServiceNow automated operational reporting (AOR) is the foundation for meaningful analytics - everyone in your org should be able to speak to key operational metrics and how they are performing. Do you have that transparency today? #know23
VividCharts tweet media
English
0
0
0
63
VividCharts
VividCharts@vividcharts·
Did your organization invest heavily in @ServiceNow only to allow resources to keep their manual PowerPoint presentations? (we bet your CIO loves this) If this is you, explore @vividcharts apps that deliver data visualizations & automated reporting directly in ServiceNow!
VividCharts tweet media
English
0
1
1
100
VividCharts
VividCharts@vividcharts·
@vividcharts & @Thirdera_ - driving better outcomes for @ServiceNow SPM customers! Join us for our first ever joint webinar on Thursday 2/23 featuring a deep dive into SPM reporting - your KPI measurement has never been this easy... Register here! hubs.la/Q01CVWz-0
English
0
0
1
62
VividCharts
VividCharts@vividcharts·
The much anticipated @vividcharts ITSM @ServiceNow reporting app suite is coming so soon! We heard our customers loud and clear - help us automate our most manual ITSM report outs! (we got you) Sign up for VividHub & never miss a release: hubs.la/Q01CvJyT0 -
VividCharts tweet media
English
0
0
2
93
VividCharts
VividCharts@vividcharts·
💘Words of affirmation are definitely our love language💘 "Great piece of software" "It was so easy to use" "We saved so much time" We're blushing, but please go on. 😍 Want to see @vividcharts reporting live in @ServiceNow? Check out the VividHub! hubs.la/Q01C0n4-0
VividCharts tweet media
English
0
1
2
110
VividCharts
VividCharts@vividcharts·
It's official - we're in a long term relationship with @thirdera_ (and we want everyone to know it). We're partnering with the SPM practice leads to bring you fresh @ServiceNow content in our joint webinar scheduled for 2/23 @ 11am ET. Don't miss it! hubs.la/Q01BLf5k0
English
0
0
1
81
VividCharts
VividCharts@vividcharts·
Welcome to the VividHub - where seeing is believing. Live, in-platform examples of our intuitive reporting platform are now available to explore in @ServiceNow! Getting started is easy - just navigate to the landing page below & verify your email! hubs.la/Q01BqY3c0
VividCharts tweet media
English
0
0
1
85
VividCharts
VividCharts@vividcharts·
Today is the day! We'll be live at 11am ET today to kick off our 3-part webinar series around the Unexpected Outcomes of Great @ServiceNow SPM reporting. You can sign up via Zoom using the link below. Don't miss out on this impactful series! hubs.la/Q01zGFQX0
VividCharts tweet media
English
0
0
1
104
VividCharts
VividCharts@vividcharts·
If you're in SPM in 2023, this isn't the year to try more, it's the year to DO MORE. And not only do more, but do more with less. Let's discuss in our new 3-part Zoom SPM webinar series on 1/31, 2/1 & 2/2 @ 11am ET - you can sign up at the link below! hubs.la/Q01yrqwm0
VividCharts tweet media
English
0
0
1
75