Matthew Is UNSTABLE ⚡️ retweetledi

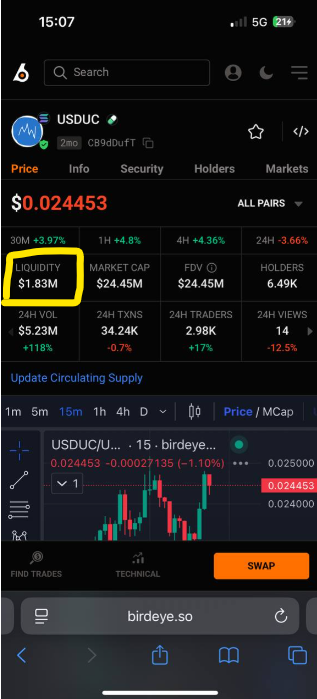
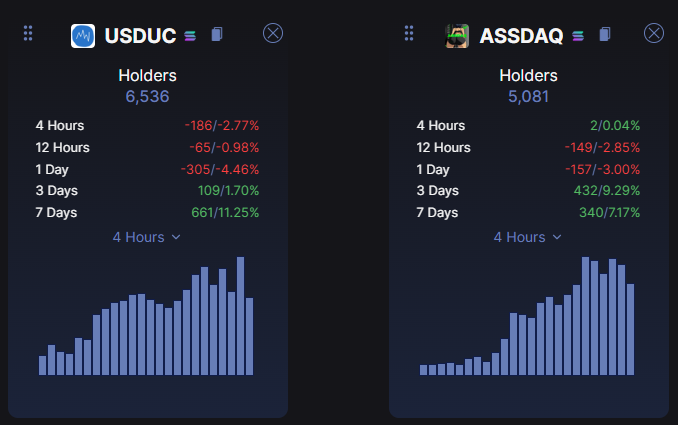
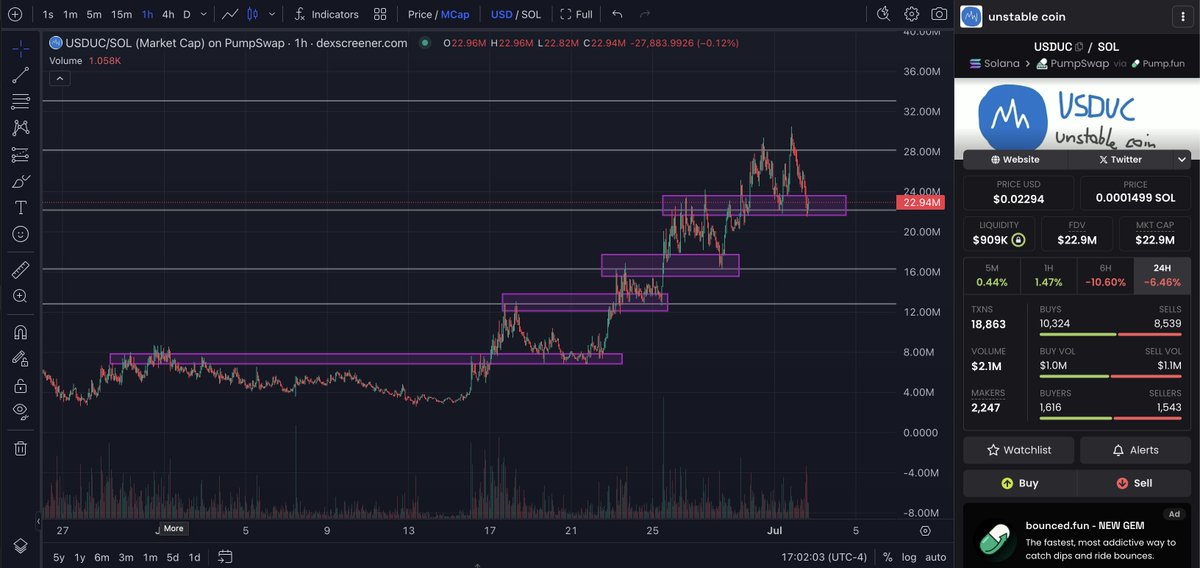
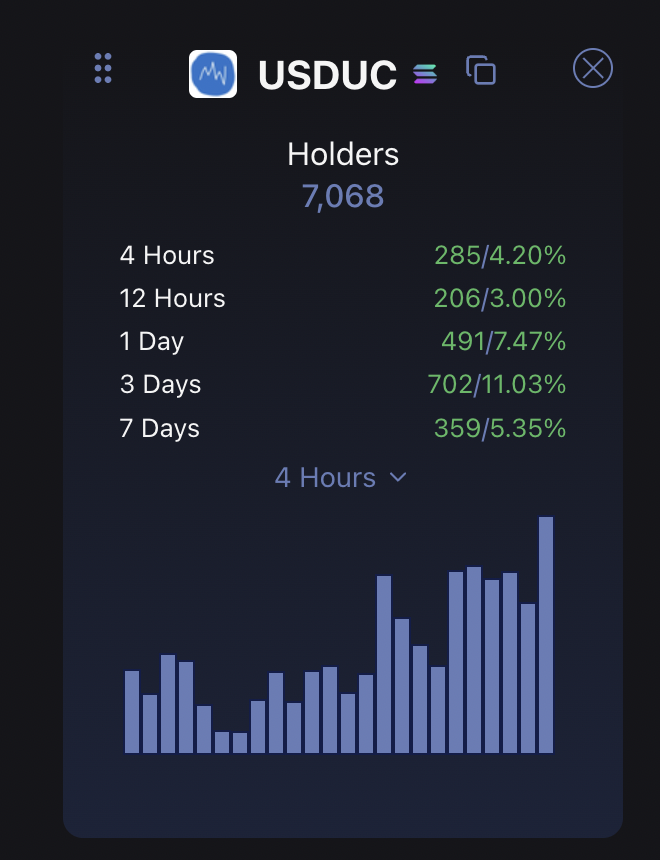
GM. Woke up to a $USDUC holder count ATH. Based.
Jeets out, cypherpunks in. This market is still very wack and rotational. Bonk ecosystem, Pump Fun TGE, and always something eh? The best projects always find a way to bust thru and win
There is no second best. Tackle 10k next
English