Sabitlenmiş Tweet

This is going to be the most important layout in your trading career.
Take it for free and thank me later.
English
When Sailing
1.4K posts

@WhenSailing
@MMT_Official_ ⛵ Full-time liveaboard & world traveler (7+ yrs) 💸 Full-time trader, charts fund the journey 🎓 Coach at MMT Academy

You have been marking levels manually. Companion does it automatically. On live data. Without your bias. New MMT Labs video with @WhenSailing breaks down exactly how to set it up, which AI model to use and how to go from zero to a fully working custom indicator with no coding experience needed! This is the video that changes how you interact with free data.


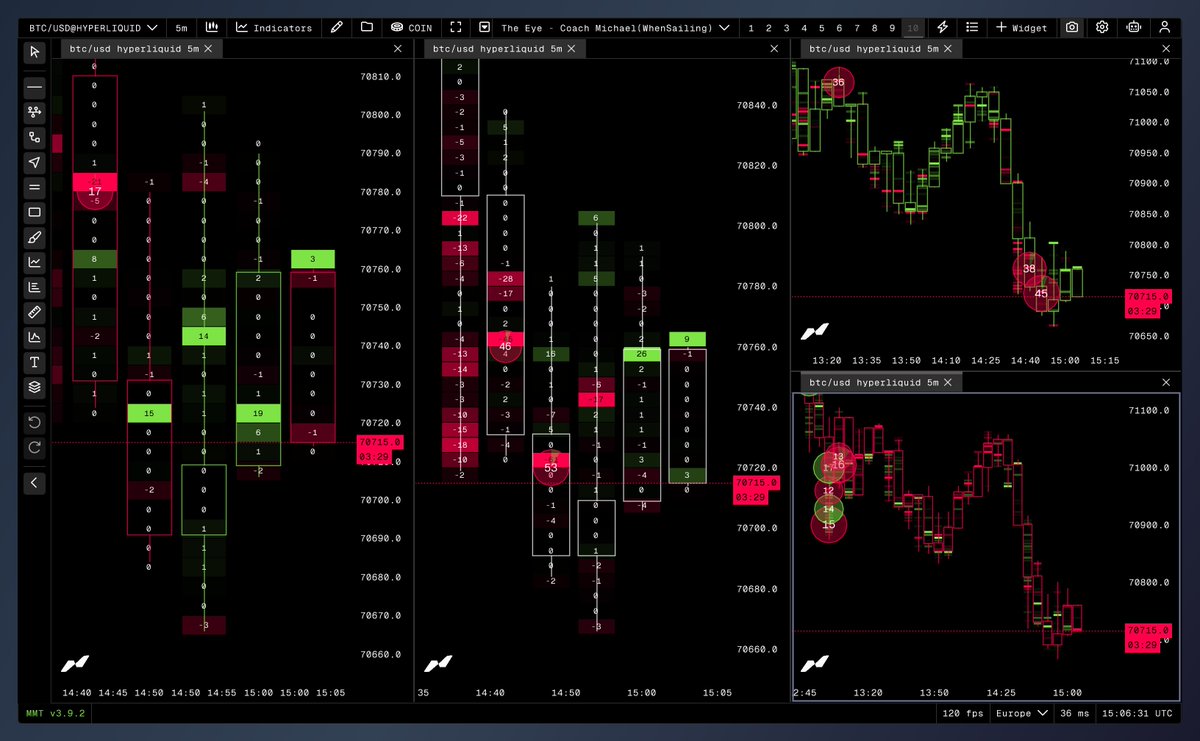
Quick Educational Note 👇 Price reacting at a heatmap level tells you where. Not what happened there. Overlay Net Longs and Net Shorts footprint directly on the heatmap and now you know: Net Longs footprint (left chart): Left side → Longs exiting. Right side → New longs entering. Net Shorts footprint (right chart): Left side → Shorts exiting. Right side → New shorts entering. Same wall. Now you know exactly who was there and what they did.

If you are not reading our weekly newsletter yet, you are missing out on hidden alpha.
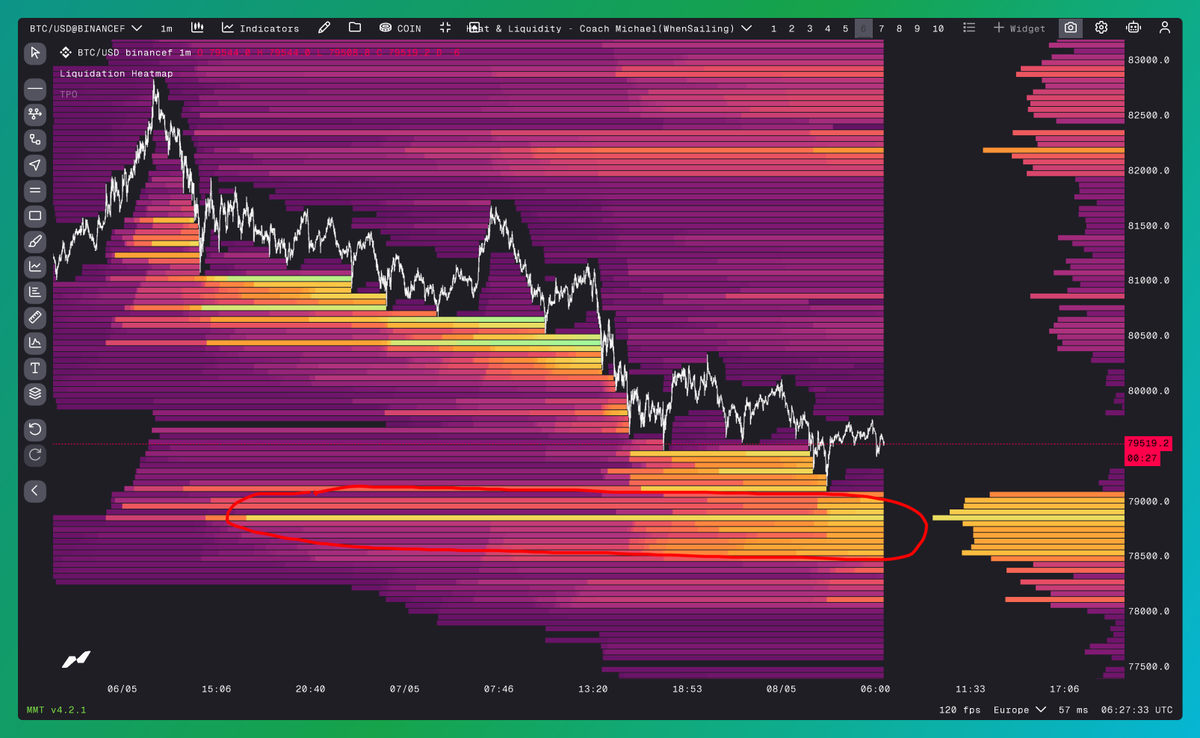
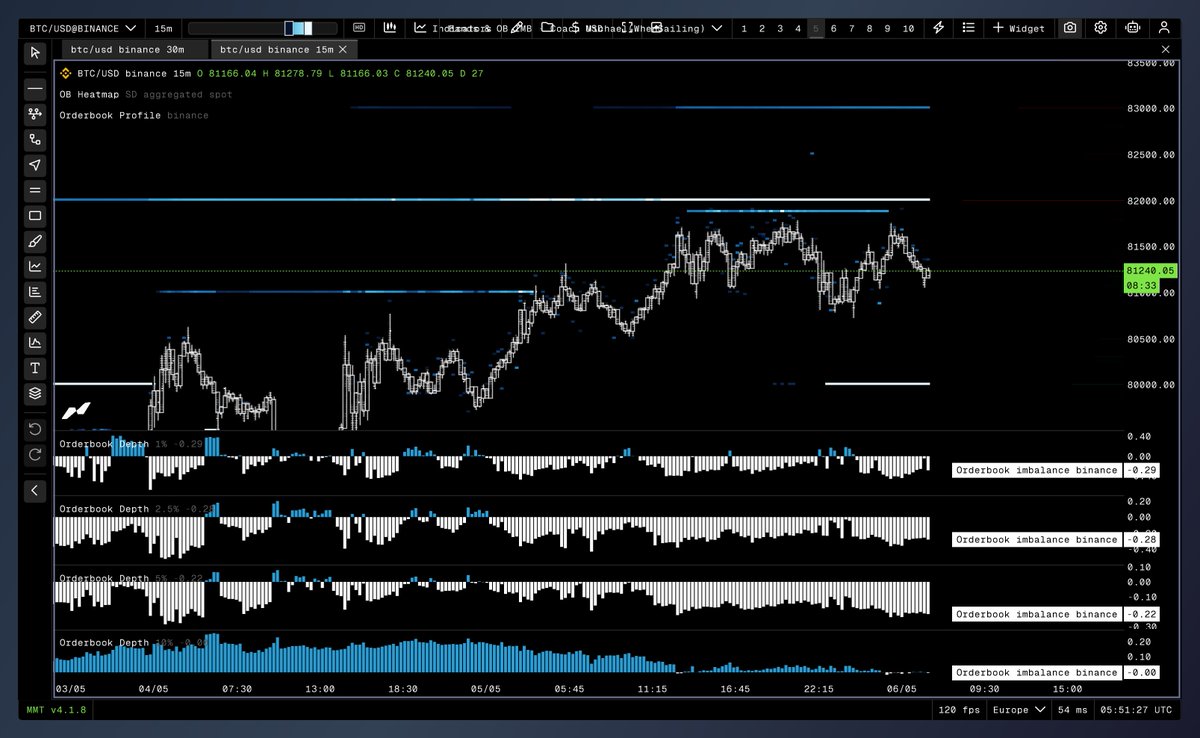
One heatmap shows you where the stops are. One heatmap shows you where the liquidations are. Stack both on the same chart and find where they overlap. Two sources of pain. One level. Inevitable.