
The World of Statistics
315 posts

The World of Statistics
@WorldOfStats44
World of Statistics turns numbers into stories. https://t.co/dOZf4HwPDZ
Katılım Şubat 2026
34 Takip Edilen10.7K Takipçiler

🔌 Top EV brands by global sales (2025):
1. BYD — 3.97M
2. Tesla — 1.64M
3. Geely — 0.95M
4. SAIC — 0.64M
5. Hyundai — 0.58M
6. BMW — 0.54M
7. Volkswagen — 0.50M
8. Changan — 0.49M
9. GAC — 0.45M
10. Xiaomi — 0.35M
6 of the top 10 EV brands are now Chinese.
Electric Vehicle Sales by Brand 2011-2025
Which EV brands are winning the global electric vehicle race?
Watch 15 years of competition unfold as Tesla, BYD, and a wave of Chinese startups battle for dominance. t.co/tbKZZfNRBq
English
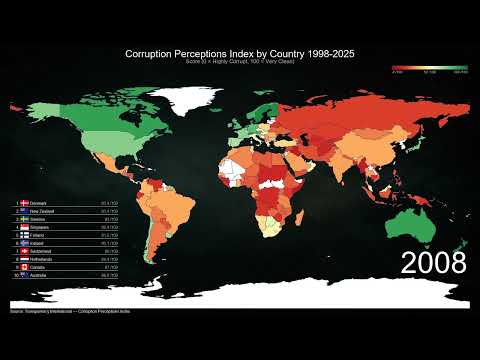
🏛️ Least corrupt countries (2025, 164 countries):
1. 🇩🇰 Denmark — 89
2. 🇫🇮 Finland — 88
3. 🇸🇬 Singapore — 84
4. 🇳🇴 Norway — 81
5. 🇳🇿 New Zealand — 81
6. 🇸🇪 Sweden — 80
7. 🇨🇭 Switzerland — 80
8. 🇳🇱 Netherlands — 78
9. 🇱🇺 Luxembourg — 78
10. 🇩🇪 Germany — 77
…
155. 🇰🇵 North Korea — 15
156. 🇸🇾 Syria — 15
157. 🇸🇩 Sudan — 14
158. 🇳🇮 Nicaragua — 14
159. 🇱🇾 Libya — 13
160. 🇪🇷 Eritrea — 13
161. 🇾🇪 Yemen — 13
162. 🇻🇪 Venezuela — 10
163. 🇸🇴 Somalia — 9
164. 🇸🇸 South Sudan — 9
All top 10 are also among the happiest countries. Coincidence? Probably not.
#CorruptionIndex #Transparency
English
🍔 Obesity rates — extremes:
🇳🇷 Nauru: ~61% of adults (highest in the world)
🇯🇵 Japan: ~4.0% of adults
A 15x difference in obesity prevalence between two countries.
Obesity Rate vs Food Calorie Supply by Country 1990-2026
How does food availability relate to obesity?
Watch 36 years of the global obesity epidemic unfold — from 1990 to 2026. t.co/JLHWpos63P
English

Healthcare Spending per Capita by Country 2000-2026
Healthcare spending per capita by country from 2000 to 2026.
Healthcare spending per capita by country from 2000 to 2026.
📊 WHAT THIS METRIC MEANS Current health expenditure per capita measures the total spending on healthcare goods and services per person in a country, expressed in current US dollars. It includes government spending, private insurance, out-of-pocket payments, and other financing. It does NOT include capital investment in health infrastructure.
📂 DATA SOURCES • World Bank: World Development Indicators — Current health expenditure per capita (SH.XPD.CHEX.PC.CD), covering 25 countries • WHO: Global Health Expenditure Database (GHED) • 2024 data: World Bank preliminary + US CMS National Health Expenditure projections • 2025–2026: Projected at ~4% annual growth based on recent trends
🔢 HOW IT'S CALCULATED: Total current health expenditure divided by mid-year population. Values are in current US dollars (not adjusted for inflation or purchasing power parity). Currency exchange rate fluctuations affect cross-country comparisons.
🌍 COUNTRY COVERAGE 25 countries selected: major OECD economies and high-income nations with complete data from 2000 onward.
⚠️ NOTE • Values are in current USD — currency fluctuations can cause apparent drops (e.g. Japan, Norway) even when local-currency spending increased. • The United States consistently spends 2-3x more per capita than other wealthy nations. • 2024 values for some countries are preliminary; 2025–2026 are projections.
English
Our data is built from publicly available sources (OECD, World Bank, UN, IMF) — we collect, combine, and fill gaps across different datasets rather than generating original data.
There's no public API or repo at the moment. It's something we'd like to offer in the future, but we'd need to sort out the licensing and legal side first, since each source has its own terms.
In the meantime, each YouTube video description lists the exact sources used — you can pull directly from those. Cool project btw!
English

@WorldOfStats44 Do you have an API or open source repository? Would love to include a lot these data points in github.com/bit-of-a-shamb…
English
🇺🇦 Ukraine's arms imports:
2021: $44 million
2024: $5,230 million
A 119x increase in 3 years. The largest emergency rearmament of any country in the 21st century.
Arms Imports by Country 1960-2024
English
@avidseries Thank you for the kind words and the shoutout — really means a lot. This is just a passion project, so knowing people appreciate the work is the best motivation to keep going. 🙏
English

A hard-working account with only 55 followers is creating and posting several original graphs a day (many of them dynamic).
Might be worth a follow for those of you who are data-oriented.
The World of Statistics@WorldOfStats44
📡 Highest internet penetration rates (2026, 208 countries): 1. 🇮🇸 Iceland — 98.2% 2. 🇩🇰 Denmark — 98.1% 3. 🇦🇪 UAE — 98.0% 4. 🇰🇷 South Korea — 97.5% 5. 🇨🇭 Switzerland — 96.8% 6. 🇸🇪 Sweden — 96.5% 7. 🇳🇱 Netherlands — 96.3% 8. 🇬🇧 UK — 96.1% 9. 🇳🇴 Norway — 96.0% 10. 🇩🇪 Germany — 95.8% Small, wealthy countries with strong infrastructure lead connectivity.
English
@CarlSmoooooooth Please check the video description for detailed information: youtube.com/watch?v=_CSBHo…
YouTube
English

@WorldOfStats44 Nice animations but what is the source?
English
Japan's Aging Crisis 1950–2100
Watch Japan transform from a young, growing nation to the world's oldest society — a dramatic population shift from 1950 to 2100.
GlobalStatsX@GlobalStatsX
🇯🇵 Population of Japan (1955–2025) 👥 1955 ➜ 92,425,478 👥 1960 ➜ 96,399,754 👥 1965 ➜ 100,916,019 👥 1970 ➜ 106,712,368 👥 1975 ➜ 113,321,196 👥 1980 ➜ 118,358,756 👥 1985 ➜ 120,832,163 👥 1990 ➜ 123,399,765 👥 1995 ➜ 125,672,665 👥 2000 ➜ 127,027,789 👥 2005 ➜ 127,913,330 👥 2010 ➜ 128,185,275 👥 2015 ➜ 127,275,872 👥 2020 ➜ 126,304,543 👥 2022 ➜ 124,997,578 👥 2023 ➜ 124,370,947 👥 2024 ➜ 123,753,041 👥 2025 ➜ 123,103,479 📊 Source: Worldometers
English
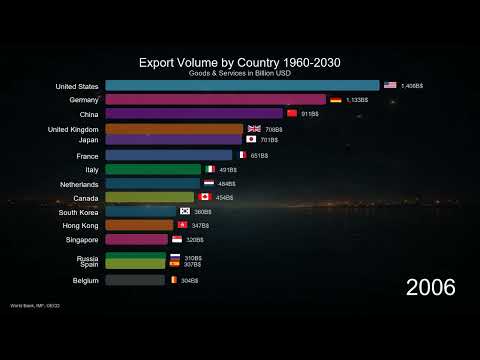
📦 Top exporting countries (2025, 55 countries):
1. 🇨🇳 China — $4,030B
2. 🇺🇸 USA — $3,343B
3. 🇩🇪 Germany — $1,999B
4. 🇬🇧 UK — $1,193B
5. 🇫🇷 France — $1,110B
6. 🇸🇬 Singapore — $1,057B
7. 🇳🇱 Netherlands — $1,049B
8. 🇮🇪 Ireland — $968B
9. 🇯🇵 Japan — $922B
10. 🇮🇳 India — $905B
…
46. 🇦🇷 Argentina — $101B
47. 🇵🇪 Peru — $90B
48. 🇨🇴 Colombia — $71B
49. 🇪🇬 Egypt — $66B
50. 🇳🇿 New Zealand — $66B
51. 🇧🇩 Bangladesh — $50B
52. 🇵🇰 Pakistan — $41B
53. 🇬🇭 Ghana — $30B
54. 🇰🇪 Kenya — $23B
55. 🇪🇹 Ethiopia — $9B
English
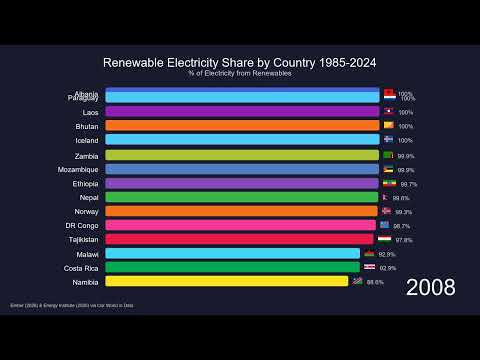
🇵🇾 Paraguay generates nearly 100% of its electricity from renewables.
The reason? The Itaipu Dam — one of the world's largest hydroelectric plants, shared with 🇧🇷 Brazil.
Geography can be the ultimate energy advantage.
English
@sanchezcastejon Democracy Index by Country 2006-2026
Which countries are the most and least democratic?
Watch the EIU Democracy Index evolve from 2006 to 2026 on an animated world map.
English

Acabamos de conocer los resultados del nuevo índice de calidad democrática de The Economist. España mejora aún más su puntuación respecto al año anterior y se consolida como una de las democracias más plenas del mundo.
Lo mismo que ha ocurrido en las actualizaciones de los rankings de V-DEM y Freedom House.
Frente al ruido de unos, los datos de la ciencia. Y frente a la inestabilidad del mundo, una España cada día mejor.
economist.com/interactive/de…
Español
@clashreport Fertility Rate vs Education by Country 1960-2020
Does education reduce birth rates?
Watch 60 years of global data reveal one of the strongest patterns in development — from 1960 to 2020.
English

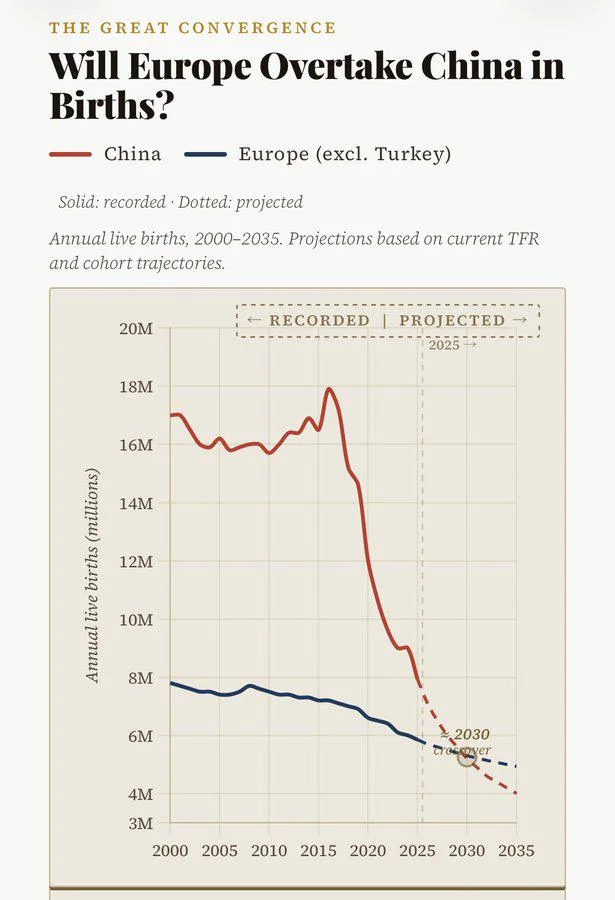
INTERESTING: For the first time in history, Europe is set to overtake China in terms of annual births.
English
📺 Most subscribed YouTube channels (2026):
1. MrBeast — 472M
2. T-Series — 292M
3. Cocomelon — 186M
4. SET 🇮🇳 India — 179M
5. PewDiePie — 111M
6. MrBeast 2 — 107M
7. Vlad and Niki — 120M
8. Like Nastya — 119M
9. Zee Music Company — 114M
10. Goldmines — 112M
MrBeast has more subscribers than the entire population of the 🇺🇸 United States.
English