Sabitlenmiş Tweet

Publicly available protein databases: The game-changer medical infrastructure
/!\ This is likely to become one of the most important medical and biotech infrastructure layers of the decade.
While most attention goes to chips, GPUs, and frontier models, the real long-term AI infrastructure in medicine may actually be biological data itself.
Public protein databases are becoming the digital backbone of drug discovery, diagnostics, protein engineering, and precision medicine.
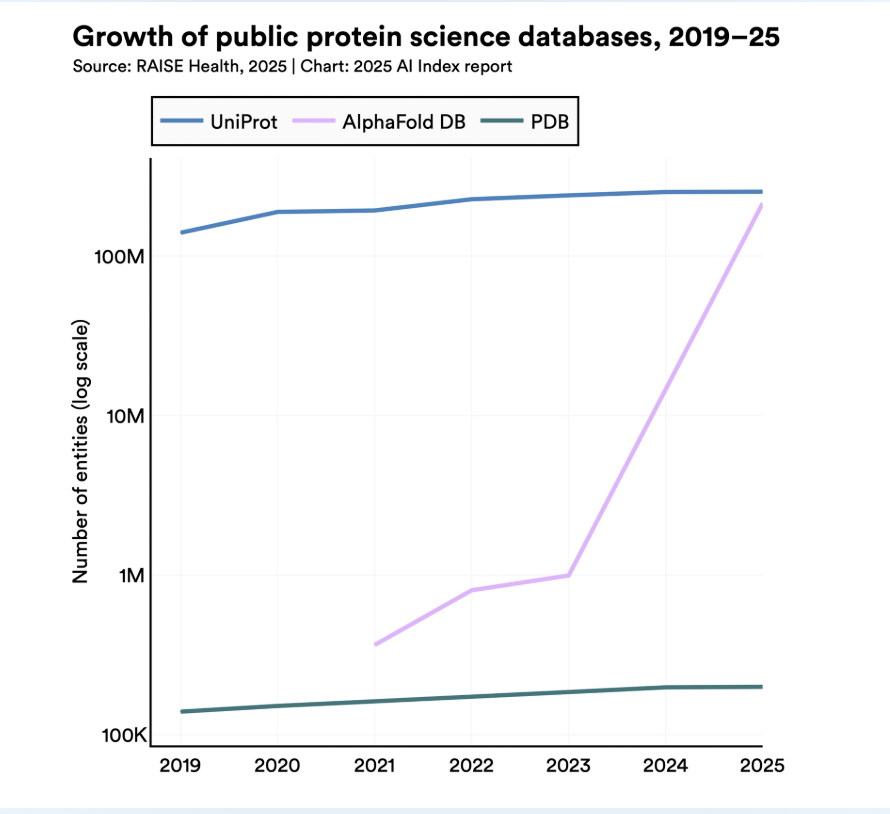
Interpretation of the chart
The most explosive signal is AlphaFold DB.
It jumps from roughly: ~1M structures in 2023 to ~200M in 2025. That is extraordinary.
Meanwhile:
UniProt remains above 100M and continues rising
PDB grows steadily from ~140K to ~200K
They are built through a broad ecosystem of:
academic laboratories
hospitals and clinical centers
structural biology consortia
pharmaceutical R&D
cryo-EM and X-ray crystallography facilities
AI-based structure prediction systems
In other words, this is scientific infrastructure compounding in public view.
What does this actually mean?
A protein database stores:
amino acid sequences
experimentally resolved 3D structures
AI-predicted folds
binding pockets
mutations
disease associations
enzyme functions
The three pillars in the chart represent different layers of this stack:
UniProt: the core sequence and functional annotation layer
PDB: experimentally validated 3D protein structures
AlphaFold DB: AI-predicted 3D structures at planetary scale
Think of it as: the Bloomberg terminal of biology
Who contributes to it?
This infrastructure is built by a global public-private knowledge network.
1) Universities and research labs: MIT, Stanford, Oxford, EMBL, Max Planck, and thousands of labs globally.
2) Public research institutions: NIH, EMBL-EBI, and national genome programs.
3) Hospitals and clinical research centers: Especially for disease-linked mutations and rare protein variants.
4) AI labs: DeepMind, Isomorphic Labs, and computational biology teams.
5) Pharma and biotech: For target validation, protein-ligand mapping, antibodies, and therapeutic proteins.
Where do these proteins come from?
They emerge from:
genome sequencing
cancer biopsies
pathogen surveillance
antibody discovery
rare disease studies
plant biology
synthetic biology
microbial screening
Every new pathogen, mutation, or disease mechanism can rapidly expand this public infrastructure.
Why is this such a big deal?
Because it compresses the cost and time of biological discovery.
1) Faster drug discovery: Known targets make molecule design dramatically faster.
2) Better cancer diagnostics: Protein mutations can be linked to treatment pathways.
3) Precision medicine: Patient-specific variants can be interpreted faster.
4) New industrial enzymes: For food, agriculture, materials, and climate tech.
5) Protein engineering: Antibodies, enzymes, and therapeutic proteins can now be designed at scale.
What does this lead to next?
The downstream effects are enormous:
AI-designed drugs
biologics acceleration
rare disease therapeutics
climate biotech enzymes
protein-based materials
synthetic biology platforms
faster vaccine design
Source: @Stanford
English