Zebra BI

4.2K posts

Zebra BI banner
Zebra BI

Zebra BI

@ZebraBI

The most powerful and intuitive #datavisualisation technology for Microsoft's #PowerBI, #Excel, and #PowerPoint!

Ljubljana, Slovenia Katılım Ocak 2014
853 Takip Edilen5.4K Takipçiler
Zebra BI
Zebra BI@ZebraBI·
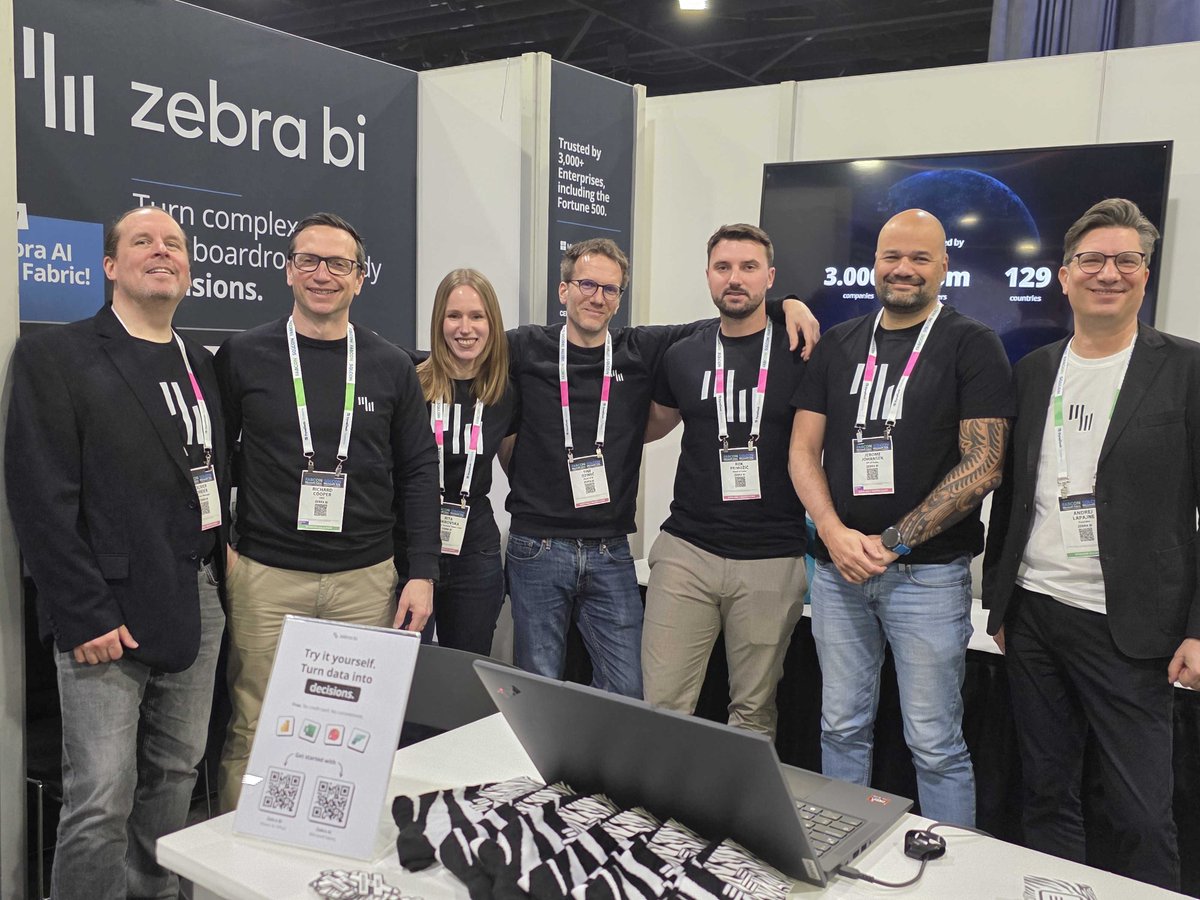
We're on the floor at #FabCon2026 and a customer just told us "I love the variances." That's it. That's the tweet. (Okay fine, there's more.) Zebra AI went GA in Microsoft Fabric this week. The booth has been nonstop. 
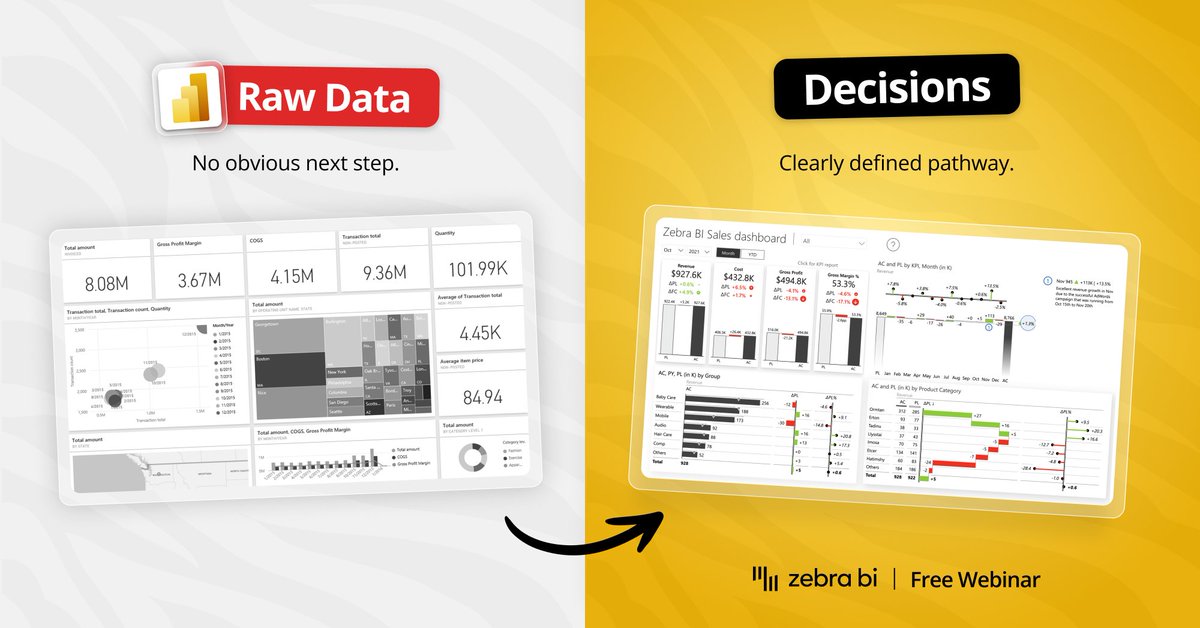
Customers, partners, data teams, all asking the same thing: how do I get from data in Fabric to a decision my CFO actually acts on? Turns out that's exactly what we built. Booth 742. Bring questions. Leave with merch. 🦓 #FabCon #SQLCon #MicrosoftFabric #PowerBI #ZebraAI @msPartner
English
0
0
0
70
Zebra BI
Zebra BI@ZebraBI·
Exciting news from #FabCon and #SQLCON 2026: Zebra AI is now generally available in Microsoft Fabric. @msPartner Zebra AI helps teams turn raw business data into insights your leadership can take decisions and act on. It works best with structured business data: the kind teams already use for reporting, planning, and performance tracking. From there, Zebra AI can highlight what changed, explain the likely reasons why, and build a clear visual story your team can explore further and export to Excel or PowerPoint. For monthly close, QBRs, and business reviews, or just ad hoc analysis that means less manual work and faster decisions. Zebra AI is now available in the Microsoft Fabric Workload Hub. Full announcement: bit.ly/4sNCQ0v #MicrosoftFabric #PowerBI #ZebraAI
Zebra BI tweet media
English
0
0
1
170
Zebra BI
Zebra BI@ZebraBI·
We're at booth 742 at #FabCon2026 and ready for your toughest Power BI and Fabric reporting questions. Come say hi, grab some zebra merch, and put us to the test. #SQL2026 @msPartner
Zebra BI tweet media
English
0
1
1
84
Zebra BI
Zebra BI@ZebraBI·
We’re at FabCon 2026 Atlanta this week and we’re bringing the Zebra BI team. If you’re working with Microsoft Fabric / Power BI, come by Booth 742 to: ✨ see Zebra BI + Fabric in action ✨ get help with KPI design & executive-ready reporting ✨ ask anything about Zebra AI and what’s new Want to meet someone specific from the team (founder, CEO, Sales, BI, or Customer Success)? Comment or DM and we’ll line up a time. #FabCon #MicrosoftFabric #PowerBI #BusinessIntelligence
Zebra BI tweet media
English
0
1
2
73
Zebra BI
Zebra BI@ZebraBI·
Recent research suggests slow decision-making can cost companies up to 5% of annual revenue. The cause isn’t bad data or the wrong tools. It’s that data reaches decision-makers without context, without a narrative, and without a recommended next action. That’s the Last Mile staying open. On March 26, 6 pm CET, we walk through how to close it: a live build, a real client case, and a framework for the next report your team publishes. 🖱️Register here: bit.ly/3MZCOng #ZebraBI #Webinar #IBCS #PowerBI
Zebra BI tweet media
English
0
0
0
63
Zebra BI
Zebra BI@ZebraBI·
Still explaining your Power BI reports in meetings instead of just sharing them? Join our monthly Zebra BI Live Demo on March 18th! See how to build reports that answer the question before anyone asks it. Ask us anything live. Hands-on, open session. Free to join. Save your spot: bit.ly/4u4cl8N #ZebraBI #LastMileAnalytics #PowerBI #LiveDemo
Zebra BI tweet media
English
0
0
0
64
Zebra BI
Zebra BI@ZebraBI·
There's a three-line rule for Power BI chart titles that makes every report self-explanatory. Most finance teams don't know it exists. It comes from IBCS (International Business Communication Standards), the reporting framework used by AbbVie, Bayer, and Nestlé to standardize how data gets presented across teams and geographies. The structure: Line 1: Reporting unit - who is this about? Line 2: Business measure (bold) + units - what are we looking at? Line 3: Time period + scenario - when, and compared to what? Before Zebra BI Rich Titles, you couldn't build this properly inside a Power BI visual. You'd approximate it in a flat text field, then rebuild it manually in PowerPoint every time. Now you can do it directly in the visual. Bold the measure. Add the line break. Control the alignment. Export it to PowerPoint, and the formatting comes with it. For FP&A teams building P&L reports that go to the board, this is the difference between a report that explains itself and one that starts a conversation you didn't plan for. If you want the IBCS title template, we've dropped it in the comments. #ZebraBI #FinancialReporting #PowerBI #IBCS
English
1
0
2
218
Zebra BI
Zebra BI@ZebraBI·
📊 Part 2 of our Last Mile webinar series is confirmed. March 26, 6 PM CET. Why does BI stall after dashboards go live? Part 1 diagnosed it. Part 2 shows how to fix it. Expect a live Power BI build, real use cases, and a framework you can apply right away. Join BI experts Marnix Jansen, Mark Leskovšek, and Matej Gregorčič. Register here: bit.ly/40p4MvK #ZebraBI #Webinar #PowerBI
Zebra BI tweet media
English
0
0
0
86
Zebra BI
Zebra BI@ZebraBI·
✨FT 1000. For the third time. ✨ Zebra BI ranks #512 among Europe's fastest-growing companies in 2026. From 2021 to 2024: → 174% revenue growth → 1.5M users across 115 countries → Team grew from 18 to 70+ None of this happens without the companies that trusted us early, pushed us with hard feedback, and kept raising the bar on what good reporting should look like. And to the Zebra BI team: this one's yours. Full announcement here: bit.ly/4bhVeaG #ZebraBI #PowerBI #FinancialTimes1000
Zebra BI tweet media
English
0
0
0
70
Zebra BI
Zebra BI@ZebraBI·
The data pipeline is clean. The model is solid. The dashboard is live. And yet the CFO is still asking for an Excel export. It's not a trust problem. It's not a data quality problem. It's a last mile problem. The gap between a dashboard being built and a decision being made is where most BI investments go unrealized. Gartner says 80% of analytics initiatives fail to deliver business outcomes. Not because of the tools. Because of what happens after the tools do their job. We just kicked off a three-part series on exactly this: "Why BI Fails in the Last Mile." Tine Ozimic and Mark Leskovsek ran Part 1 last week. The Q&A alone was worth showing up for: real practitioners, real versions of that Excel export moment. Part 2 is March 26. If your CFO is still reaching for Excel despite a full BI stack, that's the session to attend. Watch Part 1 here 👇 bit.ly/4aU3Qpd #LastMileAnalytics #PowerBI #ZebraBI
Zebra BI tweet media
English
0
0
1
85
Zebra BI
Zebra BI@ZebraBI·
Over 900 people are joining us live today at 6:00 PM CET — finance and BI leaders who want to understand why BI investments stall in the last mile and what top-performing teams do differently. The session is free. We are hosting it live. And there's still time to join them. "Why BI Fails in the Last Mile" starts today at: 👉 9:00 AM PST / 12:00 PM EST / 6:00 PM CET Grab your spot here: bit.ly/3Njvhj5 #LastMile #BusinessIntelligence #ZebraBI #Webinar
Zebra BI tweet media
English
0
0
1
99
Zebra BI
Zebra BI@ZebraBI·
Imagine trying to get a clear view of company performance when every business unit reports differently. That was Heijmans' reality, until they standardized with Zebra BI. Read their transformation story: bit.ly/4qZnLIo
Zebra BI tweet media
English
1
0
0
109
Zebra BI
Zebra BI@ZebraBI·
Rich Titles Formatting is now live in Zebra BI. The title of a chart is the first thing anyone reads. And most of the time, it raises more questions than it answers. "Revenue - Q1" ... but which revenue? Which regions? Compared to what? That's not a data problem. It's a labeling problem. And until now, Power BI gave you a flat text field and wished you luck. You can now format chart and table titles directly inside the visual, the same way you would in a word processor: ✨Bold the metric that matters ✨Add a line break to separate the time period ✨Control font size and color independently ✨Enable text wrapping on any screen size And when you export to PowerPoint or PDF, every format stays exactly as you built it. No rebuilding in slides. No last-minute fixes before the board meeting. Click. Type. Format. Done. Full update in the comments. 👇 #ZebraBI #BusinessIntelligence #PowerBI #ProductUpdate
Zebra BI tweet media
English
1
0
2
129
Zebra BI
Zebra BI@ZebraBI·
If your Power BI “commentary” is just narrating the chart… it’s not commentary. Use this instead: Insight (what) → Cause (why) → Recommendation (now what) Max 3 sentences. No vague fluff. Checklist + YT walkthrough: bit.ly/3ZVsi3e #PowerBI #Analytics #ZebraBI
Zebra BI tweet media
English
0
0
2
140
Zebra BI
Zebra BI@ZebraBI·
Today, Zebra BI enters a new chapter. Richard Cooper joins as our CEO, bringing the leadership to drive our global expansion and accelerate what we're building with Zebra AI. This moment is built on 11 years of founder-led growth under Andrej Lapajne. He created something that thousands of teams around the world now rely on to make better decisions, faster. Andrej transitions into the role of Founder & Chief Product Strategist and remains Chairman of the Board. His vision continues to shape where Zebra BI is headed. Thank you for 11 years of building, believing, and never settling. The company you built made this next chapter possible. We're excited for what comes next. ✨ Read the full announcement here: bit.ly/4s7siZX #ZebraBI #ZebraAI #BusinessIntelligence #GlobalExpansion
Zebra BI tweet media
English
1
1
2
221
Zebra BI
Zebra BI@ZebraBI·
Quick update on today's webinar. We've moved "Why BI Fails in the Last Mile" to Thursday, March 5. Same session, same value, just a better day for us to show up live! Already registered? You're all set. Your spot carries over automatically. Haven't grabbed a spot yet? Still time. Join us here: bit.ly/4aRpUPM 👉 Date: Thursday, March 5, 2026 👉 Time: 9:00 AM PST / 12:00 PM EST / 6:00 PM CET See you on the 5th. #LastMile #BusinessIntelligence #ZebraBI #Webinar
Zebra BI tweet media
English
1
0
1
108