Sabitlenmiş Tweet

My view on trading 📈
Some people ask for daytrading tips, but here’s my take:
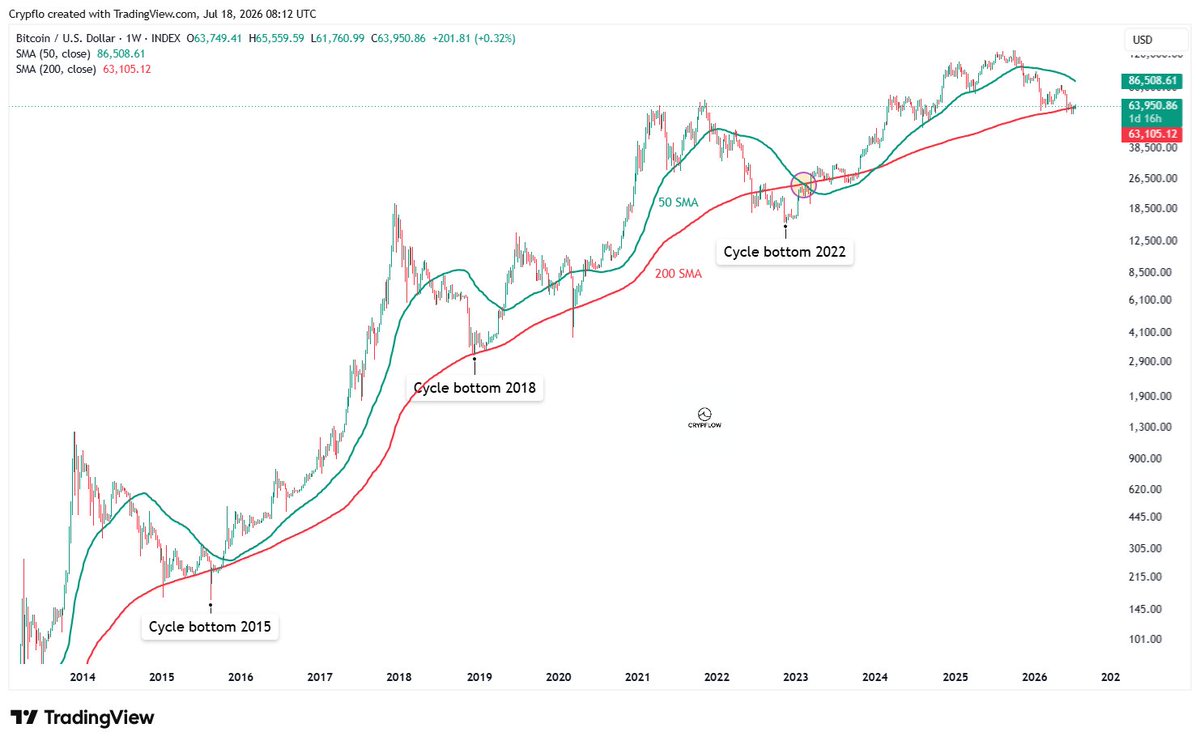
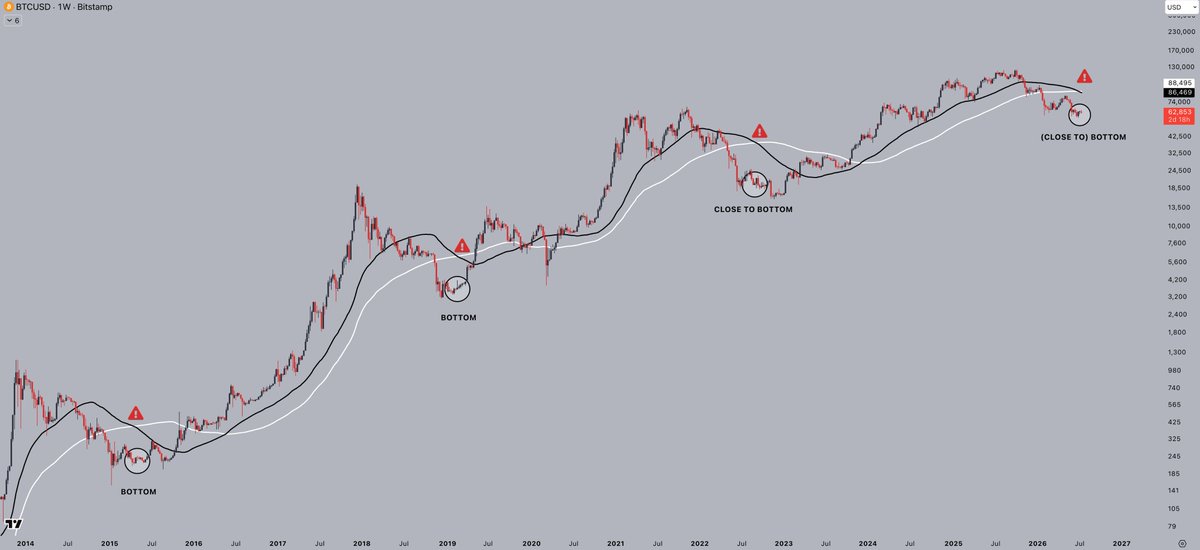
I don’t chase every candle or stare at micro-charts. I focus on weekly/monthly setups that spark major moves.
I spot macro trend reversals so I trade less, profit more.
Time is our most valuable asset, so I refuse to be glued to the screen 24/7.
🎯 My mission: Build freedom, not another 9–5.
⚡ Trade smarter, not harder: Spot the macro trends that matter.
Ready to catch the next big wave? 🌊
#CrypFlow #Crypto #FinancialFreedom
English